タンパク質結晶構造解析のためのクリスタルヒットを得るためのハイスループットスクリーニング(英語)
要約
このプロトコルは、1,536マイクロアッセイプレート調製から6週間の実験時間枠の終わりまで、ハイスループット結晶化スクリーニングの詳細を示しています。サンプルのセットアップ、得られたイメージング、および人工知能対応のグラフィカルユーザーインターフェイスを使用して分析を実行し、高分子の結晶化条件を迅速かつ効率的に特定する方法に関する詳細が含まれています。
要約
X線結晶構造解析は、高分子構造を識別するために最も一般的に使用される技術ですが、タンパク質を回折に適した規則格子に結晶化するという重要なステップは依然として困難です。生体分子の結晶化は大部分が実験的に定義されており、このプロセスは労働集約的であり、資源の限られた機関の研究者にとっては法外なものになる可能性があります。国立ハイスループット結晶化(HTX)センターでは、幅広い結晶化パラメータをサンプリングするように設計された自動化されたハイスループット1,536ウェルマイクロバッチアンダーオイルプレートセットアップなど、結晶成長を促進するための再現性の高い方法が実装されています。プレートは、最先端のイメージングモダリティを使用して6週間にわたって監視され、結晶成長に関する洞察を提供し、貴重な結晶ヒットを正確に区別します。さらに、結晶ヒットを識別するためのトレーニングされた人工知能スコアリングアルゴリズムの実装と、実験画像を表示するためのオープンソースのユーザーフレンドリーなインターフェイスを組み合わせることで、結晶成長画像の分析プロセスを合理化します。ここでは、カクテルと結晶化プレートの調製、プレートのイメージング、再現性を確保し、結晶化の成功の可能性を高める方法でのヒットの識別のための主要な手順と機器について説明します。
概要
構造生物学的手法が飛躍的に進歩した時代においても、X線結晶構造解析は、高分子の高品質な構造モデルを生成するための信頼できる一般的な方法であり続けています。タンパク質データバンク(PDB)に寄託された3次元構造モデルの85%以上が結晶構造法によるものです(2023年1月現在)。1 さらに、X線結晶構造解析は、創薬・開発プロセスの重要な要素であるタンパク質-リガンド構造解析の解明に不可欠であり続けています2。タンパク質の結晶化は半世紀以上にわたって支配的な構造生物学技術であり続けていますが、物理的特性3または配列4,5に基づいて結晶化の可能性を予測する方法はまだ初期段階にあります。
結晶化条件の予測はさらに曖昧です。モデルタンパク質についてさえ、結晶化条件の可能性を予測するための進歩は限られています6,7。他の研究では、タンパク質の相同性およびPDB 8,9,10から採掘された条件に基づいて結晶化条件を同定することが試みられている。しかし、PDBで見られる予測力は限られており、最終的な成功した結晶化条件のみが堆積され、必然的に、結晶成長を微調整するために必要な広範な最適化実験を見逃します。さらに、多くのPDBエントリには、カクテルフォーミュラ、結晶化フォーマット、温度、結晶化までの時間など、これらの詳細を含むメタデータがありません11,12。したがって、関心のある多くのタンパク質について、結晶化条件を決定するための最もアクセスしやすい方法は、広範囲の化学的可能性にわたって可能な限り多くの条件を使用して実験することです。
結晶化スクリーニングを可能な限り実りある徹底的なものにするためのいくつかのアプローチが、疎マトリックス13、不完全要因スクリーニング14、添加剤15、16、播種17、および核剤18を含む大きな効果をもたらすように探求されてきた。ハウプトマン・ウッドワード医学研究所(HWI)の国立HTXセンターは、マイクロバッチ・アンダーオイル・アプローチ19を使用して結晶化スクリーニングのための効率的なパイプラインを開発し、自動化されたリキッドハンドリングとイメージングモダリティを利用して、比較的最小限のサンプルとカクテル量で初期結晶化条件の同定を合理化しました(図1).1,536種類のユニークなカクテルのセットは、タンパク質の結晶成長に資すると以前に決定された条件に基づいており、広範囲の可能な結晶化条件をサンプリングするために化学的に多様であるように設計されています20、21、22。結晶化条件の広範なサンプリングは、1つまたは複数の結晶化リードを観察する可能性を高める。
スクリーニングに必要な条件の数に関する正式な分析はほとんど文献に現れていない。ある研究では、さまざまな画面のサンプリングレイアウトに焦点を当て、成分のランダムサンプリング(不完全な要因論と同様)が最も完全で効率的なサンプリング方法であることがわかりました23。スクリーニングに関する別の研究では、非常に徹底的な1,536スクリーンが単結晶ヒット24しか得られなかった例が数多くあり、ごく最近の研究では、ほとんどの商用スクリーンがスクリーニングヒット25に関連することが知られている結晶化空間をアンダーサンプリングしていることが強調されています。すべての結晶化リードが、結晶内の固有の乱れ、回折制限、または結晶欠陥のために、データ収集に適した回折品質の結晶を生成するわけではありません。したがって、条件に対してより広いネットをキャストすることには、最適化のための代替結晶形を提供するという追加の利点があります。
タンパク質結晶化実験の形式も、スクリーニングの成功に影響を与えます。蒸気拡散は、ハイスループット結晶化アプリケーションで最も一般的に使用されるセットアップであり、EMBLハンブルクおよびパスツール研究所のハイスループットスクリーニングセンター26、27、28などの最先端の結晶化センターで利用されています。HTXセンターは、マイクロバッチアンダーオイル法を使用しています。あまり一般的ではないが、サンプルおよび結晶化カクテル20、21、22の消費を最小化する堅牢な方法である。マイクロバッチアンダーオイル法の利点の1つは、特に高粘度パラフィンオイルを使用する場合、実験中に液滴内でわずかな蒸発しか起こらないことであり、液滴混合時に平衡濃度が達成されることを意味します。マイクロバッチアンダーオイル法で正の結晶化結果が観察される場合、これらの条件の再現は、通常、結晶化液滴とリザーバーの間の平衡化中のある未定義の点で結晶化が起こる蒸気拡散セットアップよりも簡単です。ヒットの再現性は、単結晶X線実験用に最適化する必要がある非常に小さなタンパク質結晶を生成するハイスループット結晶化アプローチにとって望ましいものです。
可溶性タンパク質用のハイスループット結晶化スクリーンは、社内で調製されたカクテル、既製の市販スクリーン、および社内で改変された市販スクリーン22で構成される。カクテルは当初、以前に成功した結晶化カクテル20を使用した不完全実施要因戦略を使用して開発されました。市販されているスクリーン内の試薬には、ポリマー、結晶化塩、PEG、およびイオンの組み合わせのアレイと、スパースマトリックスと不完全要因アプローチを利用するスクリーニングが含まれます。また、添加剤スクリーン、pHおよびバッファースクリーン、イオン液体添加剤スクリーン、ポリマースクリーンなど、スクリーンに含める前に修飾される試薬もあります。
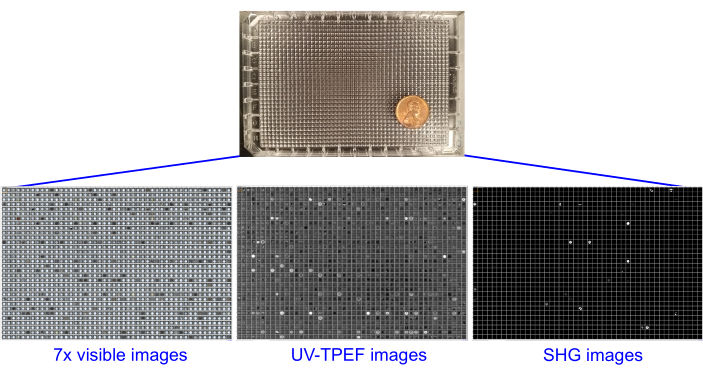
既知の結晶化条件と戦略の力は、1,536の結晶化カクテルで活用されており、マイクロバッチアンダーオイルシステムの利点とともに、自動リキッドハンドリング、自動明視野イメージング、およびキラル結晶の2次非線形イメージング(SONICC)を採用するパイプラインを生成します。リキッドハンドリングとイメージングの両方の自動化により、ウェットラボの時間が短縮され、再現性が向上するという利点があります。自動結晶化スクリーニングのハイスループットな性質により、結晶成長のモニタリングプロセスの自動化が必要です。これらの進歩は、ポジティブクリスタルヒットの識別を支援する最先端のイメージング技術によって達成されます。プレートの標準的な明視野イメージングと、検出を強化するための多光子法の両方が、SONICCを備えた結晶イメージングシステム を介して 使用されます(図2)。SONICCは、第2高調波発生(SHG)29 顕微鏡と紫外2光子励起蛍光(UV-TPEF)30 顕微鏡を組み合わせて、非常に小さな結晶や沈殿物によって隠されている結晶を検出します。SONICCイメージングは、ウェルにタンパク質(UV-TPEF経由 )と結晶(SHG経由 )が含まれているかどうかを通知します。タンパク質結晶の確実な同定以外にも、最先端のイメージング法を使用して追加情報を得ることができます。サンプル添加前のカクテルのみのイメージングは、ネガティブコントロールとして機能します。これらの画像は、塩の結晶や破片など、サンプル添加前のウェルの外観を特定できます。さらに、SHGおよびUV-TPEFイメージングは、タンパク質結晶と塩結晶を区別するのに役立ち、タンパク質-核酸複合体材料31の視覚化に使用することができる。
イメージング による モニタリングを繰り返し行うハイスループット結晶化実験では、非常に大量の画像が検査を必要とします。ユーザーの負担を軽減し、陽性の水晶ヒットを識別する確率を高めるために、自動水晶スコアリング方法が開発されました。HTXセンターは、明視野井戸画像を分類するために学術、非営利、政府、および業界パートナーのコンソーシアムによって開発されたトレーニング済みの深層畳み込みニューラルネットワークアーキテクチャである結晶化結果のMAchine認識(MARCO)スコアリングアルゴリズムの開発に参加しました32。このアルゴリズムは、異なる結晶化方法と異なるイメージャーを使用した複数の機関からの結晶化実験からの約50万の明視野画像でトレーニングされました。このアルゴリズムは、特定の画像が「結晶」、「透明」、「沈殿物」、および「その他」の4つの可能な画像クラスに分類されるかどうかを示す確率的スコアを出力します。MARCOの報告された分類精度は94.5%です。結晶検出は、アルゴリズムを実装し、アクセス可能で簡単な画像表示のためのグラフィカルユーザインターフェース(GUI)を提供するソフトウェアによってさらに強化され、AI対応のスコアリング能力32、33で可能になる。MARCO Polo GUIは、HTX Centerのイメージングおよびデータ管理システムのセットアップとシームレスに連携して、1,536ウェルスクリーンのヒットを特定し、ソートされたリストの出力を人間が関与して検査するように設計されています。さらに、GitHubで利用可能なオープンソースソフトウェアとして、GUIは他の研究室グループの特定のニーズを反映するために変更するためにすぐに利用できます。
ここでは、カクテルとタンパク質の両方を送達するためにロボットリキッドハンドリングを使用してハイスループットマイクロバッチアンダーオイル実験を設定するプロセスについて説明します。HTXセンターには、関心のあるユーザーにスクリーニングサービスと教育リソースを提供することを目的として、他の機関にはない独自の機器とリソースがあります。ロボット対応のハイスループット技術の方法と能力を実証することで、コミュニティは利用可能な技術に関する知識を持ち、独自の構造決定の取り組みについて決定を下すことができます。
プロトコル
1. 16個の96ウェル深井戸ブロック用のカクテルの準備または購入
- 96ウェルディープウェル(DW)ブロックに分注して、自社で生成されたケミカルカクテルを調製します。ロボット式リキッドハンドラーを使用して、塩、バッファー、ポリマー、および水のストック溶液を分注および混合します。
- 市販の96ウェルDWブロックスクリーンに、ロボットリキッドハンドラーまたはマルチチャンネルピペットを使用して、社内で改良されたケミカルカクテルを調製します。
- 市販のDWブロックを購入します。
- ラベルの付いた96ウェルDWブロックを-20°Cで12〜18か月間保管します。
注:ステップ1.1で準備されたカクテル。および 1.2.10/16 96ウェルDWブロックを充填し、5/16 96ウェルDWブロックは購入時に使用されます。添加剤スクリーンの沈殿を避けるために、スクリーン内の1つの96ウェルDWブロックが1,536ウェルプレート分注時に設置されます(セクション3を参照)。
2. カクテルを384ウェルプレートに分注
- 96ウェルDWブロックを4°Cで一晩解凍します。384ウェルプレートの調製を開始する前に、室温(20〜23°C)に戻します。
注意: カクテルプレートの準備には室温が適しています。これらのプレートを調製する際の主な関心事は、液体処理装置を詰まらせ、カクテル成分の濃度の予測不可能な変化につながる可能性のある沈殿物を回避することです。 - 必要に応じて反転によってブロックを完全に混合し、持続的な不透明な沈殿物を溶解します。ウェルに沈殿物が含まれている場合は、ブロックを30°Cに温めて溶解します。
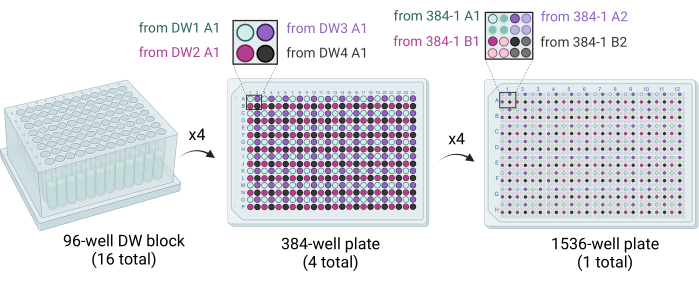
- 96シリンジまたはピペッターヘッドを備えたリキッドハンドリングロボットを使用して、4つの96ウェルDWブロックから1つの384ウェルプレートに50 μLのカクテル溶液を供給します。4つの96ウェルDWブロックは、象限が充填されるように384ウェルプレートに打ち抜かれます(例えば、96-DW1のA1から384プレート1のA1、96-DW2のA1から384プレート1のB1など)。(図3)。
- 16個の96ウェルDWブロックのうち15個を384ウェルプレートに送達して保管します。
- 384ウェルプレートを-20°Cで最大6か月間保管し、1,536ウェルプレートの調製に使用します。
3. オイルと結晶化カクテルを使用した1,536ウェルプレートの準備
- ゆっくりと吸引および送達できるロボットリキッドハンドリングシステムを使用して、1,536ウェルプレートの各ウェルに5 μLのパラフィンオイルを供給します。オイルプレートを4°Cで最大6か月間保管します。
- セクション2の384ウェルプレートを4°Cで一晩解凍します。プレートを反転させて溶液を混合し、沈殿物を溶解します。プレートを30°Cでインキュベートして、持続性沈殿物を溶解します。
- 添加剤スクリーンコンポーネントを調製するには、0.1 M HEPES pH 6.8、30% PEG3350を含む最終的な96ウェルDWブロックを使用し、リキッドハンドリングロボットまたはマルチチャンネルピペットを使用して市販の添加剤スクリーンと混合します。
- ステップ3.3で調製した緩衝PEG3350溶液と添加剤スクリーニングの1:1混合物を、適切な384ウェルプレートで最終容量50 μLまで分注することにより、添加剤スクリーニング溶液を調製します。
- 384シリンジまたはピペッターヘッドを備えたリキッドハンドリングロボットを使用して、1,536ウェルプレートの各ウェルに200 nLのカクテル溶液を供給します。象限が満たされるように、4つの384ウェルプレートを1,536ウェルプレートに打ち抜きます(例:384-プレート1のA1から1,536ウェルプレートのA1、384-プレート1のA2から1,536ウェルプレートのA3など)。(図3)。
- プレートを150 × g で5分間遠心分離してから、4°Cで最大4週間保存します。
4. サンプル提出
- サンプルを提出するには、次のスクリーニング実行の予約期限前に予約メールを送信してください。スクリーニング実験の数、名前、PI、機関、およびサンプルの特別な取り扱い要件を含めます。スクリーニングは月に1回程度実施され、年間12回実施されます。
- サンプルを発送する前に、サンプル送信フォームに記入してください。
- 新規ユーザーの場合は、セクション7の結晶化画像のダウンロードに使用する パスワード を選択します。
- 確立されたユーザーの場合は、既存のパスワードを使用するか、この手順で パスワード を変更します。
- サンプルを1.5 mLチューブに入れます。高分子が均質であり、結晶化を促進するために適切に濃縮されていることを確認してください。通常、硫酸アンモニウムまたはPEG 4,000で構成される結晶化前テストを使用して、テストされたサンプル濃度が透明な液滴または沈殿物34をもたらすかどうかを観察することにより、適切なサンプル濃度を調査します。
注:純度と均質性をチェックするためにサンプル提出前に実施できる適切な品質テストには、SDS-PAGE、ゲルろ過、動的光散乱(DLS)などがあります。結晶化は、わずかな不純物の存在によっても影響を受ける可能性があります。現在、1,536ウェルプレートを1枚セットアップするには、500 μLのサンプル容量が必要です。サンプル量要件を減らすためのテストが進行中です。- 50 mMを超えるバッファー濃度や、スクリーン内で結晶化する可能性のあるリン酸塩の使用は避けてください。
- 10%w / vを超えるグリセロール濃度を含む過度の溶解補助剤は避けてください。
- 密閉容器内のドライアイス、ウェットアイス、または冷却パックを使用して、サンプルを安全に適切な温度に維持するようにパッケージ化します。
- 実行中に月曜日から水曜日に一晩サンプルを優先して出荷します。
- サンプルが出荷されたら、追跡番号を電子メールで送信します。
5. 調製した1,536ウェルプレートでのサンプルセットアップ
- サンプルを開梱し、ユーザーが要求した温度ですぐにインキュベートします。
- 解凍したら、サンプルを10,000 × g で室温で2分間遠心分離します。セットアップ前に、サンプルを視覚的に観察して、サンプルの降水量、色、および状態を特定します。
- 1,536ウェルプレートを23°Cに温め、150 × g で5分間遠心分離します。ネガティブコントロールとして明視野イメージングを使用してカクテルのみのプレートを画像化します。
注:すべてのプレートは、サンプルのセットアップ前に明視野イメージングで画像化されるため、サンプルを追加する前に、ネガティブコントロールとしてすでに結晶や破片が含まれているウェルを識別できます。さらに、結晶化カクテルが送 達されていないウェル の同定を可能にする。プレートを室温まで温めることで、プレート表面の結露がなくなり、鮮明な画像が得られます。 - リキッドハンドリングロボットを使用して、1,536ウェルプレート内の各ウェルに200 nLのサンプルを分注します。プレートを150 × g で遠心分離し、プレートを4°C、14°C、または23°Cでインキュベートします。
注:マイクロバッチアンダーオイル実験は、目的のオイルの下にタンパク質とカクテルを分注することにより、手作業でセットアップできます。ただし、再現性のある結果を得るには、各タンパク質とカクテルを1 μL以上使用することをお勧めします。
6. 1,536ウェルプレートの結晶形成をモニター
- サンプルを1,536ウェルプレートに添加した後、1日目および1週目、2週目、3週目、4週目、および6週目の明視野イメージングによる画像。
- 23°Cでインキュベートされているプレートの場合は4週間の時点で、14°Cまたは4°Cでインキュベートされているプレートの場合は6週間の時点で、SHGおよびUV-TPEFを使用してSONICCイメージングを実行します。
注:SONICCイメージングのタイミングは、通常、これらの時点までに結晶が現れるため、ハイスループット1,536マイクロアッセイプレートの4週間および6週間の時点でスケジュールされます。油または蒸気拡散実験下で96ウェルマイクロバッチを修正する場合は、時間枠の早い段階でSONICCイメージングを実行することをお勧めします。 - 内部LIMSシステムを使用して、ユーザーアカウントに自動的に転送された実験画像にアクセスします。自動化されたhtslab電子メールデーモン を介して 、イメージングが発生したことをユーザーに通知します。
7. 画像解析
- 各.rarファイルの HWI ftp サイトからスクリーニング画像を取得します。
注:1,536画面から出力される画像は、明視野画像、SHG画像、およびUV-TPEF画像を含む多数のファイルになります。各イメージングモダリティまたは時点は、個別の.rarファイルです。各.rarファイルは、開梱されると、特定のイメージングモダリティを使用して特定の時点での1,536ウェルプレートの各ウェルからの画像を含む。- FileZilla クライアントまたはその他のオプションを使用して、ftp データにアクセスします。
注: FileZilla クライアントは、計算上のクラッシュを最小限に抑えるために、大きなファイル転送ボリュームを管理するために推奨される方法です。- FileZilla クライアントをユーザーのコンピューターにインストールする必要がある場合は、FileZilla ソフトウェアをダウンロードします。
- FileZillaクライアントがすでにインストールされているか、インストール時に、 FileZillaアイコン をクリックしてソフトウェアを開きます。
- ホストの ftp ウェブサイト、ユーザー名、およびパスワードを入力して、FileZilla からリモート ftp サーバーにログインします。
- .rarファイルを目的のディレクトリにダウンロードします。
- FileZilla クライアントまたはその他のオプションを使用して、ftp データにアクセスします。
- AI対応のオープンソースGUIを使用して、結晶化画像を表示、スコアリング、分析します。
注: GUI は、ほとんどの Windows、Mac、および Linux オペレーティング システム (OS) で使用でき、OS 固有のダウンロード手順は GitHub サイトにあります。MARCO Poloは、HTXセンターで実装されたハイスループット1,536結晶化スクリーンのメタデータを組み込んだオープンソースのGUIです。GitHubから誰でもダウンロードして、他の研究室グループの特定のニーズを反映するように変更できます。- ファイルをダウンロードした後、GUI で .rar ファイルを開きます( 補足図 S1 を参照)。
- [ インポート]をクリックし、ドロップダウンメニューから [画像 ]を選択して、[ Rarアーカイブ/ディレクトリから]を選択します。
- ポップアップウィンドウで[フォルダ の参照 ]をクリックし、画像を含むフォルダに移動します。
- 目的のファイルを選択し、[ 開く]をクリックしてGUIにインポートします。ファイルが [選択したパス ]ウィンドウに表示されるまで待ちます。GUI にダウンロードする 1 つ以上のファイルを選択し、[ インポート実行] をクリックします。
- GUIの スライドショービューア のウィンドウで最初のウェルの画像を表示するには、サンプル名の左側にある > 記号をクリックし、それをダブルクリックして適切な読み取り値を選択します(読み取り値は、画像明視野、UV-TPEF、またはSHGの日付とタイプ別に一覧表示されます)。
- ウィンドウ全体のサイズを変更して画像を拡大します。[ イメージの詳細 ] ボックスには、スコアリング情報を含むイメージに関する情報が含まれています (読み取りがスコアリングされるまで空です)。 [カクテルの詳細 ] ボックスには、カクテル コンポーネントに関するメタデータが含まれています。
- ナビゲーションパネルの[次へ]ボタンをクリックするか、キーボードの右矢印キーを押して、次のウェルに移動します。「井戸番号別」ウィンドウに井戸番号を入力して、特定の井戸に移動します。
- (GUI にインポートされた)すべての読み取りを表示するには、[ すべての日付を表示(Show All Date )] チェックボックスをオンにします。
- (GUI にインポートされたスペクトルの)すべてのスペクトルを表示するには、[ すべてのスペクトルを表示] チェックボックスをオンにします。[スペクトラムの入れ替え]ボタンをクリックして、各 スペクトラム 画像を個別に表示します。
- ファイルをダウンロードした後、GUI で .rar ファイルを開きます( 補足図 S1 を参照)。
- 最初にウィンドウの左側にあるリストから特定の実行を強調表示することにより、MARCOアルゴリズムを使用して結晶画像をスコアリングします。次に、[ 選択した実行の分類 ] ボタンをクリックします。1,536ウェルすべてについてイメージングリードがスコアリングされたら、 画像の詳細 ウィンドウでMARCOスコアリング情報を表示します。
メモ: 分類には、コンピュータの速度と使用可能なメモリに応じて、通常 2 分から 5 分かかります。アルゴリズムは、コンテンツを「クリスタル」、「クリア」、「沈殿物」、または「その他」のクラスに分類するスコアを生成します。各井戸の分類に関連付けられた数値は、そのクラスのオブジェクトを含む井戸の尤度を反映します。- スコアリングされた画像のサブセットを表示するには、[ 画像フィルタリング ]パネルで目的のボックスにチェックマークを付け、[ フィルターの送信 ]ボタンをクリックします。たとえば、MARCO によってクリスタルとして分類された画像のみを表示するには、[ クリスタル] ボックスと [MARCO ] ボックスにチェックマークを付け、[ フィルターの送信] をクリックします。
- クリスタル画像を手動でスコアリングして、「ヒューマンスコア」セットを生成します。適切なボタンをクリックして、井戸にスコアを割り当てます(「クリスタル」、「クリア」、「沈殿物」、または「その他」ボタンは、ウィンドウの下部にある 分類 パネルにあります)。または、キーボードのテンキーを使用してスコアを割り当てます(1 =「クリスタル」、2 =「クリア」、3 =「沈殿物」、4 =「その他」)。人間が採点した画像を「お気に入り」として指定するには、[ お気に入り] にチェックマークを付けますか?箱。
注:人間がクリスタルとして分類した画像のみを表示するには、[クリスタル]ボックスと[ヒューマン]ボックスにチェックマークを付け、[フィルターの送信]をクリックします。フィルタリングパネルのお気に入りボックスをクリックすると、返される画像がさらに絞り込まれ、お気に入りでもある人間がスコアを付けたクリスタル画像のみが返されます。 - [プレート ビューアー] タブを使用して、一度に複数のウェルを表示します。コントロールパネルの2番目のプレートビューアタブで、[プレートあたりの画像]セクションのドロップダウンメニューから16、64、または96の画像を選択します。[画像フィルタリング]タブを使用して、関心のない画像をグレーアウトします。[フィルターの適用] ボックスを選択して、画像をフィルター処理します。
注:たとえば、「人間」ボックスと「クリスタル」ボックスを選択すると、人間によってクリスタルとしてスコアリングされたウェルのみが簡単に表示されます。- [プレートビューア]タブに移動し、[次へ]ボタンをクリックして、次の16/64/96画像のセットを表示します。デフォルトでは、結晶としてスコア付けされた画像は赤、クリアとしてスコア付けされた画像は青、沈殿物としてスコア付けされた画像は緑、その他としてスコア付けされた画像はオレンジです。ドロップダウンメニューを使用して色を変更します。
- ウェルに表示する情報を選択するには、[ ラベル] タブのさまざまなボックスにチェックマークを付けます。
- [ ビューの保存 ] をクリックして、現在のビューの画像ファイルを保存します。
- スペクトラムの入れ替えをクリックして、マルチウェル画像の明視野、SHG、UV-TPEF画像を切り替えます。
- [エクスポート ]をクリックし、ドロップダウンメニューから適切なファイルタイプを選択して、他のプログラムで使用するためにスコアリングされたファイルをエクスポートします。
注: CSV (カンマ区切り値) ファイルは、Microsoft Excel や Google スプレッドシートなどのスプレッドシート プログラムと互換性があります。JSON (JavaScript オブジェクト表記法) ファイルは、ほとんどのテキスト エディターで開くことができます。PPTX(PowerPointプレゼンテーション)は、明視野、UV-TPEF、およびSHG画像の比較を含む、ポロからの画像を表示するために使用できます。ファイルは.xtal形式で保存され、マルコポーロGUIで再度開くことができます。- .xtal 形式のファイルを保存するには、ページの上部にある [ ファイル ] をクリックし、[実行 の保存 ] または [ 実行に名前を付けて保存] を選択します。ファイル名とディレクトリの場所を指定します。
- .xtal形式のファイルを開くには、[ インポート ]をクリックして[ 画像 ]、[ 保存した実行から]の順に選択します。適切なファイルの場所を参照し、ファイル名をクリックして、[ 開く] をクリックします。
結果
1,536ウェル結晶スクリーニング実験の結果は、0日目(陰性対照)、1日目、1週目、2週目、3週目、4週目、および6週目に収集された7つの完全な明視野画像セットで構成されています(図4)。SONICC画像は、23°Cでインキュベートされたプレートの場合は4週間の時点で、4°Cまたは14°Cでインキュベートされたプレートの場合は6週間の時点で収集されます。 全体として、サンプルが出荷されると、ユーザーは到着後1日以内にプレートをセットアップすることを期待できます。画像は収集時にアップロードされます。結晶化スクリーニング実験は6週間後に終了します。
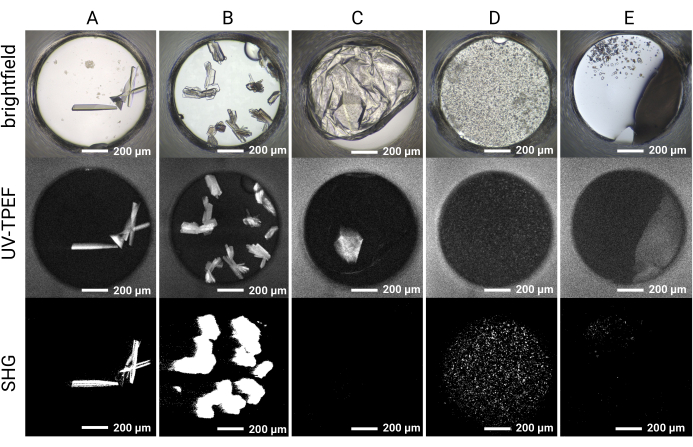
1,536ウェルプレートのセットアップにより、すべてのスクリーニング実験を同じプレート内で実施できるため、サンプル消費が制限され、イメージングとイメージングモダリティ間の直接比較が容易になります。シングルカクテル条件に対する結晶成長の経時変化についての代表的な結果を図4に示す。実験中の自動プレートイメージングにより、明視野イメージングによって急速に成長する結晶とゆっくりと成長する結晶の両方を同定できます。UV-TPEFおよびSHGイメージングは、明視野イメージングによって観察されたヒットの交差検証を可能にし、観察された結晶がそれぞれタンパク質性および結晶性であることを示します(図5A、B)。さらに、SONICCイメージングにより、沈殿物や膜によって視覚的に隠されている結晶(図5C)や、沈殿物と間違えられる可能性のある微結晶(図5D)を識別できます。いくつかの結晶については、図5Cの正方晶ソーマチン結晶によって例示されるように、いくつかの点群はSHGシグナル35、36を生成しないので、SHGシグナルの欠如は失格ではない。逆に、トリプトファン残基を欠くタンパク質に対するUV-TPEFシグナルの欠如が予想されます。UV-TPEFおよびSHGシグナルの観察は、明視野で現れ、強い正のSHGシグナルを示すがUV-TPEFシグナルを欠く非タンパク質塩結晶の同定も容易にします(図5E)。
プレートセットアップの画像分析は、HWIサーバーからのftpデータ転送もバンドルするマルコポーロGUIで合理化されています(FileZillaでファイルを転送する代わりに)。MARCO Polo GUIは、プレートと画像の表示を容易にナビゲートし、MARCOアルゴリズムを使用して計算画像スコアリングを実行するため、HTXセンターから画像結果を迅速にダウンロード、表示、分析できます。MARCO Polo GUIに実装されているMARCOスコアリングアルゴリズムは、1,536ウェルプレート全体から5分以内に画像をスコアリングすることができます。MARCOアルゴリズムによって結晶としてフラグが立てられた画像は、その後、Polo GUIでソートして表示できます。MARCOアルゴリズムは、クリスタルの識別と偽陰性の最小化のために最適化されているため、正のヒットを見逃さないように、スコアリングによって誤検知フラグが発生する可能性があります。それにもかかわらず、結晶を含む可能性が高いウェルに注意を向けることによって検査する必要のある画像のセットを制限するMARCOの能力は、ユーザーのデータ処理の負担を大幅に軽減します。ユーザーフレンドリーなMARCO Polo表示プラットフォームにアルゴリズムを便利に実装し、MARCOスコアに基づいて画像を並べ替える機能により、データセットをすばやく分析し、クリスタルヒットを正確に決定するユーザーの能力が大幅に向上します。

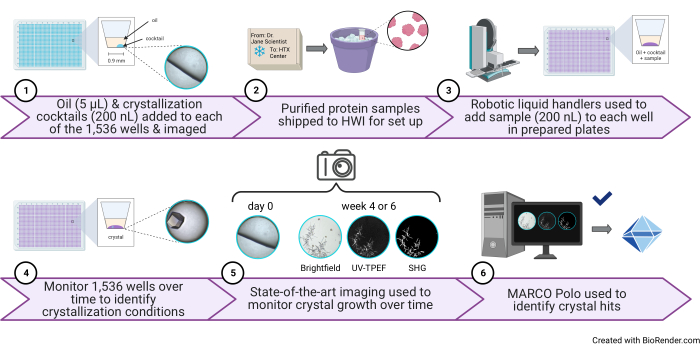
図1:HTXセンターで実施されたハイスループット1,536ウェル結晶化スクリーニング実験の概略図。 (1)このステップでは、5 μLのパラフィンオイルと200 nLのカクテルを各ウェルに添加します(プロトコルステップ3.1およびステップ3.5)。右に、油とカクテルだけが入っている井戸の漫画イラストと代表的な画像が示されています。(2)サンプルはHTXセンターに到着します(プロトコルステップ5.1)。3)このステップでは、200 nLのサンプルを各ウェルに追加します(プロトコルステップ5.4)。(4)1,536ウェルすべてを明視野イメージング、5)およびUV-TPEFおよびSHGモダリティを使用して経時的にモニターします(プロトコルステップ6)。6)AI対応のオープンソースGUIを使用して、結晶化画像を表示、スコアリング、および分析します(プロトコルステップ7)。略語:HTX =ハイスループット結晶化;UV-TPEF = UV-2光子励起蛍光;SHG = 第 2 高調波生成。AI =人工知能。GUI = グラフィカル ユーザー インターフェイス。この図の拡大版を表示するには、ここをクリックしてください。

図2:明視野、UV-TPEF、およびSHGイメージングを使用して画像化された、スクリーニング実験を含む単一の1,536ウェルプレート。 1,536ウェルプレートは、スケールのアメリカペニーで示されています(上)。各スクリーニング実験は、明視野イメージングでセットアップ前に1回、サンプル添加後に6回画像化されます(合計7つの明視野画像セット、左)。プレートは、4週間または6週間でUV-TPEF(中央)およびSHG(右)イメージングを受けます。略語:UV-TPEF = UV-二光子励起蛍光;SHG = 第 2 高調波生成。 この図の拡大版を表示するには、ここをクリックしてください。

図3:1,536ウェルプレートの生成方法を示す概略図。16個の96ウェルDWブロックを使用して4つの384ウェルプレートを打ち抜き、各384ウェルプレートの各象限に結晶化カクテルを分注します。4つの96ウェルDWブロックが1つの384ウェルプレート(中央)を満たします。4枚の384ウェルプレートを使用して、1枚の1,536ウェルプレートを打ち抜きます(右)。略語:DW =深い井戸。この図の拡大版を表示するには、ここをクリックしてください。

図4:1,536ウェルスクリーニング実験における単一ウェルの代表的な時間経過。 プレートは、サンプルセットアップ前(0日目)に画像化され、1日目、1週目、2週目、3週目、4週目、および6週目に明視野イメージングが行われます。23°Cでインキュベートしたプレートを4週目にSONICCで画像化します。スケールバー = 80 μm (明視野)、200 μm (SHG、UV-TPEF)。略語:SONICC =キラル結晶の2次非線形イメージング。UV-TPEF = UV-2光子励起蛍光;SHG = 第 2 高調波生成。 この図の拡大版を表示するには、ここをクリックしてください。

図5:HT 1,536結晶スクリーニング実験の代表的なイメージング結果。5つのサンプルウェルについて、明視野、UV-TPEF、およびSHGイメージングの結果を示します。(A,B)明視野、UV-TPEF、およびSHGイメージングによって観察されたタンパク質結晶は、3つのイメージングモダリティすべてで明確に明らかです。(C)明視野イメージングにおいて膜によって隠蔽されたタンパク質結晶がUV-TPEFイメージングによって可視である;結晶は、点群の非互換性のためにSHGイメージングによって観察されない。(D)UV-TPEFおよびSHGイメージングによって検証された微結晶の例で、そうでなければ沈殿物と見なされる可能性があります。(E)明視野およびSHGイメージングによって結晶に見えるが、UV-TPEFシグナルを示さない塩結晶の例。スケールバー = 200 μm。ウェル直径= 0.9 mm。略語:UV-TPEF = UV-二光子励起蛍光;SHG = 第 2 高調波生成。この図の拡大版を表示するには、ここをクリックしてください。
補足図S1:マルコポーロで画像ファイルを開く。画像ファイルは、マルコポーロGUI内でインポート|上部の[画像]タブ(a)。ファイルは、マルコポーロ(a)のFTPツールから直接転送することも、プロトコルステップ7.2で説明されているようにFileZillaを介して転送することもできます。ダウンロード済みのファイルをインポートするには、[画像 | RARアーカイブ/ディレクトリから。表示されるポップアップウィンドウで、[フォルダの参照(b)]を選択し、プレートイメージファイルが保存されているファイルディレクトリに移動します。ファイルが[選択したパス]ウィンドウ(c)に表示されたら、ファイルを強調表示し、[実行のインポート](d)をクリックします。MARCO Polo GUIは、画像とともにインポートする正しいカクテルファイルのメタデータを識別します。このファイルをダウンロードするには、ここをクリックしてください。
ディスカッション
この方法は、マイクロバッチアンダーオイルフォーマットでの1,536回の個別の結晶化実験にわずか500 μLのサンプルを必要とするタンパク質結晶化スクリーニング用のハイスループットパイプラインについて説明しています。このパイプラインは、実験のセットアップを迅速かつ再現性よく支援する液体処理ロボットと、MARCOアルゴリズムを使用して1,536ウェルプレート画像を分析して結晶ヒットを識別および分離するようにカスタマイズされた計算画像解析リソースMARCO Poloに依存しています。
個々のスクリーニングドロップの量が少ない(サンプル:カクテルの比率が1:1で合計400 nL)ということは、陽性の結晶化条件を特定するために必要なサンプル量が非常に少ないことを意味します。これらの小さな液滴サイズは、従来のループでは釣り上げられない小さな結晶を必然的に生成します。1,536枚のプレートから収穫する方法が開発されています37。さらに、結晶を有するプレートは、 in situ データ収集のためにシンクロトロン源で直接使用されています38。これらの結晶を採取するための堅牢な方法が開発されれば、放射光技術とマイクロ集束ビームの進歩により、有用なデータセットがさらに得られるようになります。さらに、得られた結晶は、最適化作業のシードとして使用できる可能性があります。
SONICCイメージングは、小さなタンパク質結晶と沈殿物の下に隠れたタンパク質結晶の両方を識別するのに明らかに有利です。これらの利点にもかかわらず、すべてのサンプルタイプがSHGおよびUV-TPEFイメージングに適しているわけではありません。例えば、芳香族トリプトファン残基がほとんどまたはまったくないタンパク質は、あいまいなUV-TPEFシグナルを示します。さらに、中心対称基または点群432を含む特定の空間群の結晶は、SHGイメージングによって検出されないであろう。蛍光色素を含むサンプルは、SHGシグナルに干渉してシグナルのキャンセルや強度の増加を引き起こすことがあり、金属含有タンパク質および蛍光部分を含むタンパク質ではSHGシグナルの慎重な解釈が必要です。しかしながら、多くの場合、SHGまたはUV-TPEFシグナルの欠如を合理化することは可能であり、これらのシグナルの欠如は必ずしもタンパク質結晶の存在を排除するべきではない。
マイクロバッチアンダーオイルフォーマットは、ハイスループット結晶学に使用されるより一般的な蒸気拡散法の代替手段を提供します。重要なことに、結晶化フォーマットはヒット同定39に影響を与え、ハイスループットスクリーニング作業に異なる結晶化フォーマットを使用する理論的根拠を提供します。自動イメージングとSONICC対応モダリティは、6週間の実験時間を通してタンパク質結晶の迅速な同定に役立ちます。最後に、MARCO Polo GUIを使用すると、ユーザーは1,536の条件から画像を迅速に分析して、最適化のために有望なヒットウェルを特定できます。ロボティクス対応のハイスループット実験セットアップを含むHTX Centerの機能は、分析用の最先端のイメージングおよび計算ツールと相まって、研究者が結晶ベースの構造作業の主要なボトルネックである結晶化条件の発見に効果的に対処することを可能にすることにより、構造生物学コミュニティに大きく貢献します。
開示事項
著者には、競合する金銭的利益またはその他の利益相反はありません。
謝辞
貴重なサンプルを結晶スクリーニングのためにお預かりしてくださったユーザーの皆様、また、構造生物学コミュニティにより良いサービスを提供するためのリソースの改良と開発に役立った重要なフィードバックやリクエストを提供してくださったことに感謝いたします。また、MARCO Polo GUIの開発を推進したイーサン・ホレマン、リサ・J・キーフ博士、エリカ・デュギッド博士にも感謝します。HWIの同僚、特にダイアナCFモンテイロ博士のサポートと提案に感謝します。我々は、国立衛生研究所(R24GM141256)からの資金援助を認識する。
資料
| Name | Company | Catalog Number | Comments |
| 1536 Well Imp@ct LBR LoBase | Greiner Bio-One | 790 801 | |
| Acetic acid | Hampton Research | HR2-853 | |
| AlumaSeal II Sealing Film | Hampton Research | HR8-069 | |
| Ammonium bromide | Molecular Dimensions | MD2-100-247 | |
| Ammonium chloride | Hampton Research | HR2-691 | |
| Ammonium hydroxide | Hampton Research | HR2-855 | |
| Ammonium nitrate | Hampton Research | HR2-665 | |
| Ammonium phosphate dibasic | Hampton Research | HR2-629 | |
| Ammonium phosphate monobasic | Hampton Research | HR2-555 | |
| Ammonium sulfate | Hampton Research | HR2-541 | |
| Ammonium thiocyanate | Molecular Dimensions | MD2-100-301 | |
| Bicine pH 9.0 | Hampton Research | HR2-723 | |
| Bis-tris propane pH 7.0 | Hampton Research | HR2-993-08 | |
| Calcium acetate | Hampton Research | HR2-567 | |
| Calcium chloride dihydrate | Hampton Research | HR2-557 | |
| CAPS pH 10.0 | Rigaku Reagents | none given | |
| ClearSeal Film | Hampton Research | HR4-521 | |
| Cobalt sulfate heptahydrate | Molecular Dimensions | MD2-100-42 | |
| Crystal Screen HT screen | Hampton Research | HR2-130 | |
| Formulator | Formulatrix | ||
| Glycerol | Hampton Research | HR2-623 | |
| Gryphon liquid handling robot | Art Robbins Instruments | ||
| HEPES pH 7.0 | Hampton Research | HR2-902-03 | |
| HEPES pH 7.5 | Hampton Research | HR2-902-08 | |
| HWI HTX Center sample submission form | https://hwi.buffalo.edu/high-throughput-crystallization-screening-center-sample-submission-form/ | ||
| Hydrochloric acid | Hampton Research | HR2-581 | |
| Index HT screen | Hampton Research | HR2-134 | |
| Ionic Liquid screen | Hampton Research | HR2-214 | |
| Lithium bromide | Molecular Dimensions | MD2-100-312 | |
| Lithium chloride | Hampton Research | HR2-631 | |
| Lithium sulfate monohydrate | Hampton Research | HR2-545 | |
| Magnesium acetate tetrahydrate | Hampton Research | HR2-561 | |
| Magnesium chloride hexahydrate | Hampton Research | HR2-559 | |
| Magnesium nitrate hexahydrate | Hampton Research | HR2-657 | |
| Magnesium sulfate heptahydrate | Hampton Research | HR2-821 | |
| Manganese chloride tetrahydrate | Millipore Sigma | 63535-50G | |
| Manganese sulfate monohydrate | Molecular Dimensions | MD2-100-310 | |
| MARCO Polo GUI download | https://hauptman-woodward.github.io/Marco_Polo/ | ||
| Matrix Platemate 2 x 3 liquid handling robot | Thermo Scientific | ||
| MES pH 6.0 | Hampton Research | HR2-943-09 | |
| Mosquito liquid handling robot | SPTLabtech | ||
| Paraffin Oil/White Mineral Oil Saybolt Viscosity 340-365 at 100 °F | Sigma Aldrich | PX0045-3 | |
| PEG 1000 | Hampton Research | HR2-523 | |
| PEG 2000 | Hampton Research | HR2-592 | |
| PEG 20000 | Hampton Research | HR2-609 | |
| PEG 3350 | Hampton Research | HR2-527 | |
| PEG 400 | Hampton Research | HR2-603 | |
| PEG 4000 | Hampton Research | HR2-529 | |
| PEG 6000 | Hampton Research | HR2-533 | |
| PEG 8000 | Hampton Research | HR2-535 | |
| PEG/Ion HT screen | Hampton Research | HR2-139 | |
| PEGRx HT screen | Hampton Research | HR2-086 | |
| Plate reservations | htslab@hwi.buffalo.edu | ||
| Potassium acetate | Hampton Research | HR2-671 | |
| Potassium bromide | Hampton Research | HR2-779 | |
| Potassium carbonate | Molecular Dimensions | MD2-100-311 | |
| Potassium chloride | Hampton Research | HR2-649 | |
| Potassium nitrate | Hampton Research | HR2-663 | |
| Potassium phosphate dibasic | Hampton Research | HR2-635 | |
| Potassium phosphate-monobasic | Hampton Research | HR2-553 | |
| Potassium phosphate-tribasic | Molecular Dimensions | MD2-100-309 | |
| Potassium thiocyanate | Hampton Research | HR2-695 | |
| Rock Imager 1000 with SONICC | Formulatrix | ||
| Rock Imager 54 | Formulatrix | ||
| Rubidium chloride | Millipore Sigma | R2252-10G | |
| SaltRx HT screen | Hampton Research | HR2-136 | |
| Silver Bullets screen | Hampton Research | HR2-096 | |
| Slice pH screen | Hampton Research | HR2-070 | |
| Sodium acetate pH 5.0 | Hampton Research | HR2-933-15 | |
| Sodium bromide | Hampton Research | HR2-699 | |
| Sodium chloride | Hampton Research | HR2-637 | |
| Sodium citrate pH 4.2 | Hampton Research | HR2-935-01 | |
| Sodium citrate pH 5.6 | Hampton Research | HR2-735 | |
| Sodium hydroxide | Hampton Research | HR2-583 | |
| Sodium molybdate dihydrate | Molecular Dimensions | MD2-100-207 | |
| Sodium nitrate | Hampton Research | HR2-661 | |
| Sodium phosphate monobasic | Hampton Research | HR2-551 | |
| Sodium thiosulfate pentahydrate | Molecular Dimensions | MD-100-307 | |
| StockOptions Polymer screen | Hampton Research | HR2-227 | |
| Tacsimate pH 7 | Hampton Research | HR2-755 | |
| TAPS pH 9.0 | bioWORLD | 40121071 | |
| Tris pH 8 | Hampton Research | HR2-900-11 | |
| Tris pH 8.5 | Hampton Research | HR2-725 | |
| ViaFLO 384 | Integra | ||
| ViaFLO 384 384 channel pipettor head (0.5-12.5µL) | Integra | ||
| ViaFLO 384 96 channel pipettor head (300µL) | Integra | ||
| Zinc acetate dihydrate | Hampton Research | HR2-563 |
参考文献
- PDB data distribution by experimental method and molecular type. RCSB Protein Data Bank Available from: https://www.rcsb.org/stats/summary (2022)
- Maveyraud, L., Mourey, L. Protein X-ray crystallography and drug discovery. Molecules. 25 (5), 1030 (2020).
- Dupeux, F., Röwer, M., Seroul, G., Blot, D., Márquez, J. A. A thermal stability assay can help to estimate the crystallization likelihood of biological samples. Acta Crystallographica Section D: Biological Crystallography. 67 (11), 915-919 (2011).
- Elbasir, A., et al. DeepCrystal: A deep learning framework for sequence-based protein crystallization prediction. Bioinformatics. 35 (13), 2216-2225 (2019).
- Zucker, F. H., et al. Prediction of protein crystallization outcome using a hybrid method. Journal of Structural Biology. 171 (1), 64-73 (2010).
- George, A., Wilson, W. W. Predicting protein crystallization from a dilute solution property. Acta Crystallographica Section D: Biological Crystallography. 50 (4), 361-365 (1994).
- Jia, Y., Liu, X. -. Y. From surface self-assembly to crystallization: prediction of protein crystallization conditions. The Journal of Physical Chemistry B. 110 (13), 6949-6955 (2006).
- Slabinski, L., et al. XtalPred: A web server for prediction of protein crystallizability. Bioinformatics. 23 (24), 3403-3405 (2007).
- Abrahams, G. J., Newman, J. BLASTing away preconceptions in crystallization trials. Acta Crystallographica Section F: Structural Biology Communications. 75 (3), 184-192 (2019).
- Rosa, N., et al. Tools to ease the choice and design of protein crystallisation experiments. Crystals. 10 (2), 95 (2020).
- Newman, J., et al. On the need for an international effort to capture, share and use crystallization screening data. Acta Crystallographica Section F: Structural Biology and Crystallization Communications. 68 (3), 253-258 (2012).
- Lynch, M. L., Dudek, M. F., Bowman, S. E. A searchable database of crystallization cocktails in the PDB: analyzing the chemical condition space. Patterns. 1 (4), 100024 (2020).
- Jancarik, J., Kim, S. -. H. Sparse matrix sampling: a screening method for crystallization of proteins. Journal of Applied Crystallography. 24 (4), 409-411 (1991).
- Carter, C. W. Efficient factorial designs and the analysis of macromolecular crystal growth conditions. Methods. 1 (1), 12-24 (1990).
- McPherson, A., Cudney, B. Searching for silver bullets: An alternative strategy for crystallizing macromolecules. Journal of Structural Biology. 156 (3), 387-406 (2006).
- McPherson, A., Nguyen, C., Cudney, R., Larson, S. The role of small molecule additives and chemical modification in protein crystallization. Crystal Growth & Design. 11 (5), 1469-1474 (2011).
- Luft, J. R., DeTitta, G. T. A method to produce microseed stock for use in the crystallization of biological macromolecules. Acta Crystallographica Section D: Biological Crystallography. 55 (5), 988-993 (1999).
- Thakur, A. S., et al. Improved success of sparse matrix protein crystallization screening with heterogeneous nucleating agents. PLoS One. 2 (10), 1091 (2007).
- Chayen, N. E., Stewart, P. D. S., Blow, D. M. Microbatch crystallization under oil-a new technique allowing many small-volume crystallization trials. Journal of Crystal Growth. 122 (1-4), 176-180 (1992).
- Luft, J. R., et al. A deliberate approach to screening for initial crystallization conditions of biological macromolecules. Journal of Structural Biology. 142 (1), 170-179 (2003).
- Luft, J. R., Snell, E. H., DeTitta, G. T. Lessons from high-throughput protein crystallization screening: 10 years of practical experience. Expert Opinion on Drug Discovery. 6 (5), 465-480 (2011).
- Lynch, M. L., Snell, M. E., Potter, S. A., Snell, E. H., Bowman, S. E. 20 years of crystal hits: Progress and promise in ultrahigh-throughput crystallization screening. Acta Crystallographica Section D: Biological Crystallography. , (2023).
- Segelke, B. W. Efficiency analysis of sampling protocols used in protein crystallization screening. Journal of Crystal Growth. 232 (1-4), 553-562 (2001).
- Luft, J. R., Newman, J., Snell, E. H. Crystallization screening: the influence of history on current practice. Acta Crystallographica Section F. 70 (7), 835-853 (2014).
- Mlynek, G., Kostan, J., Leeb, S., Djinovic-Carugo, K. Tailored suits fit better: Customized protein crystallization screens. Crystal Growth & Design. 20 (2), 984-994 (2019).
- Mueller-Dieckmann, J. The open-access high-throughput crystallization facility at EMBL Hamburg. Acta Crystallographica Section D: Biological Crystallography. 62 (12), 1446-1452 (2006).
- Weber, P., et al. High-throughput crystallization pipeline at the crystallography core facility of the Institut Pasteur. Molecules. 24 (24), 4451 (2019).
- Lin, Y. What's happened over the last five years with high-throughput protein crystallization screening. Expert Opinion on Drug Discovery. 13 (8), 691-695 (2018).
- Haupert, L. M., Simpson, G. J. Screening of protein crystallization trials by second order nonlinear optical imaging of chiral crystals (SONICC). Methods. 55 (4), 379-386 (2011).
- Madden, J. T., DeWalt, E. L., Simpson, G. J. Two-photon excited UV fluorescence for protein crystal detection. Acta Crystallographica Section D: Biological Crystallography. 67 (10), 839-846 (2011).
- Fleming, A. M., et al. Second harmonic generation interrogation of the endonuclease APE1 binding interaction with G-quadruplex DNA. Analytical Chemistry. 94 (43), 15027-15032 (2022).
- Bruno, A. E., et al. Classification of crystallization outcomes using deep convolutional neural networks. PLoS One. 13 (6), 0198883 (2018).
- Holleman, E. T., Duguid, E., Keefe, L. J., Bowman, S. E. Polo: An open-source graphical user interface for crystallization screening. Journal of Applied Crystallography. 54 (2), 673-679 (2021).
- Niesen, F. H., et al. An approach to quality management in structural biology: Biophysical selection of proteins for successful crystallization. Journal of Structural Biology. 162 (3), 451-459 (2008).
- Padayatti, P., Palczewska, G., Sun, W., Palczewski, K., Salom, D. Imaging of protein crystals with two-photon microscopy. Biochemistry. 51 (8), 1625-1637 (2012).
- Haupert, L. M., DeWalt, E. L., Simpson, G. J. Modeling the SHG activities of diverse protein crystals. Acta Crystallographica Section D: Biological Crystallography. 68 (11), 1513-1521 (2012).
- Luft, J. R., Grant, T. D., Wolfley, J. R., Snell, E. H. A new view on crystal harvesting. Journal of Applied Crystallography. 47 (3), 1158-1161 (2014).
- Bruno, A. E., Soares, A. S., Owen, R. L., Snell, E. H. The use of haptic interfaces and web services in crystallography: An application for a 'screen to beam' interface. Journal of Applied Crystallography. 49 (6), 2082-2090 (2016).
- Baldock, P., Mills, V., Stewart, P. S. A comparison of microbatch and vapour diffusion for initial screening of crystallization conditions. Journal of Crystal Growth. 168 (1-4), 170-174 (1996).
転載および許可
このJoVE論文のテキスト又は図を再利用するための許可を申請します
許可を申請さらに記事を探す
This article has been published
Video Coming Soon
Copyright © 2023 MyJoVE Corporation. All rights reserved