アクチノバクテリオファージ感染の特性評価に適応した光学密度ベースのマイクロプレートアッセイ(英語)
要約
放線菌および他の成長の遅い細菌に適した、バクテリオファージの存在下での長期的な細菌増殖を定量化するための光学密度ベースのマイクロプレート法が記載されている。この方法には、蒸発と蓋の結露を減らすための変更と、曲線下面積、最大成長、相対病原性などのウイルス感染メトリックを計算するためのRコードが含まれています。
要約
バクテリオファージは自然環境の重要な部分であり、細菌集団を形成する強力な能力を持っています。個々のファージが放線菌などの成長の遅い細菌宿主とどのように相互作用するかを理解するには、ファージの存在下での長期的な細菌増殖を定量化するための簡単で信頼性の高い方法が必要です。分光光度マイクロプレートリーダーは、ハイスループットの繰り返し測定を可能にしますが、少量を長時間インキュベートすると技術的な課題が生じる可能性があります。この手順では、標準的な96ウェルマイクロプレートを採用して、96時間のサブサンプリングなしでファージと細菌の共培養を可能にし、分光光度吸光度値を使用して8時間ごとに細菌の増殖を記録します。これらの光学濃度値は、Rを使用して分析され、成長阻害率、相対病原性、ステイシー-セバージョス指数などの感染指標が得られます。ここで概説する方法は、長時間のマイクロプレート成長曲線実験を実施および分析するための効果的な方法を提供し、蒸発と蓋の結露を減らすための変更が含まれています。これらのプロトコルは、成長の遅い細菌宿主とそのバクテリオファージとの間の相互作用のマイクロプレートベースのアッセイを容易にします。
概要
バクテリオファージまたはファージは、細菌に感染するウイルスです。それらは地球上で最も多数の生物学的実体であり1であり、バクテリオファージが細菌の進化と生態系プロセスに影響を与えることは一般に認められています2,3,4。バクテリオファージ宿主範囲8および感染動態5,6を記述、測定、および分析するには、二重層寒天法7および光学密度ベースのマイクロプレート法8,9,10,11,12などの寒天ベースの方法を含むいくつかの方法が存在します.各方法には、独自の長所と短所があります。その効率性から、二層寒天法を用いためっき試験は宿主範囲アッセイの「ゴールドスタンダード」ですが、この方法は時間と労力を要します9。24時間以内に結果を返す迅速なマイクロプレート法は、大腸菌9,10,11,12などの成長の速い細菌宿主に優れた結果をもたらしますが、放線菌7,13,14,15などの成長の遅い細菌宿主でのバクテリオファージ感染の進行を示すには短すぎます。
成長の速い細菌用に設計された光学密度ベースのマイクロプレートアッセイは、蒸発が起こり、人工的に高い細菌密度を与えることなく、成長の遅い宿主細菌の感染動態を特徴付けるために必要な数日間実行することはできません。したがって、成長の遅い細菌種のバクテリオファージ感染動態に関する比較可能なハイスループットデータを取得するには、これらの細菌に適合した特殊な技術が必要です。
ここで紹介するマイクロプレート法は蒸発を減少させるため、増殖の遅い細菌をファージと96時間延長共培養することができ、ファージ感染動態と宿主範囲の調査が可能になります。この方法は、異なる宿主ウイルスシステム間の病原性比較を可能にする光学密度ベースのメトリックであるStacy-Ceballosインデックス16も示しています。
プロトコル
このプロトコルはGordonia terrae用に書かれていますが、Gordonia lacunae、Gordonia rubripertincta、および Gordonia westfalicaにも使用されています。
1.細菌の準備
- バイオセーフティキャビネットでは、優れた微生物学的慣行17 を使用して、 Gordonia terrae CAG3の単一コロニーを、0.01 mg / mLのシクロヘキシミドを含む200 mLのペプトン酵母カルシウムブロス18(PYCa)を含む1 Lの滅菌バッフルフラスコに接種します( 材料の表を参照)。
- フラスコを30°Cでインキュベートし、培養液が飽和するまで250rpmで振とうするか、または7日間インキュベートします。
- 飽和G. terrae培養物をPYCaブロスで段階的に希釈し、PYCaプレート19,20上で10−4、10−5、および10−6希釈液のそれぞれ100μLをプレートに広げます。原液飽和培養液を4°Cで冷蔵する。
- スプレッドプレートを倒立させて30°Cで3日間インキュベートします。
- インキュベーション後、20〜200個のコロニーを有するプレートである「計数可能なプレート」を同定する。そのプレート上のコロニーの数を数え、ミリリットルあたりのコロニー形成単位(cfu / mL)19,20を計算します。
- 飽和培養物をPYCaブロスで4.0 x 10⁶ cfu / mL細菌に希釈します。
2.ファージの調製
注:報告された代表的な結果は、G. terraeで単離された温帯バクテリオファージであるゴルドニアファージDelRio21で得られたものです。これらの方法は、他のゴルドニアファージでも成功裏に使用されています。
- 単離されたバクテリオファージから始めて、ファージバッファー7 でファージサンプルを1 x 10⁻⁸ 希釈まで段階的に希釈します。2層寒天ファージ力価アッセイ7 を、0.3 mLの飽和 G.テラエ 培養物を10 μLの各ファージ希釈液で感染させて実施する。5〜10分間の室温インキュベーションの後、細菌とファージの混合物を3 mLのPYCaトップ寒天培地と混合し、PYCa寒天プレートに注ぎます。
- プレートを倒立させて30°Cで3日間、またはプラークが7になるまでインキュベートします。
- インキュベーション後、20〜200個のプラークを有するプレートである「カウント可能なプレート」を特定する。そのプレート上のプラークの数を数え、ミリリットルあたりのプラーク形成単位(pfu / mL)7を計算します。
3. マイクロプレート作製
注:この方法には、平底の96ウェルマイクロプレート( 材料表を参照)を使用する必要があります。すべてのプレートの準備とローディングはバイオセーフティキャビネットで完了する必要があり、優れた微生物学的慣行17を使用する必要があります。
- 100 μLのTriton-X 100、40 mLの100%イソプロパノール、および160 mLの脱イオン水を組み合わせて、防曇蓋コーティング溶液を調製します22。攪拌して混合し、室温で保存します。
- バイオセーフティキャビネットで、滅菌済みの96ウェルマイクロプレート蓋の内面に6 mLの蓋コーティング溶液を加え、蓋の端を持って回転させ、溶液で覆われていることを確認します。溶液を蓋の上に20秒間置いてから、溶液を注ぎ、蓋が完全に乾くまで、オートクレーブ処理したペーパータオルの蓋を斜めにひっくり返します(通常は35〜45分かかります)。蓋の端を持ってください。
- 各96穴マイクロプレートに対して水中の0.1%アガロース20 mLを準備し、電子レンジでアガロースを融解します。
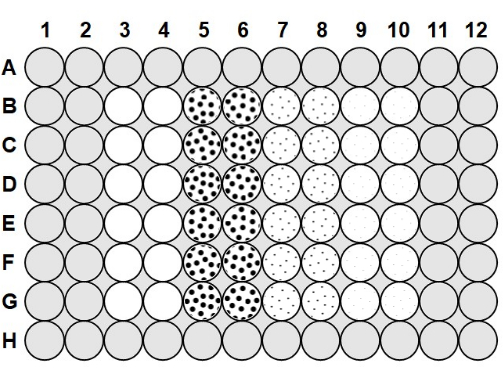
- アガロースが50〜60°Cに冷却されたら、プレートのウェル間のすべてのスペースに0.1%アガロース100 μLをピペットで入れ、列Aと列Hと列1、列2、列11、および列12のウェルに200 μLをピペットで入れます(図1)。
4.プレートにバクテリアとファージを入れる
注:すべてのプレートの準備とローディングはバイオセーフティキャビネットで完了する必要があり、優れた微生物学的慣行17 を使用する必要があります。
- 96ウェルプレートには、各ウェル9に75 μLの2.0 x 10⁶ cfu / mL細菌が含まれます。4.0 x 10 6 cfu / mL細菌培養物を2x PYCaブロスで1:1に希釈し、2.0 x 10⁶ cfu / mLにします。96ウェルプレートあたり5 mLを調製します。
- ファージバッファー7 を使用してファージライセートを希釈し、2.0 x 10⁶ pfu/mL、2.0 x 105 pfu/mL、および2.0 x 104 pfu/mLの濃度をそれぞれ1 mLにします。これにより、マイクロプレート9内で1、0.1、および0.01の感染多重度(MOI)が可能になります。
- マイクロプレートをロードするには、防曇液とアガロースで調製したプレートを取り、2.0 x 10⁶ cfu/mL細菌75 μLをカラム3-10にピペットで移します( 下記図1)。
- カラム3およびカラム4に、図 1以下のノーファージポジティブコントロールとして機能する75 μLの滅菌ファージバッファーを各ウェルに加え、各添加後に上下にピペットで混合します。75 μL の 2.0 x 10 6 pfu/mL ファージをカラム 5 およびカラム6 に、75 μL の 2.0 x 10⁵ pfu/mL ファージをカラム 7 およびカラム 8 に、75 μL の 2.0 x 10⁴ pfu/mL ファージをカラム 9 およびカラム 10 に添加し、各添加後に上下にピペッティングして混合します。
- プレートの両側を0.5のラベリングテープでテープで固定し、ガス交換を可能にしながらプレートを部分的にシールします。
5.インキュベーションと吸光度測定
- プレートにバクテリアとファージが入ったら、マイクロプレートシェーカーに250 rpmで置き、30°Cでインキュベートします。
- プレートを96時間インキュベートし、16時間目から8時間ごとにマイクロプレートリーダーで600 nmで光学密度を測定します。測定の合間にプレートをシェーカーに戻します。
注:0時間目から4、h 6時間、8時間、および12時間の測定期間が評価され、感染後16時間から始まる8時間のサンプリング期間が ゴルドニアとファージの相互作用を最もよく捉えていると判断されました。. - 実験中は蓋の結露を監視します。結露が見られる場合は、手順3.2に従ってコーティングされた別の蓋と蓋を交換します。
- プロトコルセクション6に従って、コントロールおよび感染した成長曲線を生成します。
6.データ分析
- スプレッドシートプログラムを使用して、Stacy-Ceballos-Index GitHubリポジトリ(https://github.com/eichristenson/Stacy-Ceballos-Index)のスプレッドシートレイアウトに従って、各ファージ希釈の平均および標準偏差を計算します。
- コントロールと感染の成長曲線を作成し、DescTools 24、dplyr 25、ggplot226、および readxl27 パッケージを使用して R (材料表を参照) を使用し、Stacy-Ceballos-Index GitHub リポジトリ (https://github.com/eichristenson/Stacy-Ceballos-Index) の R スクリプトに従って感染メトリックを計算します。
- AUCcon は非感染管理曲線下の領域であり、AUCinf は感染曲線16の下の領域です。AUC を計算し、次の式を使用して、曲線下面積の値 PIAUC16 に基づいて成長阻害率を計算します。
(1 - [AUCinf/AUCcon]) × 100 - 各曲線の破線の水平線はピーク成長を示し、感染していない成長ピークはN漸近線(con )とラベル付けされ、感染した成長ピークはN漸近線(inf )とラベル付けされています。N漸近 値を特定し、次の式を使用して、これらのピーク成長値(PImax16)に基づいて成長阻害率を計算します。
(1 - [N 漸近線(inf)/ N漸近線(con)]) × 100 - ステイシー・セバージョス指数ISC16を、PIAUC とPIの最大値 から次のように計算します。
(PIAUC × PI最大)≦0.5
時間の経過に伴うステイシー-セバージョス指数を積分することにより、相対病原性を計算します16。
- AUCcon は非感染管理曲線下の領域であり、AUCinf は感染曲線16の下の領域です。AUC を計算し、次の式を使用して、曲線下面積の値 PIAUC16 に基づいて成長阻害率を計算します。
代表的な結果
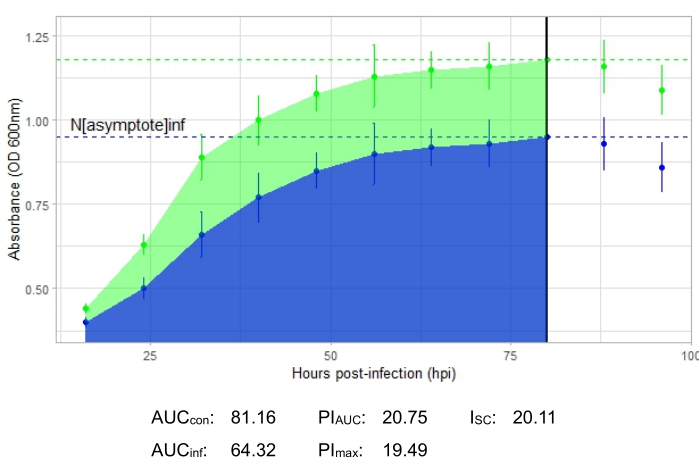
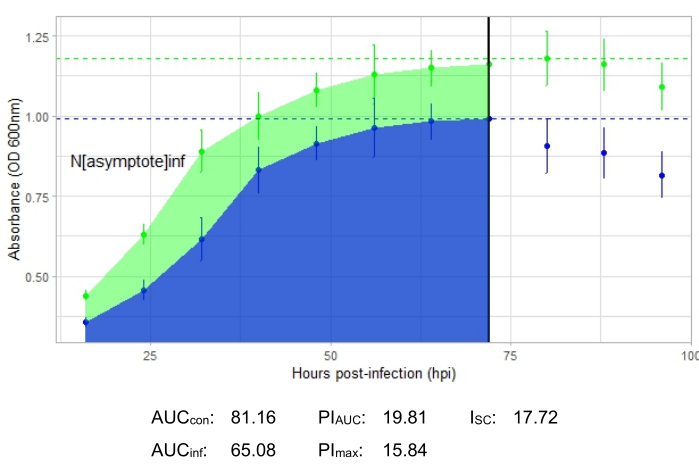
結果として得られる成長曲線が、吸光度の急激な変動なしに、時間の経過とともにポジティブコントロール細菌集団の増加を示している場合、実験は成功します。生産的なファージ感染の有無にかかわらず、MOI1で成功した実験の例をそれぞれ図 2 と 図3に示します。MOIが0.01の場合の生産感染は 、図4に示されています。3つの図すべてに見られるポジティブコントロールの成長パターン(緑色の曲線)は、細菌が増殖しており、増殖中に凝集しておらず、汚染物質が存在しないことを示しています。凝集と汚染は、単一の時点で異常に高い吸光度によって示されます。標準偏差は通常、実験の時間経過とともに増加します。ただし、対照曲線と感染曲線の間で重複する急激な増加または標準偏差は、1つまたは複数のウェルでの汚染または凝集を示している可能性があります。
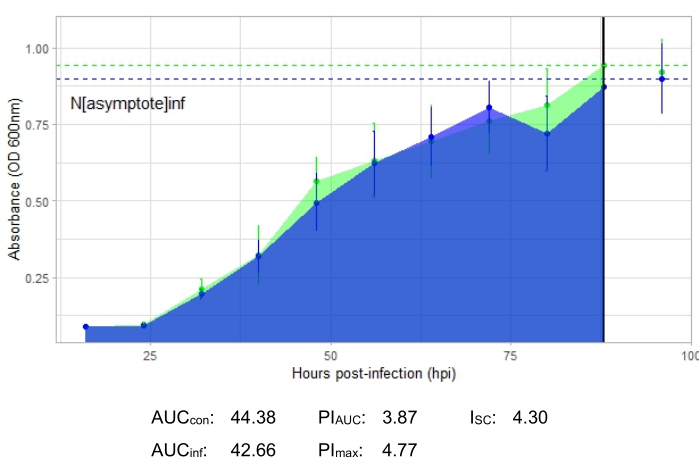
図2で表される生産的なファージ感染を示す成長曲線は、ファージを添加したウェルにおける経時的な細菌吸光度の減少を示す。この細菌密度の低下は、図3に示すように、細菌がファージの宿主範囲外にある場合は見られません。
感染指標は、すべての代表的な実験について示されており、図2と図4では生産的な感染では比較的大きなI SCが、宿主細菌に効率的に感染しなかったファージでは図3で非常に小さいISCとなっています。

図1:マイクロプレートのレイアウト。 灰色の領域は0.1%アガロースで満たされています。カラム3およびカラム4のブランクウェルは、ファージバッファーと2.0 x 10⁶ cfu/mL細菌のみを含むファージポジティブコントロールウェルです。点線のウェルには、ファージと2.0 x 106 cfu / mL細菌が含まれています。カラム5とカラム6の大きな点は、2.0 x 10⁶ pfu/mLファージのMOIが1であることを示しています。カラム7とカラム8の中程度の点は、2.0 x 105 pfu/mLファージでMOIが0.1であることを示しています。カラム9とカラム10の小さな点は、2.0 x 104 pfu/mLファージでMOIが0.01であることを示しています。 この図の拡大版を表示するには、ここをクリックしてください。

図2:宿主細菌に生産的に感染するMOI1のファージを用いた成功した成長曲線実験。 平均吸光度値(±標準偏差)は、感染していない細菌(緑)およびファージを添加した細菌(青)について示されています。略語:AUC =曲線の下の面積。PIAUC =曲線下の面積から計算された成長阻害率。N漸近線 =ピーク成長値;PImax =ピーク成長値から計算された成長阻害率。ISC = ステイシー・セバージョス指数。このグラフは、温帯 ゴルドニア ファージDelRioがG . terraeに感染し、それが単離された細菌を表している。 この図の拡大版を表示するには、ここをクリックしてください。

図3:宿主細菌に効率的に感染しないMOI1のファージを用いた成長曲線実験の成功。 平均吸光度値(±標準偏差)は、感染していない細菌(緑)およびファージを添加した細菌(青)について示されています。略語:AUC =曲線の下の面積。PIAUC =曲線下の面積から計算された成長阻害率。N漸近線 =ピーク成長値;PImax =ピーク成長値から計算された成長阻害率。ISC = ステイシー・セバージョス指数。このグラフは、デルリオによる G.ルブリペルティンクタ感染 を表す。 この図の拡大版を表示するには、ここをクリックしてください。

図4:MOIが0.01のファージを用いた成長曲線実験の成功。 平均吸光度値(±標準偏差)は、感染していない細菌(緑)およびファージを添加した細菌(青)について示されています。略語:AUC =曲線の下の面積。PIAUC =曲線下の面積から計算された成長阻害率。N漸近線 =ピーク成長値;PImax =ピーク成長値から計算された成長阻害率。ISC = ステイシー・セバージョス指数。このグラフは、デルリオによる G.テラエ 感染を表しています。 この図の拡大版を表示するには、ここをクリックしてください。
ディスカッション
この光学密度ベースのマイクロプレート法は、バクテリオファージ宿主の範囲と感染動態の調査を可能にし11、バクテリオファージの病原性の尺度としてのステイシー-セバロス指数16の有用性を示しています。この方法は任意のバクテリオファージ宿主系で利用することができるが、放線菌などの増殖の遅い細菌で使用するために迅速なマイクロプレート増殖アッセイ9,10,11を適応させるために特別に設計された。ラピッドマイクロプレートアッセイは、蒸発や蓋の凝縮に対処するための変更なしに、成長の遅い細菌には使用できません。この方法は、これらの必要な改変を記述し、バクテリオファージ感染を記述するためのStacy−Ceballos指数および関連する測定基準16の使用を初めて実証する。
蒸発は、数日間の96ウェルプレート成長曲線アッセイにおいて大きな課題となる可能性があります。この方法は、境界ウェルとウェル間のスペースにアガロースを添加することで、この問題を解決します。アガロースマージンは、防曇蓋処理22と組み合わせることで、マイクロプレート内に必要な湿度を提供し、信頼性の高い光学濃度測定を可能にします。湿度が加わらなければ、必要な長いインキュベーション期間中に実質的なエッジ効果の蒸発が起こり23 、人為的に高い光学濃度の読み取りにつながります。防曇蓋処理は、蓋の結露によって光学濃度値が人為的に上昇する可能性があるため、必要な変更です。放線菌は成長中に凝集し、人為的に高い光学濃度値を与え、感染の多様性を効果的に減少させる可能性があるため、潜伏期間中にプレートを振ることは推奨される変更です。
感染動態を特徴付ける実験における細菌とファージの比率は、感染効果を示すのに十分なファージがなければならないが、宿主細菌集団がすぐにクラッシュするほど多くはなく、9または溶解の頻度が劇的に増加する28ため、重要である。この方法では、一貫した結果を得るために最も効果的であることがわかった比率はMOI1でしたが、MOIが0.1と0.01でも使用可能な結果が得られました。この方法を実施する場合、細菌の1つの濃度を選択し、0.01-1 9,10,11のMOI範囲で複数のファージ濃度をテストすることが推奨される。
ここで説明するこの技術は、各測定間隔29でより大きな培養フラスコからのサブサンプリングではなく、ハイスループットマイクロプレートアッセイにおいて、成長の遅い細菌についてバクテリオファージ−宿主相互作用を評価することを可能にする。さらに、マイクロプレート増殖アッセイ9、10、11がどのように適応され得るかを実証することにより、この技術は、ファージ特徴付け5、6、12および進化研究30、31を含む、増殖の遅い細菌に対する他のマイクロプレートベースのバクテリオファージアッセイの有用性を高める。最後に、この方法は、バクテリオファージ感染を記述するためのステイシー-セバロス指数16の使用を実証する。このメトリックは、当初、古細菌モデルシステムからのデータを使用して開発され、光学密度値から計算されるため、異なるウイルスシステム間で広く有用です。
開示事項
著者は開示するものは何もありません。
謝辞
この研究は、NSF DBI生物学統合研究所(BII)の助成金(賞番号2119968;PI-Ceballos)およびアーカンソーINBREプログラムによる、国立総合医学研究所(NIGMS)からの助成金を受けて、国立衛生研究所からのP20 GM103429。著者はまた、ウォシタバプテスト大学のパターソンサマー学部研究プログラムの支援にも感謝しています。
資料
| Name | Company | Catalog Number | Comments |
| Agarose | Omni-Pur | 2090 | for filling border wells of microplate |
| Costar 96 Well Lid Low Evaporation Corner Notch | Corning | 3931 | replacement microplate lid |
| Isopropanol | Fisher Chemical | A461-4 | for lid coating |
| Microplate reader | Tecan Spark 20M | ||
| Microplate Shaker with 4-Place Platform | Thermo Fisher Scientific | 88-861-023 | to shake plates during incubation |
| Non-Tissue Culture-Treated Plate 96 well | Falcon (a Corning Brand) | 351172 | microplate for growth curve assay |
| Peptone yeast calcium (PYCa) agar | Homemade | 1 g peptone 15 g yeast extract 15 g agar 990 mL dd H2O 4.5 mL 1 M CaCl2 2.5 mL 40% dextrose 1 mL 10 mg/mL cycloheximide | |
| Peptone yeast calcium (PYCa) broth | Homemade, from Reference 16 | 1 g peptone 15 g yeast extract 990 mL dd H2O 4.5 ml 1 M CaCl2 2.5 mL 40% dextrose 1 mL 10 mg/mL cycloheximide | |
| Peptone yeast calcium (PYCa) top agar | Homemade | 1 g peptone 15 g yeast extract 4 g agar 990 mL dd H2O 4.5 mL 1M CaCl2 2.5 mL 40% dextrose | |
| Petri plates | Thermo Fisher Scientific | FB0875713 | for determination of bacterial concentration and phage titer assay |
| Phage Buffer | Homemade, from Reference 7 | 10 mL 1 M Tris, pH 7.5 10 mL 1 M MgSO4 4 g NaCl 980 ml dd H2O | |
| R software | https://www.r-project.org/ | version 4.3.0 | |
| Sterile Disposable PETG Flask Baffled Bottom w/Vented Closure | Thermo Fisher Scientific | 4116-1000 | for bacterial culture |
| Triton X-100 | Sigma Aldrich | 9036-19-5 | for lid coating |
参考文献
- Mushegian, A. R. Are there 1031 virus particles on Earth, or more, or fewer. Journal of Bacteriology. 202 (9), e00052-e00020 (2020).
- Chevallereau, A., Pons, B. J., van Houte, S., Westra, E. R. Interactions between bacterial and phage communities in natural environments. Nature Reviews Microbiology. 20 (1), 49-62 (2022).
- Olszak, T., Latka, A., Roszniowski, B., Valvano, M. A., Drulis-Kawa, Z. Phage life cycles behind bacterial biodiversity. Current Medicinal Chemistry. 24 (36), 3987-4001 (2017).
- Weitz, J. S., et al. Phage-bacteria infection networks. Trends in Microbiology. 21 (2), 82-91 (2013).
- Turner, P. E., Draghi, J. A., Wilpiszeski, R. High-throughput analysis of growth differences among phage strains. Journal of Microbiological Methods. 88 (1), 117-121 (2012).
- Storms, Z. J., Teel, M. R., Mercurio, K., Sauvageau, D. The virulence index: A metric for quantitative analysis of phage virulence. PHAGE. 1 (1), 27-36 (2020).
- . Phage Discovery Guide Available from: https://seaphagesphagediscoveryguide.helpdocsonline.com/home (2012)
- Martinez-Soto, C. E., et al. PHIDA: A high throughput turbidimetric data analytic tool to compare host range profiles of bacteriophages isolated using different enrichment methods. Viruses. 13 (11), 2120-2137 (2021).
- Rajnovic, D., Muñoz-Berbel, X., Mas, J. Fast phage detection and quantification: An optical density-based approach. PLoS One. 14 (5), e0216292 (2019).
- Xie, Y., Wahab, L., Gill, J. J. Development and validation of a microtiter plate-based assay for determination of bacteriophage host range and virulence. Viruses. 10 (4), 189-204 (2018).
- Sørensen, P. E., et al. Classification of in vitro phage-host population growth dynamics. Microorganisms. 9 (12), 2470-2486 (2021).
- Konopacki, M., Grygorcewicz, B., Dołęgowska, B., Kordas, M., Rakoczy, R. PhageScore: A simple method for comparative evaluation of bacteriophages lytic activity. Biochemical Engineering Journal. 161, 107652 (2020).
- Holt, J. G., Krieg, N. R., Sneath, P. H. A., Staley, J. T., Williams, S. T. . Bergey's Manual of Determinative Bacteriology., 9th edition. , (1994).
- Fusconi, R., Godinho, M. J. L., Bossolan, N. R. S. Culture and exopolysaccharide production from sugarcane molasses by Gordonia polyisoprenivorans CCT 7137, isolated from contaminated groundwater in Brazil. World Journal of Microbiology and Biotechnology. 24 (7), 937-943 (2007).
- Bujold, A. R., Lani, N. R., Sanz, M. G. Strain-to-strain variation of Rhodococcus equi growth and biofilm formation in vitro. BMC Research Notes. 12 (1), 519 (2019).
- Ceballos, R. M., Stacy, C. L. Quantifying relative virulence: When µmax fails and AUC alone just is not enough. Journal of General Virology. 102 (1), 001515 (2021).
- Siddiquee, S. The basic concept of microbiology. Practical Handbook of the Biology and Molecular Diversity of Trichoderma Species from Tropical Regions. , 1-15 (2017).
- Petrovski, S., Seviour, R. J., Tillett, D. Genome sequence and characterization of the Tsukamurella bacteriophage TPA2. Applied and Environmental Microbiology. 77 (4), 1389-1398 (2011).
- Growth curves: Generating growth curves using colony forming units and optical density measurements. JoVE Science Education Database. Microbiology Available from: https://www.jove.com/v/10511/growth-curvesgenerating-growth-curves-using-colony-forming-units (2023)
- Preparing spread plates protocols. American Society for Microbiology Available from: https://asm.org/ASM/media/Protocol-Images/Preparing-Spread-Plates-Protocols.pdf (2006)
- Mathes, H. N., et al. Complete genome sequences of Chop, DelRio, and GrandSlam, three Gordonia phages isolated from soil in Central Arkansas. Microbiology Resource Announcements. 12 (5), e0002323 (2023).
- Krishnamurthi, V. R., Niyonshuti, I. I., Chen, J., Wang, Y. A new analysis method for evaluating bacterial growth with microplate readers. PLoS One. 16 (1), 0245205 (2021).
- DescTools: Tools for descriptive statistics, R package version 0.99.49. DescTools Available from: https://CRAN.R-project.org/package=DescTools (2023)
- . dplyr: A grammar of data manipulation, R package version 1.1.2 Available from: https://CRAN.R-project.org/package=dplyr (2023)
- . ggplot2: Create elegant data visualisations using the grammar of graphics, R package version 3.4.2 Available from: https://CRAN.R-project.org/package=ggplot2 (2023)
- . readxl: Read excel files, R package version 1.4.2 Available from: https://CRAN.R-project.org/package=readxl (2023)
- Yao, T., Coleman, S., Nguyen, T. V. P., Golding, I., Igoshin, O. A. Bacteriophage self-counting in the presence of viral replication. Proceedings of the National Academy of Sciences of the United States of America. 118 (51), 2104163118 (2021).
- Fang, Q., Feng, Y., McNally, A., Zong, Z. Characterization of phage resistance and phages capable of intestinal decolonization of carbapenem-resistant Klebsiella pneumoniae in mice. Communications Biology. 5, 48 (2022).
- Burrowes, B. H., Molineux, I. J., Fralick, J. A. Directed in vitro evolution of therapeutic bacteriophages: The Appelmans protocol. Viruses. 11 (3), 241 (2019).
- Shapiro, J. W., Williams, E. S. C. P., Turner, P. E. Evolution of parasitism and mutualism between filamentous phage M13 and Escherichia coli. PeerJ. 4, e2060 (2013).
転載および許可
このJoVE論文のテキスト又は図を再利用するための許可を申請します
許可を申請さらに記事を探す
This article has been published
Video Coming Soon
JoVEについて
Copyright © 2023 MyJoVE Corporation. All rights reserved