
混雑
概要
ソース: ジョナサン ・ Flombaum 講座-ジョンズ ・ ホプキンス大学
人間の視覚は、網膜と呼ばれる組織の目の奥に配置されている光に敏感なニューロンによって異なります。呼ばれてロッドとコーンの形状、ニューロンは網膜には一様に配布されません。代わりは領域、コーンが密集、黄斑と呼ばれる網膜の中心部、黄斑と呼ばれる斑点の中央のサブ領域で特にそう。中心窩外事実上ないのコーン、ロッド密度は中心窩から遠距離でかなり減る。図 1では、この配置を図式化するようです。この種の配置も視覚野のレプリケートされる: より多くの細胞は中心窩周囲と比較して刺激を表します。
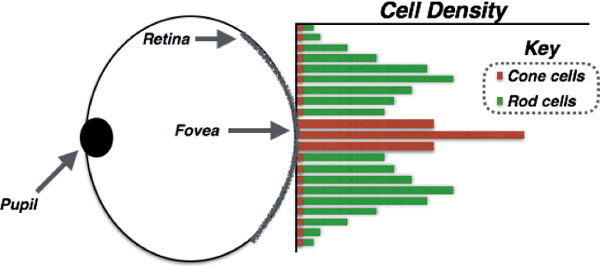
図 1。人間の眼の網膜上の光に敏感な受容体細胞の分布模式。瞳孔は光を入力することができます目の前に開いています。光は、ロッドやコーン、光に敏感な細胞から成っている眼の奥の神経組織、網膜上に焦点を当てた。黄斑は、網膜の中心部、黄斑の中心は中心窩。グラフの位置の関数として網膜の桿体と錐体の受容体の密度を図式化するようです。カラー ビジョンの責任ですが、コーンは中心窩ほとんど専らあります。ロッド、低光の条件で見てサポート同様にクラスター化されてより重く、中心窩付近にすぐに落下黄斑外密度。
結果: 我々 は非常によく; 中心窩を刺激の空間の一部では、直接、私たちの目を指している空間の部分で参照してくださいしかし、我々 は実際に非常によく周囲に表示されません。本当に気づかないが、ので、私たちの目を移動、常に建物の多くの個々 の固定から空間を表現。
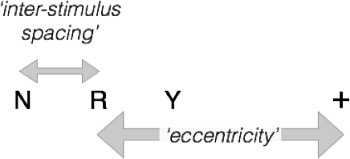
周辺視野の特性を調査する 1 つの方法は、クラウディングと呼ばれる現象です。1叢生は、クラッタ、内のオブジェクトを認識することができないと我々 は周囲のオブジェクトを表示するときに特に強く混雑を経験します。図 2 aは、混雑を体験することができます例: 右側のパックの中には、手紙を報告することができる場合、参照してくださいセンター、クロスを見て。それはおそらくかなり難しいです。今で2 b を図左側の文字を報告してください。はるかに簡単!この図では、文字が混雑していると、それのまわりで散乱がないので認識するように簡単です。

図 2 a。混雑刺激します。中心の十字をじっと見つめるし、左のパックの中に文字を認識できるかどうかを参照してください。周辺の文字があり、中央の文字はそれのまわりで手紙で混雑しているので、難しいはずです。

図 2 b。混雑していない刺激します。この刺激は、図 2 a と同じ、G 文字が混雑しないことを除いて他の文字は、それを囲みます。十字架を注視して、いるにもかかわらず、周囲のと同じくらい図 2 a の G として手紙を簡単に識別する必要があります。
このビデオでは、設計および刺激と文字から混み合い実験を実装する方法を示します。
手順
1. 刺激とデザイン
- 試験はすべて英語の子音、黒で書かれており、36 ヘルベチカ フォントで表示されるを含みます。
- 実験の各試行ではクロス固定で刺激 500 ms の間の左右に提示され最後の応答画面に続いて、500 ミリ秒で表示のセンターでの発表が始まります。図 3では、実験の順序を図式化するようです。
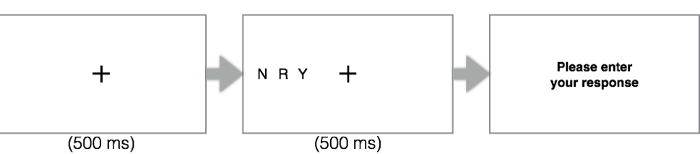
図 3。試験シーケンス。実験の一つの試験でのイベントのシーケンスのとおりです: 参加者 fixates 中央の十字架と試用を開始する space キーを押します。500 ms 後テスト刺激は、右・左の 3 文字を含む固定のどちらにも表示されます。参加者は眼球運動は避けてくださいしかし、グループのセンターの文字を識別するために
結果
申請書と概要
スキップ先...
このコレクションのビデオ:

Now Playing
混雑
Sensation and Perception
5.8K 閲覧数

色の残像
Sensation and Perception
11.2K 閲覧数

あなたの盲点と知覚充填で検索
Sensation and Perception
17.4K 閲覧数

感覚と知覚の視点
Sensation and Perception
11.9K 閲覧数

運動誘発性の失明
Sensation and Perception
7.0K 閲覧数

ゴム手の幻想
Sensation and Perception
18.6K 閲覧数

エイムズの部屋
Sensation and Perception
17.5K 閲覧数

非注意性盲目
Sensation and Perception
13.4K 閲覧数

空間手がかり
Sensation and Perception
15.0K 閲覧数

注意の瞬き
Sensation and Perception
16.1K 閲覧数

倒立顔の効果
Sensation and Perception
15.7K 閲覧数

マガーク効果
Sensation and Perception
16.1K 閲覧数

ちょうど顕著な違い
Sensation and Perception
15.4K 閲覧数

知覚の限界を見つけるため階段のプロシージャ
Sensation and Perception
24.4K 閲覧数

オブジェクト置き換えマスキング
Sensation and Perception
6.6K 閲覧数
Copyright © 2023 MyJoVE Corporation. All rights reserved