JoVE 비디오를 활용하시려면 도서관을 통한 기관 구독이 필요합니다. 전체 비디오를 보시려면 로그인하거나 무료 트라이얼을 시작하세요.
Establishing a Physiologic Human Vascularized Micro-Tumor Model for Cancer Research
요약
This protocol presents a physiologically relevant tumor-on-a-chip model to perform high-throughput basic and translational human cancer research, advancing drug screening, disease modeling, and personalized medicine approaches with a description of loading, maintenance, and evaluation procedures.
초록
A lack of validated cancer models that recapitulate the tumor microenvironment of solid cancers in vitro remains a significant bottleneck for preclinical cancer research and therapeutic development. To overcome this problem, we have developed the vascularized microtumor (VMT), or tumor chip, a microphysiological system that realistically models the complex human tumor microenvironment. The VMT forms de novo within a microfluidic platform by co-culture of multiple human cell types under dynamic, physiological flow conditions. This tissue-engineered micro-tumor construct incorporates a living perfused vascular network that supports the growing tumor mass just as newly formed vessels do in vivo. Importantly, drugs and immune cells must cross the endothelial layer to reach the tumor, modeling in vivo physiological barriers to therapeutic delivery and efficacy. Since the VMT platform is optically transparent, high-resolution imaging of dynamic processes such as immune cell extravasation and metastasis can be achieved with direct visualization of fluorescently labeled cells within the tissue. Further, the VMT retains in vivo tumor heterogeneity, gene expression signatures, and drug responses. Virtually any tumor type can be adapted to the platform, and primary cells from fresh surgical tissues grow and respond to drug treatment in the VMT, paving the way toward truly personalized medicine. Here, the methods for establishing the VMT and utilizing it for oncology research are outlined. This innovative approach opens new possibilities for studying tumors and drug responses, providing researchers with a powerful tool to advance cancer research.
서문
Cancer remains a major health concern worldwide and is the second leading cause of death in the United States. For the year 2023 alone, the National Center for Health Statistics anticipates more than 1.9 million new cancer cases and over 600,000 cancer deaths occurring in the US1, highlighting the urgent need for effective treatment approaches. However, currently, only 5.1% of anti-cancer therapeutics entering clinical trials ultimately gain FDA approval. Failure of promising candidates to successfully progress through clinical trials can be partially attributed to the use of non-physiological model systems, such as 2D and spheroid cultures, during preclinical drug development2. These classical cancer models lack essential components of the tumor microenvironment, such as a stromal niche, associated immune cells, and perfused vasculature, which are key determinants of therapeutic resistance and disease progression. Thus, a new model system that better mimics the human in vivo tumor microenvironment is necessary to improve the clinical translation of preclinical findings.
The field of tissue engineering is rapidly advancing, providing improved methods for studying human diseases in laboratory settings. One significant development is the emergence of microphysiological systems (MPS), also known as organ chips or tissue chips, which are functional, miniaturized human organs capable of replicating healthy or diseased conditions3,4,5. Within this context, tumor chips, which are three-dimensional microfluidic-based in vitro human tumor models, have been developed for oncology research2,3,4,5,6,7,8,9,10,11,12,13. These advanced models incorporate biochemical and biophysical cues within a dynamic tumor microenvironment, enabling researchers to study tumor behavior and responses to treatments in a more physiologically relevant context. However, despite these advancements, few groups have successfully incorporated a living, functional vasculature, particularly one that self-patterns in response to physiologic flow3,4,5,6. The inclusion of a functional vascular network is crucial as it allows for modeling physical barriers that affect drug or cell delivery, cell homing to distinct microenvironments, and transendothelial migration of tumor, stromal, and immune cells. By including this feature, the tumor chip can better represent the complexities observed in the in vivo tumor microenvironment.
To address this unmet need, we have developed a novel drug-screening platform that enables micro-vessel networks to form within a microfluidic device8,9,10,11,12,13,14,15,16. This base organ chip platform, termed the vascularized micro-organ (VMO), can be adapted to virtually any organ system to replicate original tissue physiology for disease modeling, drug screening, and personalized medicine applications. VMOs are established by co-culturing endothelial colony-forming cell-derived endothelial cells (ECFC-EC), HUVEC or iPSC-EC (hereafter EC), and multiple stromal cells in the chamber, including normal human lung fibroblasts (NHLF), which remodel the matrix, and pericytes that wrap and stabilize the vessels. The VMO can also be established as a cancer model system by co-culturing tumor cells with the associated stroma to create a vascularized micro-tumor (VMT)8,9,10,11,12,13, or tumor chip, model. Through the co-culture of multiple cell types in a dynamic flow environment, perfused microvascular networks form de novo in the tissue chambers of the device, where vasculogenesis is closely regulated by interstitial flow rates14,15. Medium is driven through the microfluidic channels of the device by a hydrostatic pressure head that supplies the surrounding cells of the tissue chamber with nutrients exclusively through the micro-vessels, with a permeability coefficient of 1.2 x 10⁻⁷ cm/s, similar to what is seen for capillaries in vivo8.
The incorporation of self-organizing micro-vessels into the VMT model represents a significant breakthrough because it: 1) mimics the structure and function of vascularized tumor masses in vivo; 2) can model key steps of metastasis, including tumor-endothelial and stromal cell interactions; 3) establishes physiologically selective barriers for nutrient and drug delivery, improving pharmaceutical screening; and 4) allows direct assessment of drugs with anti-angiogenic and anti-metastatic capabilities. By replicating the in vivo delivery of nutrients, drugs, and immune cells in a complex 3D microenvironment, the VMO/VMT platform is a physiologically relevant model that can be used to perform drug screening and study cancer, vascular or organ-specific biology. Importantly, the VMT supports the growth of various types of tumors, including colon cancer, melanoma, breast cancer, glioblastoma, lung cancer, peritoneal carcinomatosis, ovarian cancer, and pancreatic cancer8,9,10,11,12,13. In addition to being low-cost, easily established, and arrayed for high throughput experiments, the microfluidic platform is fully optically compatible for real-time image analysis of tumor-stromal interactions and response to stimuli or therapeutics. Each cell type in the system is labeled with a different fluorescent marker to allow direct visualization and tracking of cell behavior throughout the entire experiment, creating a window into the dynamic tumor microenvironment. We have previously shown that the VMT more faithfully models in vivo tumor growth, architecture, heterogeneity, gene expression signatures, and drug responses than standard culture modalities10. Importantly, the VMT supports the growth and study of patient-derived cells, including cancer cells, which better models the pathology of the parent tumors than standard spheroid cultures and further advances personalized medicine efforts11. This manuscript outlines the methods for establishing the VMT, showcasing its utility for studying human cancers.
프로토콜
1. Design and fabrication
- Device design
- For microfluidic device fabrication, create an SU-8 mold using a 200 µm layer of SU-8 spin-coated onto a Si-wafer (RCA-1 cleaned and 2% hydrogen fluoride (HF) treated), followed by a single mask photolithography step as described previously8,9.
- Cast a 4 mm thick polydimethylsiloxane (PDMS) replica from the SU-8 mold to generate a durable polyurethane mold for downstream fabrication steps. Various design iterations can be used8,9,10,11,12,13,14,15.
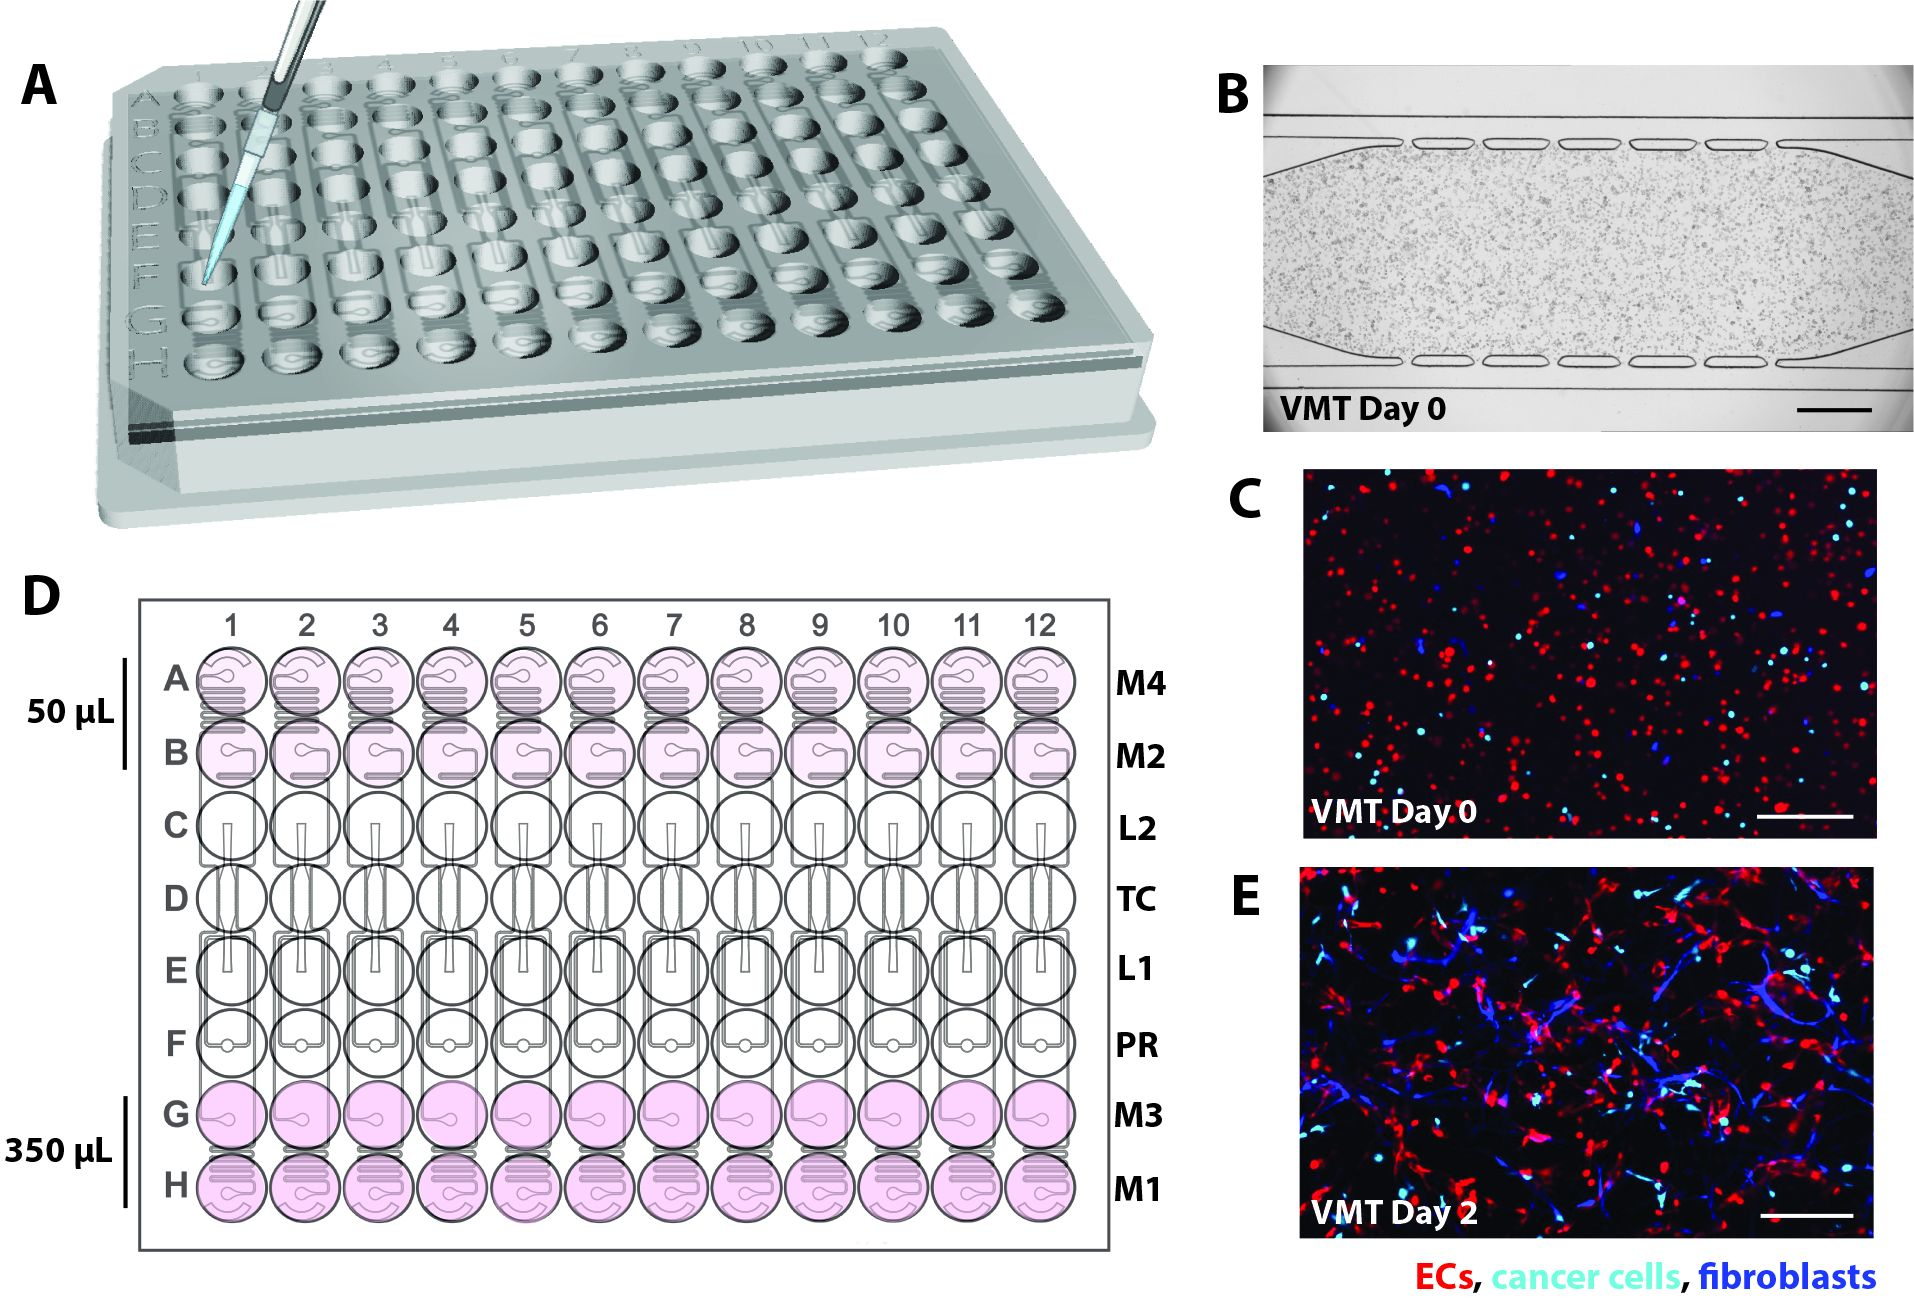
- In the current iteration, design the microfluidic device to be custom-fitted into a standard 96-well plate format and consisting of a 2 mm thick PDMS feature layer with 12 microfluidic device units enclosed by a thin (1/16 inch) transparent polymer membrane layer on the bottom (Figure 1A).
- Ensure that individual tissue units consist of a tissue chamber flanked by gel loading inlet (L1) and outlet (L2), a pressure regulator (PR)16, and decoupled microfluidic channels connected to 2 media inlets and outlets on each side (M1-M2, M3-M4; Figure 1B).
- Position each inlet and outlet within a single well that serves as a medium reservoir to establish hydrostatic pressure (10 mm H2O) across the microfluidic channel. To allow vascular network anastomoses with the outer channels, connect microfluidic channels to the tissue chamber via 50 µm wide communication pores (6 on top, 6 on bottom).
NOTE: Microfluidic resistors create a 5 mm H2O interstitial pressure gradient across the tissue chamber that becomes intraluminal once the vascular network is fully formed8,10. The subsequent procedures begin with a fully assembled high throughput plate.

Figure 1. Microfluidic platform design. (A) The schematic of the platform assembly shows the PDMS feature layer with 12 device units bonded to a bottomless 96-well plate and sealed with a thin transparent polymer membrane. Each device unit occupies a column of wells on the plate. The single device unit outlined in red is shown with details in (B). (B) Schematic of one device unit shows a single tissue chamber positioned within one well of the 96-well plate and two loading ports with inlet and outlet (L1-L2) hole punched to allow cell-matrix mix to be introduced. Medium inlets and outlets (M1-M2, M3-M4) are hole-punched and positioned within wells that serve as media reservoirs. Different volumes of media establish a hydrostatic pressure gradient across the tissue chamber via decoupled microfluidic channels. The pressure regulator (PR) unit serves as a gel burst valve to increase ease of loading. Note that the device is 200 µm deep, and the tissue chamber is 2 mm x 6 mm. Please click here to view a larger version of this figure.
2. Preparations prior to loading
- Cell culture
- Maintain cells according to the manufacturer's recommendations in a humidified 37 °C and 5% CO2 incubator.
- Plate T75 flasks of transduced EC, NHLF, or other fibroblast/stromal cell and desired cancer cells 3-4 days prior to loading at a density informed by manufacturer and user protocols. For this protocol, plate 1 x 10⁶ cells per flask for each cell type. Culture EC in Endothelial Growth Media 2 (EGM2) complete media, NHLF in Dulbecco's Modified Eagle Medium (DMEM) with 10% FBS, and cancer cells in appropriate media depending on cell type.
- Maintain cells by feeding with the respective media every 2-3 days and reconfirm the transduction or labeling efficiency by visualizing cells under a fluorescent microscope. On the day of loading, ensure EC is 80%-100% confluent, whereas NHLF is subconfluent at 70%-80%.
- Preparation of fibrinogen
- Prepare the fibrinogen solution to the desired concentration (typically, 5-8 mg/mL supports robust vascular network formation), accounting for the percent clotting of fibrinogen. Calculate the amount of fibrinogen needed with the following equation:
Fibrinogen (mg) = (volume (mL)) x (concentration (mg/mL))/ (clotting %) - Dissolve the fibrinogen in an appropriate volume of endothelial basal media 2 (EBM2), warmed to 37 °C, by gently flicking the tube (do not vortex). Incubate fibrinogen in a 37 °C water bath to allow it to completely go into solution. Importantly, do not use a complete medium.
- Sterile-filter fibrinogen solution with 0.22 µm filter and aliquot to desired volume, typically 400 µL per microcentrifuge tube.
NOTE: Other matrix proteins (e.g., collagens, fibronectin, or laminin) can be spiked into the fibrinogen mix.
- Prepare the fibrinogen solution to the desired concentration (typically, 5-8 mg/mL supports robust vascular network formation), accounting for the percent clotting of fibrinogen. Calculate the amount of fibrinogen needed with the following equation:
3. Loading of samples
NOTE: Loading is time-sensitive and should be completed from start (cell lifting) to finish (addition of media to devices) within about 1.5-1.75 h to ensure optimal results. Each step is noted with a suggested timer to help keep the user on track.
- Preparation of materials (Day of loading)
- Place the following in a 37 °C water bath for 10-15 min: Hank's balanced salt solution (HBSS) or phosphate-buffered saline (PBS) for washing cells, cell dissociation reagent, media (e.g., EGM2, DMEM)
- Keep the following reagents in a 4 °C fridge until ready for use: thrombin, laminin (thawed overnight at 4 °C).
- Thaw fibrinogen aliquot at room temperature. Prepare 1.5 µL aliquots of thrombin into 500 µL microcentrifuge tubes, with one tube per device unit. Ensure that the thrombin aliquot is at the bottom of each tube to facilitate loading.
- Place UV-sterilized high throughput plates into a desiccator for at least 30 min prior to loading to remove air trapped in the microfluidics.
- Cell preparation (Timer start = begin at 0 min)
- Check cells under the microscope at 4x magnification to confirm confluency and transduction efficiency.
- Wash each T75 flask of cells 2x with 5 mL of HBSS and aspirate completely. Add 1 mL of dissociation reagent to each flask and incubate at 37 °C, 5% CO2 for 1-2 min.
- Gently tap the plate using the palm of your hand and check that all cells have been lifted.
- Wash the cells off the flask with 9 mL of appropriate media and collect them into a 15 mL conical. Immediately remove a small aliquot for cell counting.
- Centrifuge the cells at 300 x g for 3-5 min at 4 °C. While centrifuging cells, count the cells. A confluent T75 flask of EC or NHLF should yield at least 2 x 10⁶ cells.
- After centrifugation, aspirate media and resuspend the pellet in appropriate media at a concentration of 1 x 10⁶ cells/mL. Keep cells on ice.
- Preparation of cell and fibrinogen mixture (Timer = begin at 20 min)
- Determine how many devices will be loaded, adding 1-2 to account for pipetting loss, and multiply by the volume of cell/fibrinogen mix needed per device. This will depend on device configuration, but for the device design presented in this article, 6 µL per device is required.
- The concentration of each cell type should be determined experimentally. For a starting point, load EC at a concentration of approximately 7 x 10⁶ cells/mL and NHLF at a concentration of 3.5 x 10⁶ cells/mL. The concentration of cancer cells can vary considerably based on their growth rate but typically lies within the range of 0.5-2 x 10⁶ cells/mL. Use this equation to calculate the number of cells needed:
Number of cells needed = (volume of fibrin (µL))/1000 µL x (concentration of cells) - Resuspend the cells at a concentration of 1 x 10⁶ cells/mL and use the following equation to determine the volume of cells needed:
Volume of cells needed (µL) = (number of cells needed)/1000 - Mix respective volumes of EC, NHLF, and cancer cells (for VMT only) in a conical tube and centrifuge at 300 x g for 3-5 min at 4 °C.
- After spinning, carefully aspirate media and pipet away any residual media near the pellet. Gently but thoroughly resuspend the pellet into the calculated volume of fibrinogen, taking extra care not to introduce air bubbles. Keep on ice.
- Bring sterilized plates and thrombin aliquots into the tissue culture hood.
- Loading devices (Timer = begin at 30-35 min)
- Using a P20 pipette, pipet 6 µL of volume from the cell/fibrin mix. Be sure to pipet the mixture up and down at least 5x to ensure uniform cell suspension. Keep the mix on ice to slow clotting.
- Gently mix the cell/fibrin into one tube of thrombin by putting the pipet tip directly into the thrombin aliquot at the bottom of the tube. Immediately pipet up and down at least 2x, taking care not to introduce air bubbles. The fibrin will begin to clot once mixed with thrombin, so quickly but deliberately complete steps 3.4.3. and 3.4.4. before the fibrin gels in the pipette tip (~3 s).
- Lift the high throughput plate at an angle and quickly insert the pipet tip into one of the device loading ports (L1 or L2). See Figure 2A for schematic.
- Push the pipet plunger down to the first stop with a smooth, fluid motion to inject the cell/fibrin mix into the tissue chamber. Watch for the gel to cross completely through the chamber.
NOTE: Applying too much pressure during this step can lead to bursting of the gel into the microfluidic channels at the top and/or bottom of the tissue chambers. - Gently place the plate back down flat in the tissue culture hood without removing the pipette tip, releasing the pipette plunger, or disturbing the pipette. Use your hand to twist and remove the pipette tip from the P20 and leave it in the loading port hole. Do not use the ejector button to remove the tip as this will cause too much pressure.
- Proceed with steps 3.4.1-3.4.5 for the remaining devices.
- When loading is complete, allow the plate to sit for 2 min undisturbed in the tissue culture hood.
- Remove pipette tips by gently twisting and pulling them from the loading ports. Replace the lid on the plate.
- Incubate the entire plate for 15-20 min in a 37 °C incubator to allow the gel to fully polymerize.
- After incubating, check each device unit under the microscope. Check to see that cells are evenly distributed throughout the chamber without any air bubbles and that there is a clearly visible gel interface between the tissue chamber and the microfluidic channels, as in Figure 2B-C.
- Channel coating with laminin (Timer = begin at 45-50 min)
- After the gels are completely solid, introduce laminin into the microfluidic channels to promote vascular anastomosis.
- Using a P20, introduce 4 µL of laminin into each microfluidic channel (top and bottom) of the device. Insert the pipet tip into M1 or M3 and expel the laminin slowly, watching to ensure that the laminin coats the entire top channel, and then repeat for M2 or M4 to coat the entire bottom channel.
- Determine the orientation by pipetting laminin from the side opposite to the pressure regulator to allow sufficient pressure to push it through. However, if laminin does not travel easily from one side, remove the tip from one side and push the laminin from the other side. Going to the second stop of the pipette (i.e., push the plunger all the way down) may be needed to generate sufficient pressure to push the laminin through the entire channel.
- Remove the tip gently from the media inlet/outlet. Do not use the ejector button on the P20.
- Repeat steps 3.5.1-3.5.4 for each device and incubate the plate at 37 °C, 5% CO2 for 10 min.
- Media addition (Timer = begin at approximately 1 h 10 min)
- Add 275 µL of EGM2 complete media into the uncoupled media reservoirs of wells in rows A and B or G and H. This will be the high side, and the orientation should be determined by making the wells on the side opposite to the pressure regulator high volume to start. Media will be pushed from the high side by gravity.
- Using a P200 pipette, introduce 75 µL of media into the medium inlets/outlets of the wells containing the 275 µL of EGM2. Insert the tip into the media inlet hole and slowly expel the medium, watching that the media travels through the channel and bubbles up on the other side.
- Remove the pipet tip and push the remaining media from the tip into the media reservoir so that the total volume on the high side is 350 µL.
- Repeat steps 3.6.1-3.6.3 for each device unit, top and bottom channels.
- Add 50 µL of media to completely cover the low side, wells in rows A and B or G and H, depending on the orientation described above. Ensure that there is an even layer of media covering the bottom of the well. Refer to Figure 2D for a schematic showing volumes of media in the reservoirs.
- Removing air bubbles (post-loading)
NOTE: Removing bubbles is a critical step to ensure proper flow in each device. By day 2, endothelial cells and fibroblasts will begin to stretch out in response to flow (Figure 2E).- Once all media is added, incubate plates for 1-2 h in a 37 °C, 5% CO2 incubator before checking for air bubbles in the channels or at the medium inlets/outlets.
- Visualize bubbles in the media channels on the microscope and expel by reintroducing 75 µL of media into the channels to push the bubbles out.
- Visualize bubbles in the medium inlets/outlets by eye. Use a P200 pipette to remove air bubbles trapped at the medium inlets and outlets by pushing the plunger down, introducing the tip into the hole, and pulling the bubble out by lifting the plunger to apply negative pressure and suck up the bubble.

Figure 2. Schematic of device loading. (A) Using a P20 pipette, cell/fibrin mix is introduced into the tissue chamber of each device unit via one of the loading ports. (B) Brightfield micrograph shows a microfluidic device loaded EC, fibroblasts, and cancer cells to form a VMT. Scale bar = 500 µm. (C) Fluorescence micrograph of the device in B showing EC in red, tumor in cyan, and fibroblasts in blue. (D) The schematic shows the addition of medium into the reservoirs, with 350 µL on the high side and 50 µL on the low side to generate the hydrostatic pressure head. (E) Day 2 of VMT culture shows fibroblasts and EC beginning to stretch out to form the vascular network. Scale bar = 200 µm. Please click here to view a larger version of this figure.
4. Device maintenance and experimental applications
- Maintenance and drug treatment
NOTE: To maintain flow in the system, hydrostatic pressure must be re-established daily by pipetting the volume of media from the low side back to the high side or vice versa, ensuring the total volume in the high side remains at 350 µL. Flow direction is switched every day after day 2 of VMO or VMT establishment. Additional maintenance and treatment details are provided below.- Change media every other day with EGM2 complete until the vasculature is fully established (day 5-6). Aspirate old media completely and replace high-pressure wells (350 µL) and low-pressure wells (50 µL).
NOTE: Experimental determination of optimized media formulations can be conducted for other cell types, often involving a 50:50 mix or addition of specific components into EGM2. - Once the vascular network is formed and tissue is fully developed (day 4-7), perform a dextran perfusion test before using the devices for experiments (step 4.2.1.). Only use devices that have sufficient perfusion into the tissue chamber.
- For experiments using therapeutics, on the day treatment begins, take images in all fluorescent channels for each device. This will serve as a baseline.
- Treat devices with desired therapeutic by replacing the medium with fresh medium containing the diluted drug at the desired concentration. Ensure drugs are diluted in appropriate vehicles depending on manufacturer's recommendation, but do not exceed 0.01% DMSO in the media.
- Expose devices to the drug for the desired amount of time (typically 48 h but can be informed by pharmacokinetics).
- Image every channel of each device at the desired time interval to monitor treatment response. Maintain plates as indicated in step 4.1.1 for the duration of the experiment.
- At completion of experiment, bleach plates and place in a biohazard container, fix with 4% PFA for immunofluorescent staining (step 4.3.), or harvest for live cell or RNA isolation (step 4.4.).
- Change media every other day with EGM2 complete until the vasculature is fully established (day 5-6). Aspirate old media completely and replace high-pressure wells (350 µL) and low-pressure wells (50 µL).
- Perfusion assays
- Perfusion of dextran
NOTE: Vascular permeability/patency can be determined by perfusing the vascular network with fluorescently labeled dextran of varying molecular weights (40 kD, 70 kD, or 150 kD). FITC- or rhodamine-dextran can be used depending on the fluorescent label of the EC.- Prior to perfusion, determine the appropriate exposure of the FITC or rhodamine channel by adding a few µL of dextran within the fluidic channel or chamber of an empty device. Set exposure time just below the saturation level through the use of microscope software to display a histogram of pixel intensities, ensuring a dynamic range characterized by uniformly distributed pixels without any notable concentration of high-intensity values.
- Take micrographs of all devices in channels of interest, including a background image of all devices in the fluorescent dextran channel, to calibrate against the background. Use the same exposure as determined above and align the tissue chamber at the center of the image frame to ensure consistent images for quantification.
- Prepare a main stock of FITC-dextran or rhodamine-dextran at a concentration of 5 mg/mL in 1x DPBS. This stock can be kept at 4 °C.
- To prepare a working stock, dilute 5 mg/mL stock to a final concentration of 50 µg/mL in EGM2.
- Replace the media in the reservoirs with the diluted dextran solution as half maximal volume (175 µL into one well as the high side on the top or bottom channel of the tissue chamber). Replace the media in the other wells so that the uncoupled high side gets 175 µL of fresh EGM2 without dextran, and the wells on the low side only have 50 µL in each.
NOTE: Dextran should only be added to one side of the microfluidic channels (top or bottom) to allow visualization of dye traveling through the high-pressure side, into the vascular bed, and out the low-pressure side. - Under the microscope, watch for the fluorescent dextran to flow through the vascular network. This typically will occur within approximately 2 min after adding the dye to the media reservoir.
- Begin imaging the fluorescent dextran channel (and other channels, if desired). This is T = 0 timepoint. Take additional images at multiple time points (typically every 10 min) or a single end-point image.
- Perfusion of cells
NOTE: Various cell types can be perfused through the vasculature depending on the study design, including lymphocytes or macrophages for cancer immunology studies, as well as cancer cells for metastasis studies. Cells must be fluorescently labeled to facilitate tracking over time.- At least 2 h before perfusing cells, perform dextran perfusion on all devices as outlined above. This step is important to determine vascular patency prior to adding cells.
- Determine the appropriate camera exposure for the cells to be perfused. Take a small sample of cells to view under the microscope and set the exposure time for that fluorescent marker. Set exposure time just below the saturation level.
- Take micrographs of all devices in channels of interest, including a background image of all devices in the fluorescent dextran channel, to calibrate against the background. Use the same exposure as determined in step 4.2.2.1.
- Confirm that dextran has diffused completely out of the tissue chambers before harvesting the cells for perfusion. Harvest and count the cells of interest.
- Resuspend cells at appropriate density into EGM2. For example, T cells are typically added at approximately 1 x 10⁶ cells/mL to mimic the concentration in blood.
NOTE: EC are sensitive to media composition but can tolerate up to 50% mix with most other media. Test beforehand. - Add 175 µL of cell suspension into one well on the high side of each device and add 175 µL of EGM2 complete to the other well. On the low side, add 50 µL of EGM2 complete media to both wells.
- Under the microscope, watch for the fluorescent cells to flow through the vascular network. This will typically occur within approximately 2 min after adding the cells to the media reservoir.
- Once cell flow is established, begin imaging the fluorescent cell channel (and other channels, if desired). This is T = 0 timepoint. Take additional images at multiple time points or a single end-point image, depending on the study design. For example, imaging every 10 min will result in high-resolution time courses or every 6-12 h to track periodic cell movements.
- Perfusion of dextran
- Immunofluorescent (IF) staining
- Aspirate media from wells. Add 200 µL of 4% PFA to both wells of the high side of each device unit and 50 µL to the low side. Allow PFA to flow through the chambers for 15 min at room temperature or 30 min at 4°C.
- During the incubation, prepare a 24-well plate with 500 µL of 1x PBS per well. Calculate how many wells are needed to stain each device.
- Remove PFA completely from wells. Turn the plate upside down and carefully remove the plastic backing on the membrane.
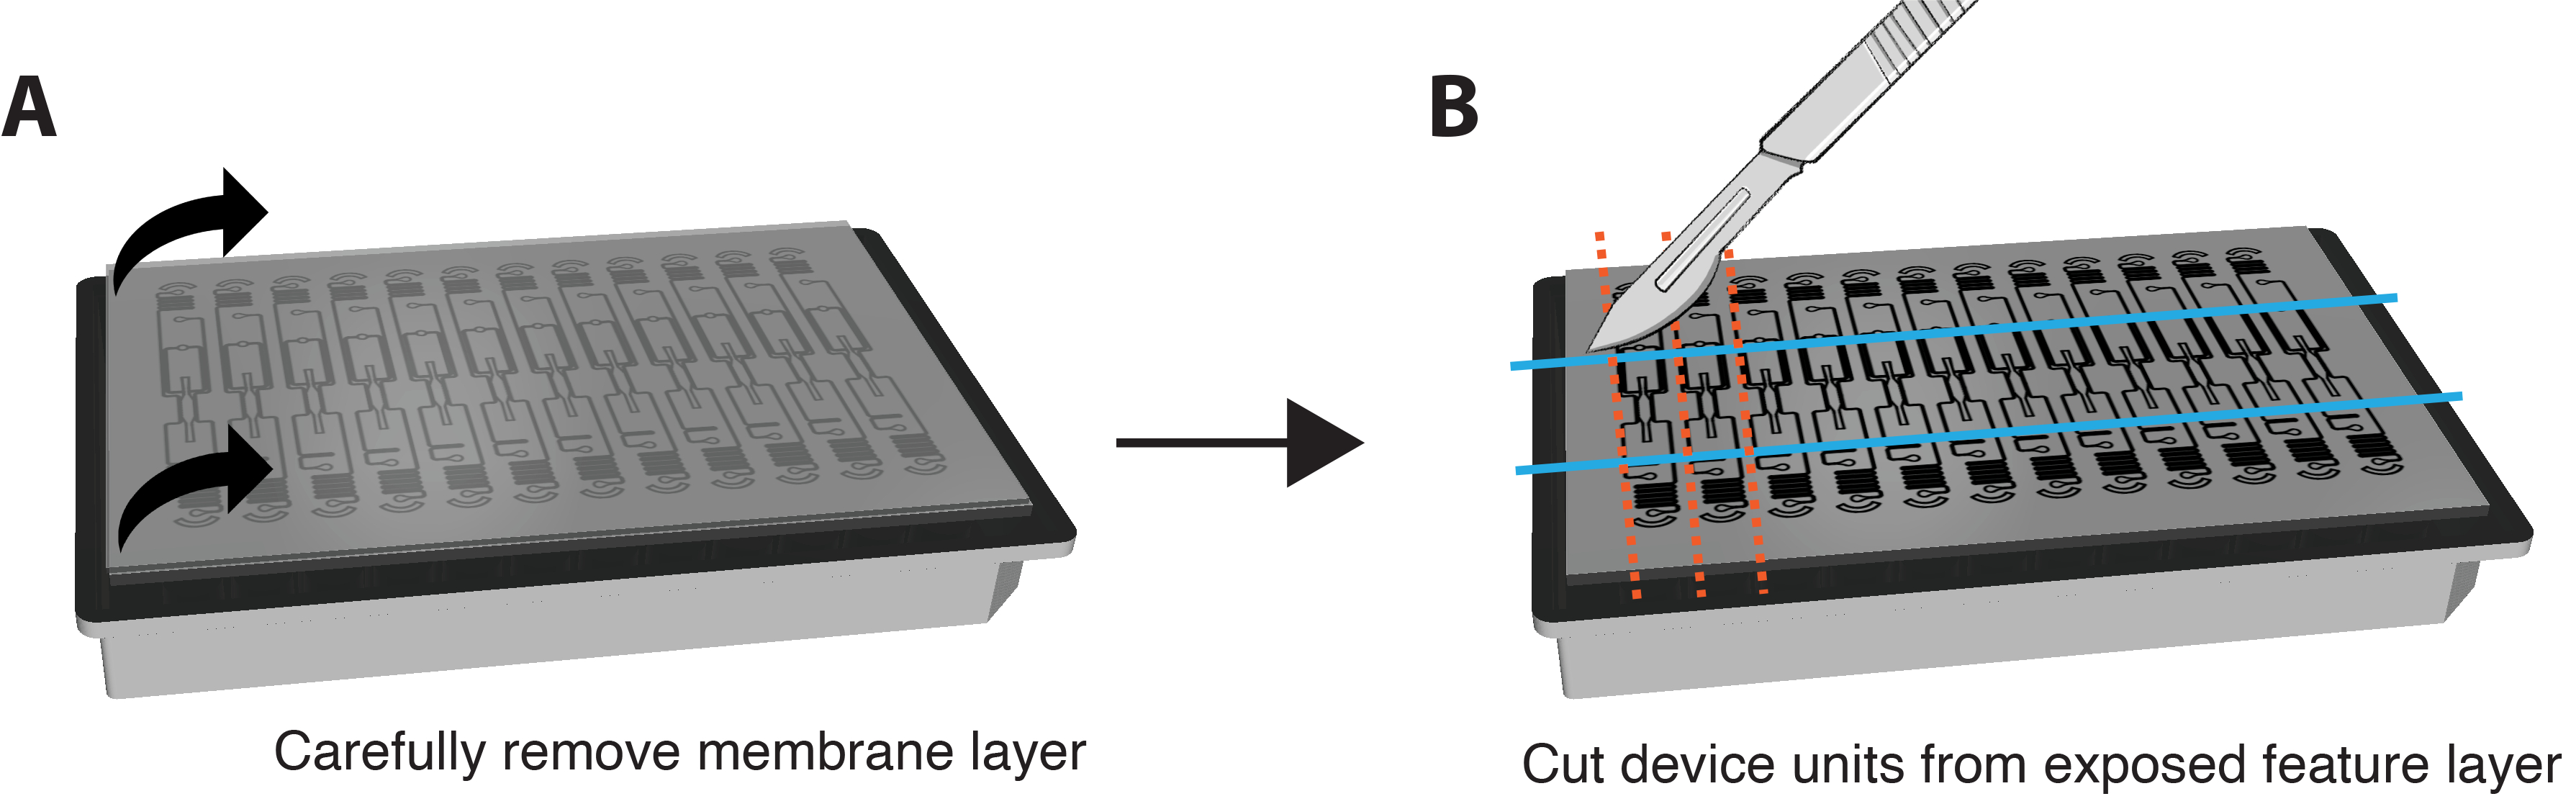
NOTE: IF staining can also be performed in situ without removing the membrane and device. To do so, perform staining steps by perfusing reagents through the VMO/VMT and increase the duration of each incubation step by approximately 6-fold. - Very gently and carefully peel the bottom membrane layer off the feature layer of the device to expose the tissue chambers by gripping both corners and pulling down in a slow and smooth motion. Most of the tissue should remain in the tissue chamber. Please refer to Figure 3A.
- Use a razor blade or scalpel to apply sufficient force to fully cut through the feature layer and cut a small rectangle around each individual device unit, as shown in Figure 3B.
- Wedge a spatula between the feature layer and the well plate. Apply gentle pressure underneath the feature layer to carefully remove the entire feature layer containing the tissue chamber from the well plate.
- Place each rectangular PDMS feature layer piece containing the tissue face down into a single well containing PBS.
- Once all units are in wells, wash with PBS by placing the plate on a gentle rocker for 5 min, aspirating PBS from the well, and replacing it with 500 µL of fresh PBS. Repeat for a total of 3 washes.
- Aspirate PBS from each well and permeabilize tissues with 500 µL of 0.5% Triton-X in PBS, 2x for 10 min each on a gentle rocker. Remove permeabilization solution.
- Block in 500 µL of 10% serum in 0.1% Triton-X per device for 1 h at room temperature with gentle rocking.
- Dilute primary antibodies in 3% serum in 0.1% Triton-X to the desired concentration and volume. Remove the blocking solution and add enough primary antibody solution to fully cover the bottom of each well and allow free movement of the device tissues (~200 µL). Cover the plate with a transparent film.
- Incubate the plate rocking overnight at 4 °C. The next day, bring the plate containing device tissues back to room temperature (~15 min).
- Aspirate primary antibody solution from each well and wash chambers with 500 µL of PBS, 3x for 5 min each on a gentle rocker.
- Add 200 µL of secondary antibody in 3% serum in 0.1% Triton-X at the desired concentration. Incubate the plate with gentle rocking for 1 h at room temperature in the dark.
- Aspirate secondary antibody solution and wash with PBS, 3x for 5 min each with gentle rocking. Add a solution of 1x DAPI in 0.1% Triton-X for 10 min while rocking in the dark.
- Remove rectangular device cut-outs containing stained tissues from the plate using tweezers and place tissue-side up on a paper towel.
- Pipette a few µL (~10 µL) of antifade solution directly on each chamber and coverslip, taking care not to introduce bubbles. Allow antifade to cure on chambers overnight at room temperature in the dark and then proceed with imaging.
- Tissue and cell isolation for molecular assays
NOTE: Each high throughput plate will contain approximately 1-2 x 10⁵ cells, depending on the time point of harvest. Scale the number of experimental replicates to account for total cells as well as potential loss during harvesting.- Single-cell analyses
- Aspirate media from each well and invert the high-throughput plate so that the device layer is facing up.
- Remove the plastic backing on the membrane. Very gently and carefully peel the PDMS bottom membrane off the feature layer of the device to expose the tissue chambers by gripping both corners and pulling down in a slow and smooth motion.
- The membrane can be removed even with proper bonding. Most of the tissue should remain in the tissue chamber after removing the membrane; however, if any portion is stuck to the membrane, follow the steps below on the membrane itself.
- Wash each device unit with 500 µL of HBSS or PBS. To each device unit, add 100 µL of dissociation reagent and allow it to sit as a droplet on top of the device. Put the plate back in the 37 °C incubator for 5 min.
- After digestion, use a P200 pipette to pipet up and down across the tissue chambers and collect the tissues in the dissociation reagent. Move the pipet tip back and forth across each device to ensure full removal of the tissue and collect into a 15 mL conical with 500 µL of EGM2 to neutralize the dissociation reagent.
- For full removal of remaining cells from the tissue chamber, add 500 µL of EGM2 to each device unit and wash with a P200 pipette.
- Centrifuge the digestion solution containing the dislodged tissues at 300 x g for 5 min at 4 °C to pellet single cells and whole tissues.
- Carefully aspirate media and add 500 µL of 1 mg/mL (200 U/mL) collagenase type IV, 0.1 mg/mL hyaluronidase type V, and 200 U/mL DNAse type IV in HBSS to the tissues.
- After gentle resuspension, allow the solution to sit for 2 min at room temperature before pipetting gently again to dissociate the gel.
- Wash digestion mix with 10 mL of EGM2 and centrifuge at 300 x g for 5 min at 4 °C. Resuspend cells in 1x DPBS with 1% BSA or HSA and pass through a pre-wetted 70 µm filter by spinning at 200 x g for 1 min.
- Count the cells and adjust the volume so that the final concentration is 1000 cells per µL. Cellular suspensions can then be subjected to FACS, flow cytometry, or single-cell RNA sequencing.
- RNA isolation from whole tissues
- Follow steps 4.4.1.1 and 4.4.1.2 above.
- Add approximately 10 µL of RNA lysis buffer onto each exposed tissue chamber, ensuring that buffer pools directly on top of tissues. Do not use more than 100 µL of RNA lysis buffer in total.
- Incubate for 3 min at room temperature. Use the P20 to pipet up and down on each device unit and use the pipet tip to scrape any residual material from the tissue chamber if necessary.
- Transfer as much lysis buffer as possible into a 1.5 mL microcentrifuge tube. Repeat steps 4.4.2.2.-4.4.2.3. for remaining devices and pool samples into the 1.5 mL tube.
- Follow the manufacturer's instructions for isolating RNA, depending on the kit or reagents.
- Single-cell analyses

Figure 3. Preparing platform for immunostaining. (A) Schematic of fully assembled device platform with membrane layer on top. To remove the membrane, carefully pull each corner of the outer layer down in a steady, gentle motion. (B) Once the membrane layer is removed completely, use a blade, scalpel, or knife to cut rectangles around the tissue chamber of each device unit, taking care not to cut into the tissue itself. A spatula can then be wedged under each rectangle to dislodge it from the plate and place each unit into a single well of a 24-well plate with PBS for staining. Please click here to view a larger version of this figure.
결과
Following the protocols outlined here, VMOs and VMTs were established using commercially purchased EC, NHLF, and, for VMT, the triple-negative breast cancer cell line MDA-MB-231. Established VMOs were also perfused with cancer cells to mimic metastasis. In each model, by day 5 of co-culture, a vascular network self-assembles in response to gravity-driven flow across the tissue chamber, serving as a conduit for in vivo like delivery of nutrients, therapeutics, and cancer or immune cells to the stromal niche (
토론
Nearly every tissue in the body receives nutrients and oxygen through the vasculature, making it a critical component for realistic disease modeling and drug screening in vitro. Moreover, several malignancies and disease states are defined by vascular endothelial dysfunction and hyperpermeability3. Notably, in cancer, tumor-associated vasculature is often ill-perfused, disrupted, and leaky, thus acting as a barrier to therapeutic and immune cell delivery to the tumor. Furthermore, vascula...
공개
CCWH has an equity interest in Aracari Biosciences, Inc., which is commercializing a version of the technology described in this paper. The terms of this arrangement have been reviewed and approved by the University of California, Irvine, in accordance with its conflict-of-interest policies. There are no other conflicts of interest.
감사의 말
We thank members of Dr. Christopher Hughes' lab for their valued input into the procedures described, as well as our collaborators in Dr. Abraham Lee's lab for their assistance with platform design and fabrication. This work was supported by the following grants: UG3/UH3 TR002137, R61/R33 HL154307, 1R01CA244571, 1R01 HL149748, U54 CA217378 (CCWH) and TL1 TR001415 and W81XWH2110393 (SJH).
자료
| Name | Company | Catalog Number | Comments |
| Fabrication | |||
| (3-Mercaptopropyl)trimethoxysilane, 95% | Sigma-Aldrich | 175617-100G | |
| Greiner Bio-One μClear Bottom 96-well Polystyrene Microplates | Greiner Bio-One | 655096 | |
| Methanol ≥99.8% ACS | VWR Chemicals BDH | BDH1135-1LP | |
| MILTEX Sterile Disposable Biopsy Punch with Plunger, 1mm diameter, | Integra Miltex | 33-31AA-P/25 | |
| PDMS membrane | PAX Industries | HT-6240 | |
| Plasma Cleaner PDC-001 | Harrick Plasma | N/A | |
| Smooth-Cast 385 | Smooth-On | N/A | |
| SP Bel-Art Lab Companion Clear Polycarbonate Cabinet Style Vacuum Desiccator | Bel-Art | F42400-4031 | |
| Standard Lids with Condensation Rings, 96-well plate | VWR | 82050-827 | |
| SYLGARD 184 Silicone Elastomer Kit (PDMS) | Dow | 4019862 | |
| Cell culture/Loading | |||
| BioTek Lionheart FX Automated Microscope | Agilent | CYT5MFAW | |
| CELLvo Human Endothelial Progenitor Cells | StemBioSys | N/A | |
| Collagen I, rat tail | Enzo Life Sciences | ||
| Collagenase from Clostridium histolyticum (type 4) | Sigma-Aldrich | C5138 | |
| Corning Hank’s Balanced Salt Solution, 1X without calcium and magnesium | Corning | 21-021-CV | |
| Corning DMEM with L-Glutamine, 4.5g/L Glucose and Sodium Pyruvate | Corning | 10013CV | |
| DAPI | Sigma-Aldrich | D9542 | |
| DPBS, no calcium, no magnesium | Gibco | 14190144 | |
| EGM-2 Endothelial Cell Growth Medium-2 BulletKit | Lonza | CC-3162 | |
| Fibrinogen from bovine plasma | Neta Scientific | SIAL-341573 | |
| Fibronectin human plasma | Sigma-Aldrich | F0895 | |
| Fluorescein isothiocyanate–dextran (70kDa) | Sigma-Aldrich | FD70S-1G | |
| Gelatin from porcine skin | Sigma-Aldrich | G1890 | |
| Hyaluronidase from sheep testes (type 4) | Sigma-Aldrich | H6254 | |
| Laminin Mouse Protein | Gibco | 23017015 | |
| Leica TCS SP8 | Leica | N/A | |
| MDA-MB-231 | ATCC | HTB-26 | |
| NHLF – Normal Human Lung Fibroblasts | Lonza | CC-2512 | |
| Nikon Eclipse Ti | Nikon | N/A | |
| Paraformaldehyde 4% in 0.1M Phosphate BufferSaline, pH 7.4 | Electron Microscopy Sciences | 15735-90-1L | |
| PBMCs - Peripheral blood mononuclear cells | Lonza | CC-2702 | |
| PBS, pH 7.4 | Gibco | 10010049 | |
| Premium Grade Fetal Bovine Serum (FBS), Heat Inactivated | Avantor Seradigm | 97068-091 | |
| ProLong Gold Antifade Mountant | Invitrogen | P10144 | |
| Quick-RNA Microprep Kit | Zymo Research | R1051 | |
| Thrombin from bovine plasma | Sigma-Aldrich | T4648 | |
| Triton X-100 (Electrophoresis), | Fisher BioReagents | BP151-100 | |
| TrypLE Express Enzyme (1X), phenol red | Gibco | 12605028 | |
| Trypsin-EDTA (0.05%), phenol red | Gibco | 25300062 | |
| Vasculife | Lifeline Cell Technology | LL-0003 |
참고문헌
- Siegel, R. L., Miller, K. D., Wagle, N. S., Jemal, A. Cancer statistics, 2023. CA Cancer J Clin. 73 (1), 17-48 (2023).
- Hachey, S. J., Hughes, C. C. W. Applications of tumor chip technology. Lab Chip. 18 (19), 2893-2912 (2018).
- Ewald, M. L., Chen, Y. H., Lee, A. P., Hughes, C. C. W. The vascular niche in next generation microphysiological systems. Lab Chip. 21 (17), 3615-3616 (2021).
- Osaki, T., Sivathanu, V., Kamm, R. D. Vascularized microfluidic organ-chips for drug screening, disease models and tissue engineering. Curr Opin Biotechnol. 52, 116-123 (2018).
- Shirure, V. S., Hughes, C. C. W., George, S. C. Engineering vascularized organoid-on-a-chip models. Annu Rev Biomed Eng. 23, 141-167 (2021).
- Del Piccolo, N., et al. Tumor-on-chip modeling of organ-specific cancer and metastasis. Adv Drug Deliv Rev. 175, 113798 (2021).
- Sontheimer-Phelps, A., Hassell, B. A., Ingber, D. E. Modelling cancer in microfluidic human organs-on-chips. Nat Rev Cancer. 19 (2), 65-81 (2019).
- Sobrino, A., et al. 3D microtumors in vitro supported by perfused vascular networks. Sci Rep. 6, 31589 (2016).
- Phan, D. T. T., et al. A vascularized and perfused organ-on-a-chip platform for large-scale drug screening applications. Lab Chip. 17 (3), 511-520 (2017).
- Hachey, S. J., et al. An in vitro vascularized micro-tumor model of human colorectal cancer recapitulates in vivo responses to standard-of-care therapy. Lab Chip. 21 (7), 1333-1351 (2021).
- Hachey, S. J., et al. A Human Vascularized Micro-Tumor Model of Patient-Derived Colorectal Cancer Recapitulates Clinical Disease. Transl Res. 255, 97-108 (2023).
- Liu, Y., et al. Human in vitro vascularized micro-organ and micro-tumor models are reproducible organ-on-a-chip platforms for studies of anticancer drugs. Toxicology. 445, 152601 (2020).
- Jahid, S., et al. Structure-based Design of CDC42 Effector Interaction Inhibitors for the Treatment of Cancer. Cell Rep. 39 (4), 110760 (2022).
- Hsu, Y. H., Moya, M. L., Hughes, C. C. W., George, S. C., Lee, A. P. A microfluidic platform for generating large-scale nearly identical human microphysiological vascularized tissue arrays. Lab Chip. 13 (15), 2990-2998 (2013).
- Moya, M. L., Hsu, Y. H., Lee, A. P., Christopher, C. W. H., George, S. C. In vitro perfused human capillary networks. Tissue Eng - Part C: Methods. 19 (9), 730-737 (2013).
- Wang, X., et al. An on-chip microfluidic pressure regulator that facilitates reproducible loading of cells and hydrogels into microphysiological system platforms. Lab Chip. 16 (5), 868-876 (2016).
- Phan, D. T., et al. Blood-brain barrier-on-a-chip: Microphysiological systems that capture the complexity of the blood-central nervous system interface. Exp Biol Med. 242 (17), 1669-1678 (2017).
- Kurokawa, Y. K., et al. Human induced pluripotent stem cell-derived endothelial cells for three-dimensional microphysiological systems. Tissue Eng Part C: Methods. 23 (8), 474-484 (2017).
- Romero-López, M., et al. Recapitulating the human tumor microenvironment: Colon tumor-derived extracellular matrix promotes angiogenesis and tumor cell growth. Biomaterials. 116, 118-129 (2017).
- Schindelin, J., et al. Fiji: an open-source platform for biological-image analysis. Nat Methods. 9 (7), 676-682 (2012).
- Carpenter, A. E., et al. CellProfiler: Image analysis software for identifying and quantifying cell phenotypes. Genome Biol. 7 (10), R100 (2006).
- Zudaire, E., Gambardella, L., Kurcz, C., Vermeren, S. A computational tool for quantitative analysis of vascular networks. PLoS one. 6 (11), e27385 (2011).
- Corliss, B. A., et al. REAVER: A program for improved analysis of high-resolution vascular network images. Microcirculation. 27 (5), e12618 (2020).
- Urban, G., et al. Deep learning for drug discovery and cancer research: Automated analysis of vascularization images. IEEE/ACM Trans Comput Biol Bioinform. 16 (3), 1029-1035 (2019).
재인쇄 및 허가
JoVE'article의 텍스트 или 그림을 다시 사용하시려면 허가 살펴보기
허가 살펴보기This article has been published
Video Coming Soon
Copyright © 2025 MyJoVE Corporation. 판권 소유