Aby wyświetlić tę treść, wymagana jest subskrypcja JoVE. Zaloguj się lub rozpocznij bezpłatny okres próbny.
Method Article
An In Vitro System to Study Tumor Dormancy and the Switch to Metastatic Growth
W tym Artykule
Podsumowanie
A modified 3-D in vitro system is presented in which growth characteristics of several tumor cell lines in reconstituted basement membrane correlate with the dormant or proliferative behavior of the tumor cells at a metastatic secondary site in vivo.
Streszczenie
Recurrence of breast cancer often follows a long latent period in which there are no signs of cancer, and metastases may not become clinically apparent until many years after removal of the primary tumor and adjuvant therapy. A likely explanation of this phenomenon is that tumor cells have seeded metastatic sites, are resistant to conventional therapies, and remain dormant for long periods of time 1-4.
The existence of dormant cancer cells at secondary sites has been described previously as quiescent solitary cells that neither proliferate nor undergo apoptosis 5-7. Moreover, these solitary cells has been shown to disseminate from the primary tumor at an early stage of disease progression 8-10 and reside growth-arrested in the patients' bone marrow, blood and lymph nodes 1,4,11. Therefore, understanding mechanisms that regulate dormancy or the switch to a proliferative state is critical for discovering novel targets and interventions to prevent disease recurrence. However, unraveling the mechanisms regulating the switch from tumor dormancy to metastatic growth has been hampered by the lack of available model systems.
in vivo and ex vivo model systems to study metastatic progression of tumor cells have been described previously 1,12-14. However these model systems have not provided in real time and in a high throughput manner mechanistic insights into what triggers the emergence of solitary dormant tumor cells to proliferate as metastatic disease. We have recently developed a 3D in vitro system to model the in vivo growth characteristics of cells that exhibit either dormant (D2.OR, MCF7, K7M2-AS.46) or proliferative (D2A1, MDA-MB-231, K7M2) metastatic behavior in vivo . We demonstrated that tumor cells that exhibit dormancy in vivo at a metastatic site remain quiescent when cultured in a 3-dimension (3D) basement membrane extract (BME), whereas cells highly metastatic in vivo readily proliferate in 3D culture after variable, but relatively short periods of quiescence. Importantly by utilizing the 3D in vitro model system we demonstrated for the first time that the ECM composition plays an important role in regulating whether dormant tumor cells will switch to a proliferative state and have confirmed this in in vivo studies15-17. Hence, the model system described in this report provides an in vitro method to model tumor dormancy and study the transition to proliferative growth induced by the microenvironment.
Protokół
1. Cell culture maintenance of dormant and metastatic tumor cell lines
- Grow dormant (D2OR/ MCF7/K7M2-AS.46) and metastatic tumor cells (D2A1/ MDA-MB-231/ K7M2) in 10 cm culture plates containing Dulbecco's Modified Eagle's Medium (DMEM) high glucose and 10% Fetal bovine serum (FBS) and antibiotics. Once the cells reach 70-80% confluence, proceed to the following assays.
2. Cell proliferation assay of dormant (quiescent) and metastatic (proliferating) tumor cells cultured in a 3D-BME system
Culturing dormant/metastatic cells in the 3D system
- Thaw Cultrex growth factor-reduced Basement Membrane Extract (BME) in 4°C refrigerator a night before carrying out the assay. Note the BME should be handled on ice at all times.
- On the following day, place a 96 well plate on a tray of ice inside a laminar hood. Coat each well with 50-100μl of ice cold BME using a dispenser with a syringe. Make sure no bubbles are formed in the wells. Place the 96 well plate coated with BME in a humidified incubator with 5% CO2 at 37°C for 30 minutes.
- In the meantime aspirate the media from the dormant and or metastatic tumor cells (prepared in section 1). Rinse culture plates with 10 ml phosphate buffered saline, ph 7.4 (PBS). Aspirate the PBS and add 2ml trypsin pre-warmed at 37°C, to the culture plates. Incubate the plates in a humidified 5% CO2 at 37°C, for 5 min.
- Transfer cells to a 15 ml conical tube containing 5ml of DMEM high glucose supplemented with 10% FCS and antibiotics and count the cells.
- Spin down the total cell number to be cultured in a tissue culture centrifuge at a speed of 1500g, at room temperature for 5 min. In our assays we prepare 2X10³ cells /well for each cell line or time point to be examined. However, this may vary depending upon the cell lines used.
- Carefully aspirate the supernatant. Note, in most cases the pellet is not visible. Therefore, leave some media behind. Tap the bottom of the 15ml conical tube with your fingers to ensure that a suspension of single cells is obtained. Re-suspend the pellet with DMEM low glucose with antibiotics supplemented with 2% FCS + 2% BME (assay media). 100 μl of the assay media should be added for every 2x10³ cells. Triturate the cells many times with a 5ml pipette to ensure that a single cell suspension is maintained.
- Plate a 100μl of the cell mixture per well on top of the 96 well BME coated plate. For background evaluation (in section 2.8) plate in addition 100μl per well of only the assay media on top of the 96 well BME coated plate. Incubate the cultured 96 well plates in a humidified 5% CO2 incubator at 37°C. Cells should be re-fed every 4 days with the assay media.
Proliferation assay:
- Proliferation assay of the cells: add to the wells at the desired time points 20 μl of the Cell Titer 96 AQueous One Solution Cell Proliferation assay kit. Incubate in a humidified 5% CO2 incubator at 37°C for 2h. Using an Elisa Plate Reader record the absorbance at 490nm. For background evaluation and subtraction, add 20μl of the Cell Titer 96 AQueous One Solution Cell Proliferation assay kit to wells pre coated with BME and only overlaid with assay media. Using an Elisa Plate Reader record the absorbance at 490 nm.
3. Immunofluorescent staining for cell signaling molecules in dormant (quiescent) tumor cells and/or metastatic (proliferating) tumor cells
Culturing dormant/metastatic cells in the 3D system for immunfluorescence staining
*The following protocol is a modification of a 3D culture protocol published by Debnath J et al 18.
- Prepare BME as described in section 2.1. The following day: place an 8-chamber glass slide system on a tray of ice inside a laminar hood. Coat each well with 50ul of ice-cold BME using a 200μl pipetman. Make sure BME is spread evenly and no bubbles are formed in the wells. Place the 8 chamber glass slide coated with BME in a humidified 5% CO2 at 37°C for 20 min.
- Harvest dormant and or metastatic cells from section 1 and prepare to culture as described in section 2.3- 2.4. Collect the total number of cells to be cultured in a 15 ml conical tube. We prepare 5 x10³ cells / well for each cell line and time point to be examined. Spin down the cells in a tissue culture centrifuge at a speed of 1500g, at room temperature for 5 min. Aspirate the supernate carefully. Note that the pellet is not visible; therefore leave some media behind. Tap the bottom of the 15ml conical tube with your fingers to ensure that a single cell suspension is obtained. Re-suspend the pellet with assay media. 400μl of the assay media should be added for every 5x10³ cells. Triturate the cells many times with 5ml pipette. This step is very important to ensure that the single cell suspension is maintained.
- Plate 400μl of the cell mixture per well on top of each of the 8 chambers coated with BME. Incubate the cultured 8 chambers glass slide system in a humidified 5% CO2 incubator at 37°C. Cells should be re-fed every 4 days with the assay media.
Immunofluorescence staining:
- At the desired time points, aspirate the upper layer of the media and add 200μl of the fixative containing 4% Paraformaldehyde (PFA), 5% sucrose and 0.1% Triton X-100 and incubate at room temperature for 5 minutes. Aspirate the fixative and add 200μl of 4% PFA containing 5% sucrose and incubate at room temperature for 25 minutes.
- Aspirate the fixative; add 400 μl of phosphate buffered saline (PBS) to each well. Incubate for 10 minutes at room temperature. Aspirate the PBS and add 400 μ PBS containing 0.05% Tween 20 for 10 minutes at room temperature.
- Block the fixed cells at room temperature with 200μl of either 10% donkey serum or with 3% BSA for 1hour (blocking solution to be used should be determined empirically for each primary antibody).
- Aspirate the blocking solution and add 200μl of the primary antibody (dilution should be determined empirically for each primary antibody to be used). Dilute the primary antibody in 10% donkey serum if 10% donkey serum was used for blocking or dilute primary antibody in 3% BSA if 3% BSA blocking solution was used. Incubate with the primary antibody overnight at 4°C.
- Aspirate the antibody, wash the wells with 400μl PBS for 15 minutes and repeat twice. Aspirate the PBS and add 200μl of donkey anti-respective- IgG conjugated to rhodamine red (dilution should be determined empirically), cover the 8 chamber slide with aluminum foil and incubate for 1 hour at room temperature.
- Wash the wells with 400μl PBS (3x15 minutes each wash). Aspirate PBS. Mounted with VECTASHIELD mounting medium with DAPI. Dry slides for 40 minutes at room temperature in the dark. Slides can be kept for 1 week at 4°C. Store the slides in the dark. Image slides by Confocal microscopy.
4. Representative Results:
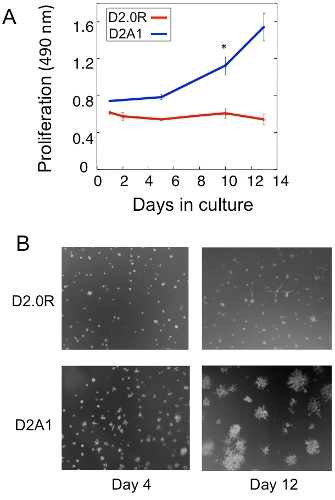
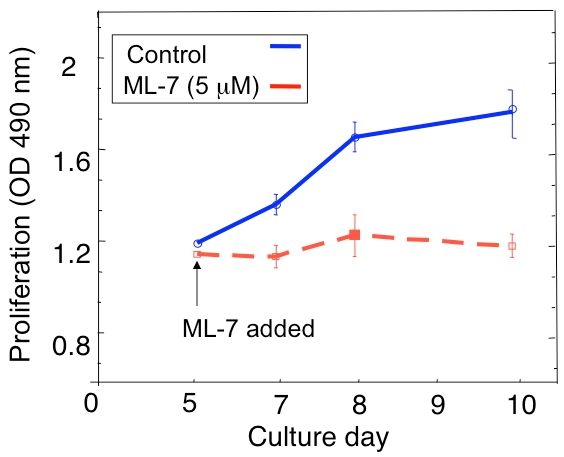
An example of a proliferation analysis of the dormant D2.0R and metastatic D2A1 tumor cells in the 3D culture is shown in Figure 1A. D2.0R cells are dormant (quiescent) through the entire experimental 14 day culture period whereas the highly metastatic D2A1 cells remain dormant only for four to six days after which they begin to proliferate. During the initial dormant phase, many cells remain solitary in the 3-D culture (Figure 1B; day 4) whereas other non-proliferating cells form multi-cellular spheroids. The transition of D2A1 cells from a dormant to proliferative state in 3-D culture (Figure 1B; day 12) is associated with dramatic changes in cell morphology. Hence, this assay can be used to test what factor/s may trigger dormant D2.0R cells to emerge from their dormant state and what factor/s may prevent D2A1 cells to transition from their dormant state. Figure 2 is an example of an agent preventing D2A1 cells to transition from dormant to a proliferative state. As illustrated in Figure 2, treatments of D2A1 cells with a specific inhibitor of myosin light chain kinase (ML- 7) maintained D2A1 cells in a dormant state.
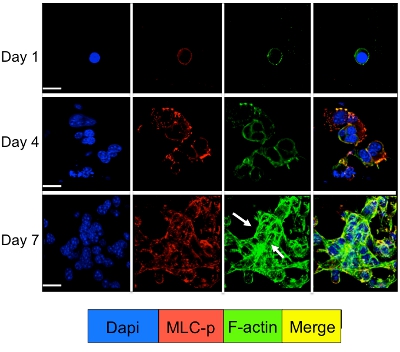
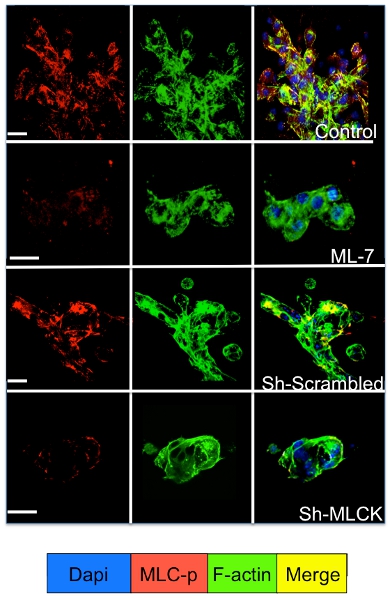
Cell signaling in the dormant and proliferating tumor cells cultured in the 3D system can be studied by immunofluorescence staining for cell signaling molecules. As illustrated in Figure 3 a significant increase in myosin light chain phosphorylation in D2A1 cells (red staining) followed by reorganization of the f-actin filaments forming actin stress fibers (green staining) occurs during their transition from dormancy (1-4 days) to proliferation (day 7). However, blocking myosin light chain kinase activity in D2A1 cells by shRNA or specific drug (ML-7) retains D2A1 cells in a dormant state and results in inhibition of myosin light chain phosphorylation and f-actin stress fiber organization (Figure 4).

Figure 1. in vitro model to study solitary tumor cell dormancy and the switch to metastatic growth. A) Proliferation of dormant D2.0R and metastatic D2A1 in 3-D Cultrex BME, n=8 (mean ± SE). Representative results of three experiments (* p≤0.05). B) Light microscopy images of D2.0R and D2A1 cells cultured in 3-D Cultrex BME magnification x20. Figure modified from Barkan et al 17.

Figure 2. Preventing the switch of D2A1 cells from dormancy (quiescence) to proliferation in the 3D culture system by inhibition of myosin light chain kinase (MLCK). Time course of D2A1 cell proliferation cultured in 3-D Cultrex BME , n=8 (mean ±SE). Cells were untreated (control), or treated with a specific inhibitor of MLCK (ML-7; 5 μM) for 48 hr beginning on culture day 5. Figure modified from Barkan et al 17.

Figure 3. Myosin light chain phosphorylation followed by f-actin reorganization during the switch of D2A1 cells from dormancy to proliferative growth. D2A1 cells were cultured in 3-D Cultrex BME on 8 chamber glass slide. Cells were fixed and stained with DAPI (blue) for nuclear localization, phalloidin (green) for f-actin and with an antibody against the phosphorylated form of myosin light chain (MLC-p) (red), as indicated at various time points. Merge of f-actin, and MLC-p staining (yellow). Expression of MLC-p was increased during the transition of D2A1 cells from dormancy (days1-4) to proliferative growth (day 7) followed by actin stress fiber formation (arrows). Confocal microscopy, magnification x63. White bar equals 20 microns. Figure modified from Barkan et al 17.

Figure 4. Inhibition of myosin light chain kinase (MLCK) mediated f-actin stress fiber formation in D2A1 cells. D2A1 Cells were untreated (control), or treated with inhibitor for MLCK (ML-7; 5 μM), for 48 hr beginning on culture day 5, or treated with scrambled or MLCK shRNA and stained for the phosphorylated form of myosin light chain (MLC-p) (red), f- actin (green), and nuclei (blue). Merge of f-actin, and MLC-p staining (yellow). Confocal microscopy, magnification x63. White bar equals 20 microns.
Dyskusje
The underlying mechanisms that maintain disseminated tumor cells in a dormant state or result in their transition to metastatic growth remain largely unknown. This phenomenon has been extremely difficult to study in human patients 4,12 and few preclinical models have been developed to address this issue. Nevertheless, some in vivo and ex-vivo model systems for tumor dormancy have been characterized (reviewed in 1,12). However, the in vivo models for tumor dormancy can p...
Ujawnienia
No conflicts of interest declared.
Podziękowania
This research was supported in part by the Intramural Research Program of the National Cancer Institute.
Materiały
| Name | Company | Catalog Number | Comments |
| DMEM high glucose | Invitrogen | 11965-118 | |
| DMEM low glucose | Invitrogen | 11885-092 | |
| Fetal bovine serum (FBS) | Invitrogen | 10091-148 | |
| Growth factor-reduced 3-D Cultrex Basement Membrane Extract | Trevigen Inc. | Protein concentration between 14-15mg/ml | |
| D2.0R and D2A1 cell lines | 5,19 | ||
| K7M2 and K7M2AS1.46 cells | 20 | ||
| MCF-7 and MDA-MB-231 breast cancer cells | ATCC | ||
| An 8 chamber glass slide system | Lab-Tek | 177402 | |
| Cell Titer 96 AQueous One Solution cell proliferation assay kit | Promega Corp. | G3580 | |
| VECTASHIELD mounting medium with DAPI | Vector Laboratories | H-1200 | |
| Normal donkey serum | Jackson ImmunoResearch | 017-000-121 | |
| Elisa Plate Reader | Bio-Tec | Record 490nm | |
| Confocal microscope | Carl Zeiss, Inc. | Magnification x63 |
Odniesienia
- Aguirre-Ghiso, J. A. Models, mechanisms and clinical evidence for cancer dormancy. Nat Rev Cancer. 7, 834-846 (2007).
- Pantel, K., Woelfle, U. Micrometastasis in breast cancer and other solid tumors. J Biol Regul Homeost Agents. 18, 120-125 (2004).
- Naumov, G. N. Ineffectiveness of doxorubicin treatment on solitary dormant mammary carcinoma cells or late-developing metastases. Breast Cancer Res Treat. 82, 199-206 (2003).
- Klein, C. A. Framework models of tumor dormancy from patient-derived observations. Curr Opin Genet Dev. , (2010).
- Naumov, G. N. Persistence of solitary mammary carcinoma cells in a secondary site: a possible contributor to dormancy. Cancer Res. 62, 2162-2168 (2002).
- Townson, J. L., Chambers, A. F. Dormancy of solitary metastatic cells. Cell Cycle. 5, 1744-1750 (2006).
- Chambers, A. F., Groom, A. C., MacDonald, I. C. Dissemination and growth of cancer cells in metastatic sites. Nat Rev Cancer. 2, 563-572 (2002).
- Pantel, K. Differential expression of proliferation-associated molecules in individual micrometastatic carcinoma cells. J Natl Cancer Inst. 85, 1419-1424 (1993).
- Demicheli, R. Tumour dormancy: findings and hypotheses from clinical research on breast cancer. Semin Cancer Biol. 11, 297-306 (2001).
- Braun, S. A pooled analysis of bone marrow micrometastasis in breast cancer. N Engl J Med. 353, 793-802 (2005).
- Pantel, K., Alix-Panabieres, C., Riethdorf, S. Cancer micrometastases. Nat Rev Clin Oncol. 6, 339-351 (2009).
- Goss, P. E., Chambers, A. F. Does tumour dormancy offer a therapeutic target. Nat Rev Cancer. 10, 871-877 (2010).
- Mendoza, A. Modeling metastasis biology and therapy in real time in the mouse lung. J Clin Invest. 120, 2979-2988 (2010).
- Naumov, G. N. A model of human tumor dormancy: an angiogenic switch from the nonangiogenic phenotype. J Natl Cancer Inst. 98, 316-325 (2006).
- Barkan, D. Metastatic growth from dormant cells induced by a col-I-enriched fibrotic environment. Cancer Res. 70, 5706-5716 (2010).
- Barkan, D., Green, J. E., Chambers, A. F. Extracellular matrix: A gatekeeper in the transition from dormancy to metastatic growth. Eur J Cancer. , (2010).
- Barkan, D. Inhibition of metastatic outgrowth from single dormant tumor cells by targeting the cytoskeleton. Cancer Res. 68, 6241-6250 (2008).
- Debnath, J., Muthuswamy, S. K., Brugge, J. S. Morphogenesis and oncogenesis of MCF-10A mammary epithelial acini grown in three-dimensional basement membrane cultures. Methods. 30, 256-268 (2003).
- Morris, V. L. Mammary carcinoma cell lines of high and low metastatic potential differ not in extravasation but in subsequent migration and growth. Clin Exp Metastasis. 12, 357-367 (1994).
- Khanna, C. The membrane-cytoskeleton linker ezrin is necessary for osteosarcoma metastasis. Nat Med. 10, 182-186 (2004).
Przedruki i uprawnienia
Zapytaj o uprawnienia na użycie tekstu lub obrazów z tego artykułu JoVE
Zapytaj o uprawnieniaPrzeglądaj więcej artyków
This article has been published
Video Coming Soon
Copyright © 2025 MyJoVE Corporation. Wszelkie prawa zastrzeżone