
Aby wyświetlić tę treść, wymagana jest subskrypcja JoVE. Zaloguj się lub rozpocznij bezpłatny okres próbny.
Method Article
An Analytical Tool that Quantifies Cellular Morphology Changes from Three-dimensional Fluorescence Images
W tym Artykule
Podsumowanie
We developed a software platform that utilizes Imaris Neuroscience, ImarisXT and MATLAB to measure the changes in morphology of an undefined shape taken from three-dimensional confocal fluorescence of single cells. This novel approach can be used to quantify changes in cell shape following receptor activation and therefore represents a possible additional tool for drug discovery.
Streszczenie
The most common software analysis tools available for measuring fluorescence images are for two-dimensional (2D) data that rely on manual settings for inclusion and exclusion of data points, and computer-aided pattern recognition to support the interpretation and findings of the analysis. It has become increasingly important to be able to measure fluorescence images constructed from three-dimensional (3D) datasets in order to be able to capture the complexity of cellular dynamics and understand the basis of cellular plasticity within biological systems. Sophisticated microscopy instruments have permitted the visualization of 3D fluorescence images through the acquisition of multispectral fluorescence images and powerful analytical software that reconstructs the images from confocal stacks that then provide a 3D representation of the collected 2D images. Advanced design-based stereology methods have progressed from the approximation and assumptions of the original model-based stereology1 even in complex tissue sections2. Despite these scientific advances in microscopy, a need remains for an automated analytic method that fully exploits the intrinsic 3D data to allow for the analysis and quantification of the complex changes in cell morphology, protein localization and receptor trafficking.
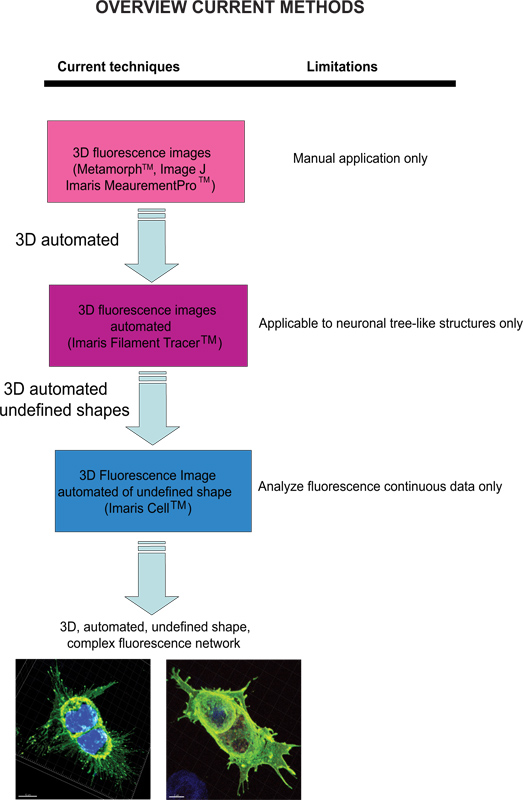
Current techniques available to quantify fluorescence images include Meta-Morph (Molecular Devices, Sunnyvale, CA) and Image J (NIH) which provide manual analysis. Imaris (Andor Technology, Belfast, Northern Ireland) software provides the feature MeasurementPro, which allows the manual creation of measurement points that can be placed in a volume image or drawn on a series of 2D slices to create a 3D object. This method is useful for single-click point measurements to measure a line distance between two objects or to create a polygon that encloses a region of interest, but it is difficult to apply to complex cellular network structures. Filament Tracer (Andor) allows automatic detection of the 3D neuronal filament-like however, this module has been developed to measure defined structures such as neurons, which are comprised of dendrites, axons and spines (tree-like structure). This module has been ingeniously utilized to make morphological measurements to non-neuronal cells3, however, the output data provide information of an extended cellular network by using a software that depends on a defined cell shape rather than being an amorphous-shaped cellular model. To overcome the issue of analyzing amorphous-shaped cells and making the software more suitable to a biological application, Imaris developed Imaris Cell. This was a scientific project with the Eidgenössische Technische Hochschule, which has been developed to calculate the relationship between cells and organelles. While the software enables the detection of biological constraints, by forcing one nucleus per cell and using cell membranes to segment cells, it cannot be utilized to analyze fluorescence data that are not continuous because ideally it builds cell surface without void spaces. To our knowledge, at present no user-modifiable automated approach that provides morphometric information from 3D fluorescence images has been developed that achieves cellular spatial information of an undefined shape (Figure 1).
We have developed an analytical platform using the Imaris core software module and Imaris XT interfaced to MATLAB (Mat Works, Inc.). These tools allow the 3D measurement of cells without a pre-defined shape and with inconsistent fluorescence network components. Furthermore, this method will allow researchers who have extended expertise in biological systems, but not familiarity to computer applications, to perform quantification of morphological changes in cell dynamics.
Protokół
1. Three-dimensional Morphometric Analysis of Single-cell Phenotypic Changes
- Human embryonic Kidney (HEK293) cells were transfected with hemagglutinin (HA)-tagged corticotropin releasing factor receptor-2 (CRF-R2), a G protein-coupled receptor (GPCR) as described previously4, 5.
- The cells were left untreated (no treatment, NT), stimulated with the CRF-R2 endogenous ligand, corticotropin releasing factor, CRF (1 μM, 30 min), or pretreated with a selective CRF-R2 antagonist, anti-sauvagine 30 (AS-30, 1 μM, 30 min) prior to agonist treatment.
- The cells were then fixed, permeabilized and treated with anti-HA. CRF-R2 was visualized using Alexa 594 nm conjugate anti-mouse (IgG1) antibody. DAPI was used to visualize the nuclei mitotic stage.
- To limit the experimenter subjectivity, the experimental conditions were not known until after the images were acquired and analyzed.
- We acquired images from fixed HEK293 cells using a Plan-apochromat 63x/1.4 oil DIC objective and Zeiss LSM 510 META confocal microscope connected to a Coherent integrated two-photon laser system comprised of a Verdi-V5 laser and a Mira 900-F laser system.
- During the data acquisition process, the cells were compartmentalized both by multispectral sectioning, 488 nm, and 790 nm (~350 nm 2ph Ex.) and z-partitioning (0.5 μm increments) to include data from the nuclear membrane to the outer extracellular receptor extremities.
- The fluorescence data were first processed using Imaris, which allows the visualization and segmentation of 3D microscopy dataset, and a 3D model composed of cubic voxels was created for morphometric analysis.
Then, Imaris XT module was utilized to interface Imaris with MATLAB computer program language to determine the spot coordinates of the GPCR extensions.
To take into account cellular variability, we obtained and analyzed fluorescence images taken from 22 cells: no treatment (NT) (n = 7), agonist (CRF) treatment (n = 8) and pre-treatment with antagonist (AS-30) prior to agonist treatment (n = 7) (Figure 2).- The region of Interest (ROI) should include one cell that is not in active mitotic stage and not close to other cells. In this manner, the analysis will include cells with only one nucleus and the receptor extensions are not perturbed by proximity of other cells.
- The cellular 3D structure was first reconstructed from multispectral fluorescence data using Imaris (v.7.1.1).
- Following the algorithm designed by Imaris, first the Surface rendering was utilized to represent the nuclear membrane. Imaris will determine if there is more than one nucleus in the ROI.
- Then the spots-creation algorithm was utilized to locate the CRF-R2 extension. Spots detection was utilized because it compensates for background noise and irregular intensity of the complex network of amorphous-shaped cells.
- To maximize the inclusion of each unit of fluorescence detection of CRF-R2, the spots' diameter was set to 0.2 μm, which is the smallest unit within the image to extrapolate distinct information in the form of a measured intensity using a Gaussian filter. Spot filtering was incorporated in the spots automated creation process. The software, however, gives the user the flexibility to use filters to define the parameters.
- To avoid data truncation, the data set was converted from 8-bit (unsigned) fixed point, to 32-bit decimal.
- The voxel intensities data were exchanged to spot coordinates data using Imaris XT module interfaced with MATLAB and the exact spatial location of each spot was determined by performing a distance transformation using the nuclear membrane as a reference point (Figure 3).
- The resulting data can be quantified and presented in graphical format for statistical analysis. Comparisons between groups were performed using Two-way ANOVA and Bonferroni posttest. Data are presented as mean ± SD. Differences are considered significant at *p < 0.05. Calculations were made with GraphPad Prism 5.02 (Figure 4).
2. Representative Results
To demonstrate the power of our approach, we quantified the cellular changes that result from the interaction of G protein-coupled receptors (GPCRs) and corticotropin releasing factor receptor-2 (CRF-R2) with its endogenous ligand CRF in transfected HEK293 cells.
We show that CRF-R2 receptors are located in the plasma membrane and project from finite regions of the membrane of the cells (Figure 2A and Movie 1). Using conventional 2D analysis, it is possible to detect this subset of extracellular CRF-R2 receptors only if we analyze the receptor adhesion points on the glass covers. Consequently we lose any other information derived from z-stacked multispectral data (Figure 5).
When the cells are treated with CRF, the extracellular receptors are greatly reduced, as shown by the decrease in distance of the spots from the plasma membrane. They are also redistributed from primarily finite locations into a number of discrete locations (Figure 2B and Movie 2).
The effect of CRF on receptor membrane distribution is prevented by pretreatment with the CRF-R2 specific antagonist, antisavagine 30 (AS-30) and we find that the CRF-R2 extensions do not change (Figure 2C and Movie 3).
The distal distribution of spots, plotted in the 5 μm spectrum-color coded intervals, is utilized to visualize the distance of the voxels from the nuclear membrane. No treatment and antagonist pretreatment (AS-30, 1 μM, 30 min) before agonist treatment (CRF, 1 μM, 30 min) show no significant (n.s.) difference in GPCR contraction. Treatment of the cells with the agonist (CRF, 1 μM, 30 min) progressively reduces the number of CRF-R2-containing voxels when compared to no treatment, 0-5 μm (n.s.), 6-15 μm (**p<0.01) and >15 μm (***p< 0.005), or compared to AS-30 treatment, 0-10 μm (n.s.), 11-15 μm (**p<0.01) and >15 μm (***p< 0.005) (Figure 4).

Figure 1 . Diagram of the current available techniques and their limitation to analyze fluorescence images. Click here to view larger figure.

Figure 2. 3D multispectral fluorescence images of HEK293 transfected cells with HA-CRF-R2 before and after agonist and antagonist treatment. Merged images showing HA-CRF-R2-probed using anti-HA and visualized using Alexa 488 conjugated anti-mouse (IgG1) secondary antibody; DAPI was used to visualize the nuclei. The images were acquired with confocal laser scanning (CLS) microscope. Scale bar 5 μm.

Figure 3. 3D model of HEK293 transfected cells with HA-CRF-R2 reconstructed from CLS images using Imaris software. Surface rendering of the nucleus and spots creation describing GPCR extensions converted to small vesicles. The fluorescence data were first processed using Imaris which allows the visualization and segmentation of 3D microscopy data set. Then, Imaris XT was utilized to interface Imaris with MATLAB. The voxel intensities were exchanged into spot coordinates. The spots spectrum-coded color (blue 0-5 μm, green, 6-10 μm, yellow 11-15 μm and red >15 μm) represent the distance form the nuclear membrane. Scale 5 μm.

Figure 4. Graphic representation of the distal distribution of spots plotted in the spectrum-color coded in 5 μm intervals is utilized to visualize the distance of the voxels from the nuclear membrane. No treatment and pretreatment with an antagonist (AS-30, 1 μM, 30 min) before agonist treatment (CRF, 1 μM, 30 min) show no significant (n.s.) difference in GPCR contraction. Treatment of the cells with agonist (CRF, 1 μM, 30 min) progressively reduces the distance of the number of CRF-R2-containing voxels when compared to no treatment 0-5 μm (n.s.), 6-15 μm (**p<0.01) and >15 μm (***p< 0.005); or AS-30 treatment 0-10 μm (n.s.), 11-15 μm (**p<0.01) and >15 μm (***p< 0.005).

Figure 5. Limitation of the 2D morphometric analysis of HEK 293 transfected cells with HA-CRF-R2. The mid-plane section of cells (3-4μm above the glass coverslip) showing the center of the nuclei visualized with DAPI and HA-CRF-R2 probed using anti-HA and visualized using Alexa 488nm conjugated anti-mouse (IgG1) secondary antibody and acquired with CLS shows no difference between (A) no treatment (NT) and (B) agonist (CRF, 1 μM, 30 min), while the receptor adhesion points are dramatically different.
Movie 1. Freely rotating 3D model in the "Surpass" mode of HEK 293 transfected cells with HA-CRF-R2, no treatment, to evaluate cellular phenotype differences among receptor proteins. Scale bar from 5 to 20 μm. Click here to view movie.
Movie 2. Freely rotating 3D model in the "Surpass" mode of HEK 293 transfected cells with HA-CRF-R2, agonist treatment, CRF (CRF, 1 μM, 30 min) to evaluate cellular phenotype differences among receptor proteins. Scale bar from 5 to 20 μm. Click here to view movie.
Movie 3. Freely rotating 3D in the "Surpass" mode of HEK 293 transfected cells with HA-CRF-R2, pretreatment with an antagonist (AS-30, 1 μM, 30 min) before agonist treatment (CRF, 1 μM, 30 min) to evaluate cellular phenotype differences among receptor proteins. Scale bar from 5 to 20 μm. Click here to view movie.
Dyskusje
We showed that CRF treatment induced a significant change in the morphology and location of CRF-R2. The change in CRF-R2 was inhibited by selective antagonist treatment. We showed that receptor modifications were not detected and cannot be measured using the standard 2D multispectral techniques. The ability to study complex 3D images is critical to incorporate the complexity of biological parameters for morphometric analysis. We were able to make 3D measurements of cells without a pre-defined shape with inconsistent fluo...
Ujawnienia
No conflicts of interest declared.
Podziękowania
We thank the Biological Imaging Development Center (BIDC) University of California, San Francisco for the use of the Imaris, Imaris XT and Matlab. We thank V. Kharazia for the technical assistance and A.T. Henry, L.K. Floren, L. Daitch for their contributions to the editing of the manuscript. This work was supported by funding from the State of California Medical Research on Alcohol & Substance Abuse through UCSF to SEB, the National Institutes of Health: 1R21DA029966-01 and NIH Fast Track award to screen the MLSMR collection to SEB, UCSF School of Pharmacy (Dean's Office and Clinical Pharmacy) and the School of Medicine (Clinical Pharmacology & Experimental Therapeutics) to CLHK.
Materiały
| Name | Company | Catalog Number | Comments |
| Human Embryonic Kidney (HEK293) | American Type Culture Collection | CRL-1573 | |
| Dulbecco's Modified Eagle Medium (DMEM) | Invitrogen | 11965118 | |
| Fetal Bovine Serum (FBS) | Invitrogen | SH30070.03 | |
| AlexaFluor-488 (IgG2b) | Invitrogen | A-11001 | |
| monoclonal anti-HA.11 (IgG1) | Covance | 16B12 | |
| DAPI | Vector Laboratories | H-1200 | |
| CRF | Sigma | C2917 | |
| Antisauvagine-30 (AS-30) | Sigma | A4727 |
Odniesienia
- West, M. J. Design-based stereological methods for counting neurons. Prog, Brain Res. 135, 43-51 (2002).
- Burke, M., Zangenehpour, S., Mouton, P. R., Ptito, M. Knowing what counts: unbiased stereology in the non-human primate brain. J. Vis. Exp. (27), e1262 (2009).
- Sugawara, Y., Ando, R., Kamioka, H., Ishihara, Y., Honjo, T., Kawanabe, N., Kurosaka, H., Takano-Yamamoto, T., Yamashiro, T. The three-dimensional morphometry and cell-cell communication of the osteocyte network in chick and mouse embryonic calvaria. Calcif. Tissue Int. 88, 416-424 (2011).
- Vickery, R. G., von Zastrow, M. Distinct dynamin-dependent and -independent mechanisms target structurally homologous dopamine receptors to different endocytic membranes. J. Cell Biol. 144, 31-43 (1999).
- Bartlett, S. E., Enquist, J., Hopf, F. W., Lee, J. H., Gladher, F., Kharazia, V., Waldhoer, M., Mailliard, W. S., Armstrong, R., Bonci, A. Dopamine responsiveness is regulated by targeted sorting of D2 receptors. Pro.c Natl. Acad. Sci. U.S.A. 102, 11521-11526 (2005).
- Gordon, A., Colman-Lerner, A., Chin, T. E., Benjamin, K. R., Yu, R. C., Brent, R. Single-cell quantification of molecules and rates using open-source microscope-based cytometry. Nat. Methods. 4, 175-181 (2007).
- Schock, F., Perrimon, N. Molecular mechanisms of epithelial morphogenesis. Annu. Rev. Cell Dev. Biol. 18, 463-493 (2002).
- Pincus, Z., Theriot, J. A. Comparison of quantitative methods for cell-shape analysis. J. Microsc. 227, 140-156 (2007).
- Spiller, D. G., Wood, C. D., Rand, D. A., White, M. R. Measurement of single-cell dynamics. Nature. 465, 736-745 (2010).
- Loo, L. H., Wu, L. F., Altschuler, S. J. Image-based multivariate profiling of drug responses from single cells. Nat Methods. 4, 445-453 (2007).
- Yarrow, J. C., Totsukawa, G., Charras, G. T., Mitchison, T. J. Screening for cell migration inhibitors via automated microscopy reveals a Rho-kinase inhibitor. Chem. Biol. 12, 385-395 (2005).
Przedruki i uprawnienia
Zapytaj o uprawnienia na użycie tekstu lub obrazów z tego artykułu JoVE
Zapytaj o uprawnieniaPrzeglądaj więcej artyków
This article has been published
Video Coming Soon
Copyright © 2025 MyJoVE Corporation. Wszelkie prawa zastrzeżone