
Aby wyświetlić tę treść, wymagana jest subskrypcja JoVE. Zaloguj się lub rozpocznij bezpłatny okres próbny.
Method Article
RNA Secondary Structure Prediction Using High-throughput SHAPE
* Wspomniani autorzy wnieśli do projektu równy wkład.
W tym Artykule
Podsumowanie
High-throughput selective 2' hydroxyl acylation analyzed by primer extension (SHAPE) utilizes a novel chemical probing technology, reverse transcription, capillary electrophoresis and secondary structure prediction software to determine the structures of RNAs from several hundred to several thousand nucleotides at single nucleotide resolution.
Streszczenie
Understanding the function of RNA involved in biological processes requires a thorough knowledge of RNA structure. Toward this end, the methodology dubbed "high-throughput selective 2' hydroxyl acylation analyzed by primer extension", or SHAPE, allows prediction of RNA secondary structure with single nucleotide resolution. This approach utilizes chemical probing agents that preferentially acylate single stranded or flexible regions of RNA in aqueous solution. Sites of chemical modification are detected by reverse transcription of the modified RNA, and the products of this reaction are fractionated by automated capillary electrophoresis (CE). Since reverse transcriptase pauses at those RNA nucleotides modified by the SHAPE reagents, the resulting cDNA library indirectly maps those ribonucleotides that are single stranded in the context of the folded RNA. Using ShapeFinder software, the electropherograms produced by automated CE are processed and converted into nucleotide reactivity tables that are themselves converted into pseudo-energy constraints used in the RNAStructure (v5.3) prediction algorithm. The two-dimensional RNA structures obtained by combining SHAPE probing with in silico RNA secondary structure prediction have been found to be far more accurate than structures obtained using either method alone.
Wprowadzenie
To understand the functions of catalytic and non-coding RNAs involved in regulation of splicing, translation, virus replication and cancer, a detailed knowledge of RNA structure is required1,2. Unfortunately, accurate prediction of RNA folding presents a formidable challenge. Classical probing agents suffer from many disadvantages such as toxicity, incomplete nucleotide coverage and/or throughput limited to 100-150 nucleotides per experiment. Unaided secondary structure prediction algorithms are similarly disadvantageous, owing to inaccuracies resulting from their inability to effectively distinguish among energetically similar structures. Large RNAs in particular are also often refractory to methods of 3D structure determination such as X-ray crystallography and nuclear magnetic resonance (NMR) spectroscopy, due to their conformational flexibility and large quantities of highly pure samples required for these techniques.
High-throughput SHAPE solves many of these problems by providing an effective, simple approach to probing the structures of large RNAs at single-nucleotide resolution. Moreover, the reagents used for SHAPE are safe, easy to handle and, in contrast to most other chemical probing reagents, react with all four ribonucleotides. These reagents can also penetrate cellular membranes, making it possible to probe RNAs in their in vivo context(s)3. Originally developed in the Weeks laboratory4, SHAPE has been used to analyze a wide variety of RNAs, the most notable example being determination of the complete secondary structure of the ~9 kb HIV-1 RNA genome5. Other notable achievements using SHAPE include elucidation of the structures of infectious viroids6, human long non-coding RNAs7, yeast ribosomes8, and riboswitches9 as well as to identify protein binding sites in virion-associated HIV-1 RNA3. While the original and high-throughput variations of the SHAPE protocol have been published elsewhere10-12, the present work provides a detailed description of RNA secondary structure determination by high-throughput SHAPE using fluorescent oligonucleotides, the Beckman Coulter CEQ 8000 Genetic Analyzer, and SHAPEfinder and RNAStructure (v5.3) software. Previously unpublished technical details and troubleshooting advice are also included.
Variations of SHAPE
The essence of SHAPE and its variations is exposure of RNA in aqueous solution to electrophilic anhydrides that selectively acylate 2'-hydroxyl (2'-OH) ribose groups, producing bulky adducts at the sites of modification. This chemical reaction serves as a means of interrogating local RNA structural dynamics, as single-stranded nucleotides are more prone to adopt conformations conducive to electrophilic attack by these reagents, while base paired or architecturally constrained nucleotides are less or unreactive10. Sites of adduct formation are detected by reverse transcription initiating from fluorescently or radiolabeled primers hybridized to a specific site on the modified RNA (the "(+)" primer extension reaction). When reverse transcriptase (RT) fails to traverse the acylated ribonucleotides, a pool of cDNA products is produced whose lengths coincide with sites of modification. A control, "(-)" primer extension reaction utilizing RNA that has not been exposed to reagent is also performed so that premature termination of DNA synthesis (i.e. "stops") due to RNA structure, nonspecific RNA strand breakage, etc., may be distinguished from pausing produced by chemical modification. Finally, two dideoxy-sequencing reactions initiating from the same primers are used as markers to correlate reactive nucleotides with the RNA primary sequence following electrophoresis.
In the original application of SHAPE, the same 32P-end-labeled primer is utilized for the (+), (-), and two sequencing reactions. Products of these reactions are loaded into adjacent wells in a 5-8% polyacrylamide slab gel, and fractionated by denaturing polyacrylamide gel electrophoresis (PAGE; Figure 1). Quantitative analysis of the gel images produced by conventional SHAPE can be performed using SAFA, a semi-automated footprinting analysis software13.
In contrast, high-throughput SHAPE employs fluorescently labeled primers and automated capillary electrophoresis. Specifically, for each region of RNA under investigation, a set of four DNA primers having a common sequence but different 5' fluorescent labels must be synthesized or purchased. These differently-labeled oligonucleotides serve to prime two SHAPE reactions and two sequencing reactions, the products of which are pooled and fractionated/detected by automated capillary electrophoresis (CE). Whereas the reactivity profile of 100-150 nt of RNA can be obtained from a set of four reactions using the original approach, high-throughput SHAPE allows resolution of 300-600 nt from a single pooled sample3. Up to 8 sets of reactions may be fractionated simultaneously, while as many as 96 samples can prepared for fractionation over the course of 12 consecutive CE runs (Figure 2). Moreover, the SHAPEfinder software, developed to process and analyze data emerging from the CEQ and other genetic analyzers, is more automated and require much less user intervention than SAFA13 or other gel-analysis packages.
More advanced high-throughput methodologies have recently emerged such as PARS (parallel analysis of RNA structure)14 and Frag-Seq (fragment-sequencing)15, which use structure-specific enzymes rather than alkylation reagents in conjunction with next generation sequencing techniques to obtain information about RNA structure. Despite the attractiveness of these techniques, the many limitations inherent to nuclease probing still remain16. These problems can be circumvented in the SHAPE sequencing (SHAPE-Seq)17 protocol, where next generation sequencing is preceded by chemical modification and reverse transcription of RNAs in a manner similar to that performed in conventional SHAPE. While these methods may represent the future of RNA structure determination, it is important to remember that next generation sequencing is very expensive, and remains unavailable to many laboratories.
SHAPE Data Analysis
Data produced in the genetic analyzer is presented in the form of an electropherogram, wherein the fluorescence intensity of the sample(s) flowing through the capillary detector is plotted against an index of migration time. This plot takes the form of overlapping traces corresponding to the four fluorescence channels used to detect the different fluorophores, and where each trace is comprised of peaks corresponding to individual cDNA or sequencing products. Electropherogram data is exported from the genetic analyzer as a tab-delimited text file and imported into ShapeFinder transformation and analysis software18.
ShapeFinder is initially used to perform a series of mathematical transformations on the data to ensure that migration times and peak volumes accurately reflect the identities and quantities of the reaction products, respectively. Peaks are then aligned and integrated, and the results tabulated together with the primary RNA sequence. A "reactivity profile" for the pertinent segment of RNA is obtained by subtracting control values from the (+) values associated with each RNA nucleotide, and normalizing the data as described below. This profile is imported into RNAstructure (v5.3) software19,20 , which converts the normalized reactivity values into pseudo-energy constraints that are incorporated into the RNA secondary structure folding algorithm. Combining chemical probing and folding algorithms in this way significantly improves the accuracy of structure prediction compared to either method alone12,21. The output of RNAstructure (v5.3) includes images of the lowest energy RNA secondary structures color-coded with the SHAPE reactivity profile(s), as well as the same structures in textual dot-bracket notation. The latter may subsequently be exported to software dedicated to the graphical display of RNA secondary structure such as Varna22 and PseudoViewer23.

Figure 1. Flowchart of RNA structure determination via SHAPE4,10. (A) RNA may be obtained from biological samples or by in vitro transcription. (B) Depending on the source, RNA is folded or otherwise processed and modified with SHAPE reagent. (C) Reverse transcription using fluorescently or radioactively labeled primers. (D) cDNA products are fractionated via either capillary or slab gel-based electrophoresis. (E) Fragment analysis. (F) RNA structure prediction. Click here to view larger figure.
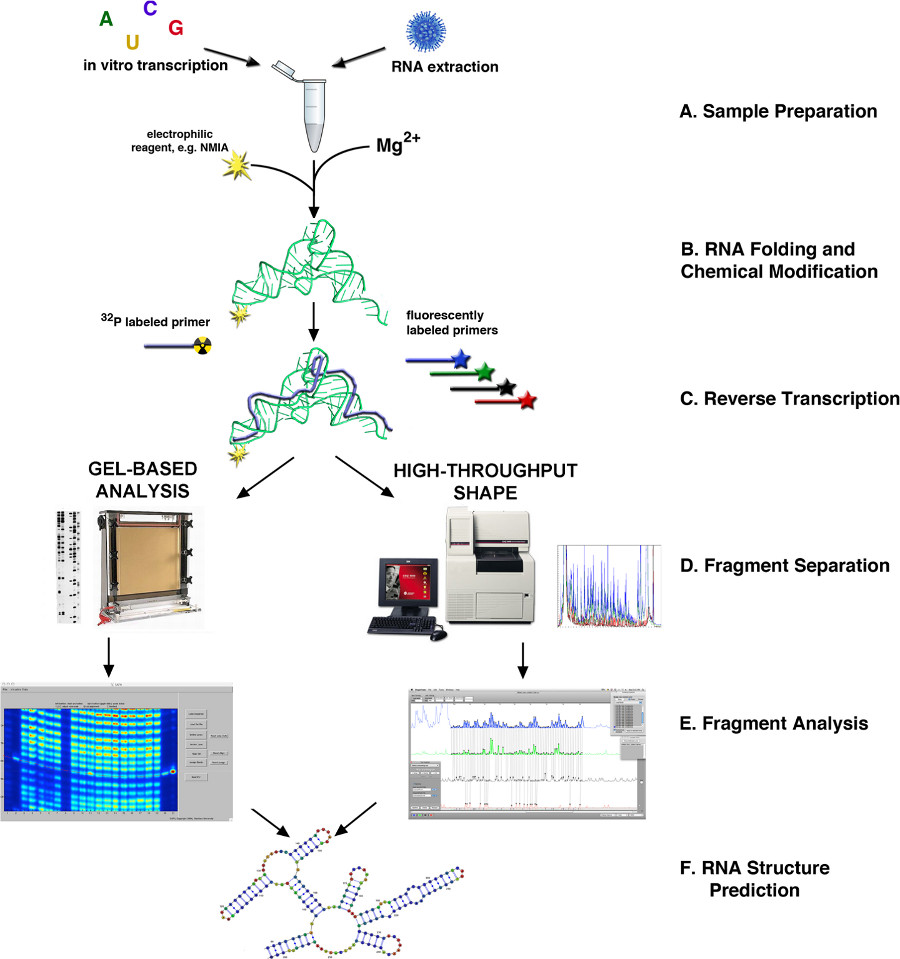

Figure 2. The high-throughput character of CE-based SHAPE allows rapid analysis of multiple RNAs, and/or multiple segments of the same RNA. (A) Represents how an RNA may be divided into 300-600 nt sections (color coded in green, blue and red) (B) Sections of the RNA are probed independently using different sets of fluorescent primers (black arrows) (C) Sets of reactions are pooled and loaded into wells A1, B1, C1, etc, respectively, providing complete coverage for the ~3 kb RNA1. Reaction products from RNAs 2, 3, 4, etc. may be similarly prepared for fractionation in consecutive electrophoretic runs. Click here to view larger figure.
Protokół
Primer design and extension of the RNA 3' terminus
To analyze long RNAs by high-throughput SHAPE, a series of primer hybridization sites should be selected such that they (i) are separated by ~300 nt, (ii) are 20-30 nt in length, and (iii) that RNA/DNA hybrids produced by annealing DNA to these sites have an expected melting temperature of >50 °C. In addition, segments of RNA that are predicted to be highly structured should be avoided, although making such a determination requires some foreknowledge of the RNA structure, which is often unavailable. DNA primers that hybridize to these sites should then be designed, taking care to ensure that they would not be expected to form stable dimers or intrastrand secondary structures.
Once designed, primer sets must be either purchased (e.g. from Integrated DNA Technologies, Ames, Iowa) or synthesized24,25. Primers 5'-labeled with Cy5, Cy5.5, WellRedD2 (Beckman Coulter) and IRDye800 (Lycor) /WellRedD1 (Beckman Coulter) are best suited for the Beckman Coulter 8000 CEQ, providing good signal intensity while minimizing crosstalk. Labeled oligonucleotides may be stored indefinitely in small, 10 μM aliquots at -20 °C; avoid repeated freeze/thaw cycles.
By using primers designed in this manner, it is possible to obtain SHAPE data for virtually an entire RNA of any length. However, the sequence at or near the 3' terminus of an RNA is always inaccessible to SHAPE, unless the RNA is engineered to contain a 3' terminal extension (e.g. a "structure cassette") to which a primer may be hybridized4.
RNA Preparation through Capillary Electrophoresis
Although RNAs from biological samples may be utilized for high-throughput SHAPE, the protocol given here is optimized for RNA produced by in vitro transcription. Commercial transcription kits such as MegaShortScript (Ambion) used in conjunction with MegaClear RNA purification columns (Ambion) are well suited to generating large amounts of pure RNA. RNAs should be stored in TE buffer between -20 °C and -80 °C. For best results, RNAs should appear homogeneous by both denaturing and non-denaturing polyacrylamide gel electrophoresis.
1. RNA Folding
- In a 0.5 ml microcentrifuge tube, dilute 12 pmol of RNA to 18 μl with water and add 2 μl of 10X renaturation buffer. Mix well.
- Heat to 85 °C for 1 min, then cool to 4 °C at a rate of 0.1 °C/sec.
- Add 100 μl of water and 30 μl of 5X folding buffer.
- Incubate at 37 °C for 30-60 min, depending on the RNA being folded. In general, Mg2+-dependent folding of longer, and more structured RNAs require longer incubation times.
- Transfer a 72 μl aliquot to each of two 0.5 ml microcentrifuge tubes: Modified (+) and Control (-).
2. Chemical Modification of the RNA
Well characterized, electrophilic SHAPE reagents include isatoic anhydride (IA), N-methylisatoic anhydride (NMIA), 1-methyl-7-nitro-isatoic anhydride (1M7)26, and benzoyl cyanide (BzCN)27. Of these, the most commonly used for high-throughput SHAPE are 1M7 and NMIA, and only the latter is commercially available (Life Technologies). The final concentration of modifying reagent must be optimized for each RNA to obtain "single-hit" modification kinetics, i.e. the condition in which most RNAs in solution are modified once in the region of RNA being analyzed11. This optimum concentration can be determined by performing multiple reactions in which the concentration of reagent is varied across the range(s) indicated in the table in Section 2.1 below. Use the concentration of reagent that produces an easily detectable signal while minimizing the difference in signal intensity between long and short DNA synthesis products (e.g. Figure 3).

Figure 3. SHAPE electropherograms produced from a ~360 nt RNA treated with (A) 0 (B) 2.5 mM or (C) 10 mM 1M7. All electropherograms are displayed on the same scale. Blue, green, red and black traces correspond to (+) reaction products (Cy5), (-) reaction products (Cy5.5), and the two sequencing ladders (WellRed D2 and IRDye800), respectively. The RNA used to produce image (B) has been treated with the optimal amount of 1M7, demonstrating good peak resolution and intensity, with minimal signal decay throughout the trace (left). Read length is maximal under these conditions. In contrast, the absence of medium intensity, well resolved peaks in (A) suggests a sub-optimal concentration of 1M7. Conversely, the signal decay evident in (C) indicates that single hit kinetics is not observed, and the RNA is over-modified. In such cases, especially when RT would not be expected to encounter the 5' terminus of the RNA template, read length will be suboptimal.
- Prepare 10X stock of SHAPE reagent (NMIA or 1M7). This is best achieved by adding a small amount of reagent to a 1.5 ml microfuge tube, then adding DMSO to achieve the desired concentration. Attention: SHAPE reagent solutions must remain anhydrous until mixed with RNA. Store DMSO in a desiccator at room temperature, and prepare stock solutions immediately prior to use in order to minimize exposure to ambient water vapor.
Reagent Optimum 10X concentration (in DMSO) Time to complete degradation of reagent27 NMIA 10-100 mM ~20 min 1M7 10-50 mM 70 sec
Table 1. Electrophilic reagents used for RNA modification. - Add 8 μl 10X NMIA/1M7 or anhydrous DMSO to modified (+) and control (-) mixes, respectively. Note: 2.5 mM has proven to be an effective starting concentration for both NMIA and 1M7, regardless of the RNA being analyzed.
- Incubate at 37 °C for 50 min (NMIA) or 5 min (1M7), as appropriate.
- Precipitate RNA by adding 8 μl (0.1 vol) of 3 M NaOAc (pH 5.2), 8 μl 100 mM EDTA, 240 μl (3 vol) of cold ethanol and 1 μl 10 mg/ml glycogen. Refrigerate for 2 hr and then centrifuge at 14,000 x g for 30 min at 4 °C. Wash the pellet twice with cold 70% ethanol. Attention: It is important to minimize refrigeration time, centrifugation time and speed in order to minimize co-precipitation of salt, as this can adversely affect peak resolution during electrophoresis.
- Remove supernatant with a micropipette, and air dry pellet for 5 min at room temperature.
- Dissolve precipitated RNA in 10 μl TE buffer and incubate 5 min at room temperature. This is enough dissolved RNA for two reverse transcription reactions. Store the unused portion at -20 °C. Attention: Mechanical resuspension of the pellet is usually not necessary, and may damage the RNA.
3. Reverse Transcription
This step generates the fluorescently-labeled cDNA products that are used to indirectly identify the degree to which RNA nucleotides have been modified by a SHAPE reagent. For SHAPE, the performance of Superscript III (Invitrogen) RT was superior to all other RTs tested, and is the enzyme chosen for use with this protocol. Oligonucleotides labeled with Cy5 and Cy5.5 are used to prime the (+) and (-) reactions, respectively. For shorter RNAs, primers are hybridized to a 3' terminal extension of the native RNA (e.g. a "structure cassette") in order to obtain information about the 3' terminus4. Attention: From this point through CE, samples should be protected from light.
- Prepare (+) and (-) samples for reverse transcription in 0.5 ml microfuge tubes. For the (+) RT reaction, mix 5 μl of modified RNA (+), 6 μl water and 1 μl Cy5-labeled primer (10 μM); for the (-) RT reaction, mix 5 μl control RNA (-), 6 μl water, and 1 μl Cy5-labeled primer (10 μM). Attention: Sarstedt PCR tubes (REF 72.735.002) are recommended for this application.
- Place tubes in a thermal cycler, and anneal primer to RNA and prepare for reverse transcription by applying the following program: 85 °C, 1 min; 60 °C, 5 min; 35 °C, 5 min; 50 °C, hold.
- During the annealing step, prepare enough 2.5X RT mix for the number of reactions to be performed, plus 50% (e.g. for two (+) and two (-) reactions, scale 4.5-fold). One reaction requires 8 μl, as follows: 4 μl 5x RT buffer, 1 μl 100 mM DTT, 1.5 μl water, 1 μl 10 mM dNTPs, 0.5 μl SuperScript III RT. Keep on ice. Attention: 5X RT buffer and 100 mM DTT are provided with the SuperScript III RT.
- Once the temperature of the annealing mixes reaches 50 °C, add 8 μl of 2.5X RT mix to the (+) and (-) reactions. Recommendation: Warm the RT mix to 37 °C for 5 min before adding it to the reactions.
- Incubate for 50 min at 50 °C, then cool to 4 °C and/or place on ice. Note: Incubation of the RT reactions for longer than 50 min may result in aberrant cDNA products.
- Hydrolyze RNA by adding 1 μl 4 M NaOH and heating to 95 °C for 3 min. Cool reactions on ice and then neutralize them by adding 2 μl of 2 M HCl. Attention: Omission of this step results in bad quality separation of cDNA products.
- Combine (+) and (-) reactions and precipitate the cDNA by adding 0.1 vol of 3 M NaOAc, 0.1 vol of 100 mM EDTA, 1.5 vol of cold ethanol and 1 μl of 10 mg/ml glycogen. Refrigerate for 2 hr, then centrifuge at 14,000 x g for 30 min at 4 °C. Wash the pellet twice with cold 70% ethanol. Attention: Centrifugation at higher rates or for a longer period results in difficulties resuspending the pellet(s).
- Resuspend pelleted cDNA in 40 μl of deionized formamide by heating to 65 °C for 10 min, followed by vigorous vortexing for more than 30 min. Attention: Pellets may be invisible. Lack of signal or weak signal following electrophoresis may be the result of failure to adequately dissolve the pellet at this stage.
4. Preparation of Sequencing Ladder
Sequencing ladders serve as markers for determining nucleotide position during data processing. These are generated using a USB Cycle Sequencing kit (#78500), DNA having the same sequence as the RNA being studied, and primers labeled with WellRed D2 or D1/Lycor 800. Typically, DNA employed in this reaction will be that used as a transcription template for the RNA in question. Although the reaction protocol presented here closely resembles that recommended by the kit manufacturer, the reaction is scaled up several fold. While ddA and ddT are used as chain terminators in the reactions described below, any pair of terminators may be used to generate the sequencing ladders.
- Mix 40 μl of the ddA termination mix, 5 pmol of DNA template, 4.6 μl of 10X Sequenase buffer, 10 μl of WellRed D2 labeled primer, 4.6 μl of Sequenase and water to bring the total volume to 82 μl. Add the Sequenase last. Prepare a second sequencing reaction in the same manner, utilizing ddT and Licor IR800 labeled primer instead.
- Proceed to PCR amplification using USB recommended conditions. Attention: Addition of mineral oil is not required nor recommended for protocols/thermal cyclers that utilize a heated lid.
- Combine the ddA and ddT sequencing reactions into one 1.5 ml microfuge tube (~164 μl total).
- Precipitate DNA as follows: Add 16 μl 3 M NaOAc (pH 5.2), 16 μl 100 mM EDTA, 1 μl 10 mg/ml glycogen, and 480 μl 95% ethanol. Mix well, incubate at 4 °C for 30 min and centrifuge at 14,000 x g for 30 min at 4 °C.
- Resuspend pelleted cDNA in 100 μl of deionized formamide by heating to 65 °C for 10 min, followed by vigorous vortexing for at least 30 min.
5. Fractionation of Reaction Products by Capillary Electrophoresis
Capillary electrophoresis allows simultaneous separation of cDNA synthesis products from four reactions pooled into a single sample. Eight samples may be fractionated simultaneously, while as many as 96 samples may be fractionated during a single run (Figure 2).
- Mix 40 μl of pooled SHAPE samples with 10 μl of the pooled sequencing ladders, and transfer to 96-well sample plates. Attention: It is imperative that Beckman Coulter reagents and plates (including LPA-I gel, running buffer, mineral oil, sample loading solution and sample and buffer plates) be used with the Beckman-Coulter CEQ 8000 Genetic Analyzer.
- Program and prepare capillary electrophoresis instrument and initiate run as per manufacturers instructions. Note: For best resolution of samples, use the previously published CAFA method parameters28.
Ideally, outside of primer and strong-stop peaks, signals for each peak in all four electropherogram traces should be in the linear range; a gradual drop-off in signal is acceptable. Sometimes, however, large peaks (stops) are evident even in the control reaction, and these can interfere with subsequent data processing. Truncated cDNAs that give rise to these peaks can be the result of a natural obstacle during reverse transcription (e.g. RNA secondary structure), or RNA degradation. In the former case, additives such as betaine might improve RT processivity and reduce RT pausing/premature termination.
Data processing
ShapeFinder software allows the user to visualize and transform CE traces and convert them into SHAPE reactivity profiles18. Once reactivity values are tabulated, they are normalized and imported into RNAStructure (v5.3) to generate and refine secondary structural models.
6. ShapeFinder Software
An extension of the BaseFinder trace processing platform29, the published version of ShapeFinder is freely available for non-commercial use18. Detailed instructions for data handling in ShapeFinder are provided with the software documentation.
- Electropherograms are imported from the CEQ into ShapeFinder, where they are adjusted to correct for (i) fluorescent background, (ii) spectral overlap between fluorescent channels, (iii) mobility shifts imparted by differently tagged primers, (iv) differences in florescence intensity of common products labeled with different fluorophores, and (v) signal decay resulting from premature termination of reverse transcription.
- The "Setup" function of the "Align and Integrate" tool in ShapeFinder automatically assigns identities to individual peaks and correlates this to the RNA sequence as defined by user input and the two sequencing ladders. Although initial assignments are generally imperfect, errors can be corrected manually using the "Modify" function of the same tool. Finally, the "Fit" function calculates the areas under the aligned (+) and (-) reaction peaks, and tabulates these reactivity values along with the corresponding nucleotide number in a tab-delimited text file.
Note: The analysis of the data is critical for the accuracy of SHAPE, and some considerations are very important during this analysis, including:
- Signal-to-noise: The signal-to-noise ratio has to be such that the individual peaks should be easily identifiable even for positions with low reactivity. Although ShapeFinder provides a data smoothing option; this alternative should be used extremely cautiously, as it can skew subsequent analysis.
- Region of analysis: Typically, reliable data can be obtained from cDNAs 300-600 nt long, starting at a region 40-80 nt removed from primer 3' terminus and ending as the signal decays to levels difficult to distinguish from background noise. Use of multiple primer sets will be required to analyze longer stretches of RNA. In this case, it is recommended that the overlap in reliable signal between primer sets is in the range of 30-50 nt. On shorter RNAs, where reverse transcriptase frequently reaches the end of the RNA template, care must be taken to exclude those peaks whose signal to noise ratio is affected by the DNA synthesis strong stop.
- Signal decay: The signal decay is related to the extent of RNA modification during the experiment as well as the imperfect processivity of RT. Ideally, single-hit kinetics relative to the region of RNA being analyzed should be achieved in order to maximize read length. Shapefinder contains a tool that is effective in correcting for signal decay; however, because this tends to introduce error into the analysis - especially when single hit kinetics are not observed, it is best used when signal decay is minimal (i.e., when the distribution of peaks is consistent with single hit kinetics). Recently, improved algorithms for transforming signal signal decay have been published30 and should be investigated if signal decay is of special concern in a particular experiment.
- Signal scaling. Arguably the most arbitrary step in SHAPE data processing, the control profile should be scaled so that the peak intensities among minimally reactive (+) and (-) traces are equal. Scaling the control trace to too great an extent will result in an abundance of negative reactivity values in the first quartile (see Data Normalization below). In this event, the scale factor should be reduced accordingly and the data reintegrated.
- Peaks assignment. In general, the automated version of the peak assignment works well. When the process fails, however, it is imperative that the user ensure that all the peaks have been recognized by the software, particularly when the signal-to-noise ratio is low. Shoulder peaks, for example, are not always detected, and G-rich sequences are often compressed.
7. Data Normalization
To incorporate nucleotide reactivity profiles into the secondary structure algorithm used by RNAStructure (v5.3) software, and/or to compare profiles of closely related RNAs, SHAPE data must be normalized in a standardized fashion12. This involves (i) excluding outliers from subsequent calculations, (ii) determining the "effective maximum" reactivity (i.e., the average of the highest 8% of reactivity value, excluding outliers), and (iii) normalization by dividing all reactivity values by the "effective maximum", as follows:
- Open the tab-delimited text file generated after alignment and integration and copy its content into an Excel spreadsheet. The rightmost column of this file (RX.area-BG.area) contains the calculated absolute SHAPE reactivity values for each nucleotide of the RNA. The leftmost columns relate this reactivity to the RNA sequence.
- Calculate and store the first and thirds quartile (i.e., the 25th and 75th percentile) values for (RX.area-BG.area) using the Excel function "=QUARTILE(array,quart)"
- Calculate and store the interquartile difference "=QUARTILE(array, 3)-QUARTILE(array, 1)"
- Calculate and store the "outlier cutoff value" using the formula "=(QUARTILE, array,3)+1.5*((QUARTILE(array,3)-QUARTILE(array,1))". All reactivity values greater than this value are to be excluded from subsequent calculations.
- Copy the reactivity values from (RX.area-BG.area) and paste them into an adjacent, empty column, then sort these values such that the greatest are at the top of the column.
- In the newly created "sorted values column", delete values greater than the outlier cutoff value.
- Calculate and store the average of the greatest 8% of reactivity values remaining in the "sorted values column". This value is the "effective maximum" reactivity.
- Divide the unsorted (RX.area-BG.area) of each nucleotide (including outliers) by the "effective maximum" reactivity value to obtain the "normalized reactivity values". Store these in an empty column, leaving an empty column to the left. Then, copy the nucleotide numbers at the left of the table and paste them into the empty column directly to the left of the "normalized reactivity values".
- Copy and paste the nucleotide position-normalized reactivity value pairs into a text editor.
- Eliminate values below -0.09 (i.e., leave the spaces blank), as these are likely the result of RT pausing during cDNA synthesis for reasons other than chemical modification of the template. Moreover, any reactivity values for nucleotides at which strong pausing is observed on the unmodified template (as determined by visual inspection of the "Align and Integrate" ShapeFinder profile), should be excluded.
- Save the file with a .shape extension for use in structural analysis with RNAstructure (v5.3) software.
8. Data Modeling
RNAstructure (v5.3) software is used to predict experimentally-supported RNA secondary structure(s) using the pseudo-free energy constraints derived from SHAPE analysis19. The software provides graphical representations of the lowest energy 2D RNA structures as well as textual representation of these structures in dot-bracket notation. The latter can be imported in an RNA structure viewer of the user's preference, e.g. Pseudoviewer23 or Varna22, to produce publication-quality images.
Note: Care must be taken when considering the structures produced by the RNAstructure (v5.3) software. For example, the software cannot resolve tertiary interactions such as pseudoknots and kissing loops, nor can it distinguish whether lack of reactivity in a certain region is due to basepairing or steric protection by bound proteins. As a consequence, these factors, along with the energies reported for the individual structures, must be considered when presenting a definitive structural model.
Wyniki
RNA containing the HIV-1 rev response element (RRE) and a 3' terminal structure cassette4 was prepared from a linearized plasmid by in vitro transcription, after which it was folded by heating, cooling, and incubation at 37 °C in the presence of MgCl2. RNA was exposed to NMIA and then reverse transcribed from a 5'-end-labeled DNA primer hybridized to the 3' terminal structure cassette. The resulting SHAPE cDNA library, together with control and sequencing reactions, was then fractionated u...
Dyskusje
We present here a detailed protocol for high-throughput SHAPE, a technique that allows secondary structure determination to single-nucleotide resolution for RNAs of any size. Moreover, coupling experimental SHAPE data with secondary structure prediction algorithms facilitates generation of RNA 2D models with a higher degree of accuracy than is possible with either method alone. The combination of fluorescently-labeled primers and automated CE provides significant advantages over the traditional gel-based SHAPE, facilitat...
Ujawnienia
No conflicts of interest declared.
Podziękowania
S. Lusvarghi, J. Sztuba-Solinska, K.J. Purzycka, J.W. Rausch and S.F.J. Le Grice are supported by the Intramural Research Program of the National Cancer Institute, National Institutes of Health, USA.
Materiały
| Name | Company | Catalog Number | Comments |
| REAGENTS | |||
| N-methylisatoic anhydride (NMIA) | Life technologies | M25 | Dissolve in anhydrous DMSO |
| 1-methyl-t-nitroisatoic anhydride (1M7) | see ref. 22 | ||
| Superscript III Reverse Transcriptase | Life technologies | 18080044 | 10,000 units |
| Thermo sequenase cycle sequencing kit | Affymetrix | 78500 | |
| Materials provided by the user | |||
| RNA of interest | 6 pmol per reaction (the limit of detection will be determined by the instrument) | ||
| Sets of four 5' labeled primers (Cy5, Cy5.5, WellRed D2 and WellRed D1/Licor IR800) | Primers are complementary to the RNA and are used in reverse transcription and sequencing reactions. The listed fluorophores are optimal for the Beckman Coulter 8000 CEQ. Primers may be purchased or synthesized in house. | ||
| DNA template | DNA is used for sequencing reactions, and must contain the sequence of the RNA being studied - including any 3'terminal extension, if present. Where applicable, it is often convenient to use the RNA transcription template. | ||
| Buffers | |||
| 10x RNA renaturation buffer | 100 mM Tris-HCl pH 8.0, 1 M KCl, 1 mM EDTA | ||
| 5X RNA folding buffer | 200 mM Tris-HCl pH 8.0, 25 mM MgCl2, 2.5 mM EDTA, 650 mM KCl. (This buffer might be changed depending on the case (e.g. pH, EDTA, Mg, RNase inhibitor) | ||
| 2.5X RT mix | 4 μl 5X buffer, 1 μl 100 mM DTT, 1.5 μl water,1 μl 10 mM dNTPs, 0.5 μl SuperScript III. Note that the 5X buffer and 100 mM DTT are provided with purchase of SuperScript III (Invitrogen). | ||
| GenomeLab Sample Loading Solution (Beckman Coulter) | Attention: Avoid multiple freeze-thaw cycles | ||
| EQUIPMENT | |||
| Capillary electrophoresis | Beckman | CEQ8000 | |
| Thermocycler | varies | ||
Odniesienia
- Scott, W. G., Martick, M., Chi, Y. I. Structure and function of regulatory RNA elements: ribozymes that regulate gene expression. Biochim. Biophys. Acta. 1789, 634-641 (2009).
- Moore, P. B., Steitz, T. A. The roles of RNA in the synthesis of protein. Cold Spring Harb. Perspect. Biol. 3, a003780 (2011).
- Wilkinson, K. A., et al. High-throughput SHAPE analysis reveals structures in HIV-1 genomic RNA strongly conserved across distinct biological states. Plos Biol. 6, 883-899 (2008).
- Merino, E. J., Wilkinson, K. A., Coughlan, J. L., Weeks, K. M. RNA structure analysis at single nucleotide resolution by selective 2 '-hydroxyl acylation and primer extension (SHAPE). J. Am. Chem. Soc. 127, 4223-4231 (2005).
- Watts, J. M., et al. Architecture and secondary structure of an entire HIV-1 RNA genome. Nature. 460, 711-716 (2009).
- Xu, W., Bolduc, F., Hong, N., Perreault, J. P. The use of a combination of computer-assisted structure prediction and SHAPE probing to elucidate the secondary structures of five viroids. Mol. Plant Pathol. , (2012).
- Novikova, I. V., Hennelly, S. P., Sanbonmatsu, K. Y. Structural architecture of the human long non-coding RNA, steroid receptor RNA activator. Nucleic Acids Res. 40, 5034-5051 (2012).
- Leshin, J. A., Heselpoth, R., Belew, A. T., Dinman, J. High-throughput structural analysis of yeast ribosomes using hSHAPE. RNA Biol. 8, 478-487 (2011).
- Souliere, M. F., Haller, A., Rieder, R., Micura, R. A powerful approach for the selection of 2-aminopurine substitution sites to investigate RNA folding. J. Am. Chem. Soc. 133, 16161-16167 (2011).
- Wilkinson, K. A., Merino, E. J., Weeks, K. M. Selective 2 '-hydroxyl acylation analyzed by primer extension (SHAPE): quantitative RNA structure analysis at single nucleotide resolution. Nat. Protoc. 1, 1610-1616 (2006).
- McGinnis, J. L., Duncan, C. D. S., Weeks, K. M. High-Throughput Shape and Hydroxyl Radical Analysis of Rna Structure and Ribonucleoprotein Assembly. Method Enzymol. 468, 67-89 (2009).
- Low, J. T., Weeks, K. M. SHAPE-directed RNA secondary structure prediction. Methods. 52, 150-158 (2010).
- Das, R., Laederach, A., Pearlman, S. M., Herschlag, D., Altman, R. B. S. A. F. A. Semi-automated footprinting analysis software for high-throughput quantification of nucleic acid footprinting experiments. Rna-a Publication of the Rna Society. 11, 344-354 (2005).
- Kertesz, M., et al. Genome-wide measurement of RNA secondary structure in yeast. Nature. 467, 103-107 (2010).
- Underwood, J. G., et al. FragSeq: transcriptome-wide RNA structure probing using high-throughput sequencing. Nat. Methods. 7, 995-1001 (2010).
- Mauger, D. M., Weeks, K. M. Toward global RNA structure analysis. Nat. Biotechnol. 28, 1178-1179 (2010).
- Lucks, J. B., et al. Multiplexed RNA structure characterization with selective 2'-hydroxyl acylation analyzed by primer extension sequencing (SHAPE-Seq). Proc. Natl. Acad. Sci. USA. 108, 11063-11068 (2011).
- Vasa, S. M., Guex, N., Wilkinson, K. A., Weeks, K. M., Giddings, M. C. ShapeFinder: a software system for high-throughput quantitative analysis of nucleic acid reactivity information resolved by capillary electrophoresis. RNA. 14, 1979-1990 (2008).
- Reuter, J. S., Mathews, D. H. RNAstructure: software for RNA secondary structure prediction and analysis. BMC Bioinformatics. 11, 129 (2010).
- Pang, P. S., Elazar, M., Pham, E. A., Glenn, J. S. Simplified RNA secondary structure mapping by automation of SHAPE data analysis. Nucleic Acids Res. 39, e151 (2011).
- Deigan, K. E., Li, T. W., Mathews, D. H., Weeks, K. M. Accurate SHAPE-directed RNA structure determination. Proc. Natl. Acad. Sci. USA. 106, 97-102 (2009).
- Darty, K., Denise, A., Ponty, Y. VARNA: Interactive drawing and editing of the RNA secondary structure. Bioinformatics. 25, 1974-1975 (2009).
- Byun, Y., Han, K. PseudoViewer: web application and web service for visualizing RNA pseudoknots and secondary structures. Nucleic Acids Res. 34, 416-422 (2006).
- Brown, T., Brown, D. J. S., Eckstein, F. . Oligonucleotides and Analogues - A Practical Approach. , 20 (1990).
- Legiewicz, M., et al. The RNA Transport Element of the Murine musD Retrotransposon Requires Long-range Intramolecular Interactions for Function. J. Biol. Chem. 285, 42097-42104 (2010).
- Steen, K., Siegfried, N. A., Weeks, K. M. Syntheis of 1-methyl-8-nitroisatoic anhydride (1M7). Protocol Exchange. , (2011).
- Mortimer, S. A., Weeks, K. M. A fast-acting reagent for accurate analysis of RNA secondary and tertiary structure by SHAPE chemistry. J. Am. Chem. Soc. 129, 4144-4145 (2007).
- Mitra, S., Shcherbakova, I. V., Altman, R. B., Brenowitz, M., Laederach, A. High-throughput single-nucleotide structural mapping by capillary automated footprinting analysis. Nucleic Acids Res. 36, e63 (2008).
- Giddings, M. C., Severin, J., Westphall, M., Wu, J., Smith, L. M. A software system for data analysis in automated DNA sequencing. Genome Res. 8, 644-665 (1998).
- Aviran, S., et al. Modeling and automation of sequencing-based characterization of RNA structure. Proc. Natl. Acad. Sci. USA. 108, 11069-11074 (2011).
Przedruki i uprawnienia
Zapytaj o uprawnienia na użycie tekstu lub obrazów z tego artykułu JoVE
Zapytaj o uprawnieniaThis article has been published
Video Coming Soon
Copyright © 2025 MyJoVE Corporation. Wszelkie prawa zastrzeżone