1. Becoming Familiar with the Apparatus
- For this experiment, use a computer to collect the data and plot graphs.
- Load the software for the experiment by double-clicking on the "Ohm's Law" icon on the computer desktop. When the program loads, the screen should show a graph, a table, and in the lower right corner, boxes with the voltage and current readings.
- Click the Zero button and select "Zero All Sensors" to make sure that the voltage and current readings read zero when they are unconnected.
- Following the circuit diagram in Figure 1, connect the two leads on the voltage sensor to the power supply, which is a blue box. The red lead goes to the + connection on the power supply, and the black lead goes to the - one.
- Make sure that the current sensor is not connected, and ensure that the current knob on the power supply is turned to maximum (fully clockwise).
- Start the data collection by pressing the green arrow icon (the Collect button) on the computer.
- Observe what happens when the voltage knob on the power supply is moved between its minimum and maximum settings. Adjusting the knob allows the voltage to be changed from about +0.7 V to at least +5 volts.
- Reverse the leads of the voltage sensor (red to -, black to +), and repeat the steps 1.5-1.7. This time, adjusting the knob gives a voltage range of about −0.7 V to -5 V. Thus, by adjusting the power supply voltage as well as reversing the leads, almost the full range of voltages between -5 V and +5 V is available to work with in this experiment. Note that the power supply used in this experiment cannot put out voltages below 0.7 volts (an unusual feature), but there is more than enough of a range to determine the relationships of interest.
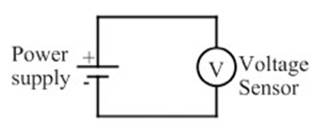
Figure 1: This circuit diagram shows the power supply (marked with the + and - symbols) and the voltage sensor (V) connected by two wires.
2. Investigating Ohm's Law
Note: In this part of the experiment, the goal is to observe graphs of current vs. voltage.
- To change what is displayed on an axis, click on the axis label, check the appropriate option to display the desired information, and (for the y-axis only) remove the check(s) for unwanted items on the display. Set the graph to show current on the y-axis and potential on the x-axis.
- To set the scales properly, click on one of the numbers to the left of the y-axis. This brings up a box to enter a minimum of -0.3 and a maximum of 0.3 for the manual scaling. Repeat for the x-axis by clicking on a number below the x-axis to bring up the settings box. This time, enter -6 as the minimum and 6 as the maximum. This prepares the graph to display currents between −0.3 and +0.3 A, and voltages between -5 V and +5 V.
- Following the circuit diagram in Figure 2, wire the circuit to measure the voltage and current across a 100 Ω resistor.
- Use a resistance box as the resistor. Set it for 100 Ω. On the power supply, turn both the current and the voltage to maximum.
- Press the green arrow icon to start the data collection.
- Over several seconds, turn the voltage down to minimum, then quickly reverse the leads at the power supply. Over several seconds, turn the voltage knob toward maximum again. This should result in a graph of current vs. voltage, ranging from about -5 volts to +5 volts.
- Repeat the process until satisfied with the graph, select the Data menu, and choose "Store Latest Run."
- Observe that the graph of current vs. voltage is a straight line. Hit the Regression button to perform a linear fit to the data, and record the slope of the line.
- Figure 4 shows the current vs. voltage graph for the resistor marked 100 Ω. A linear fit to the data results in a slope of 0.00991 A/V. The inverse of the resistance is 0.0100 A/V, which is a good match to the slope.
- Change the resistance of the resistance box to 200 Ω, and repeat the steps 2.6-2.9.
- Compare the two slope values to the corresponding resistance values, and determine the relationship between current, voltage, and resistance.
- Figure 5 shows the current vs. voltage graph for the resistor marked 200 Ω. A linear fit to the data results in a slope of 0.00510 A/V. The inverse of the resistance is 0.00500 A/V, which is a good match to the slope.
- The slope of the current vs. voltage graph turns out to be the inverse of the resistance. This can be written as:
 or
or 
- The current sent out by the power supply is proportional to the voltage and inversely proportional to the resistance. When the current is graphed as a function of the voltage, the slope of the line is expected to be the inverse of the resistance.
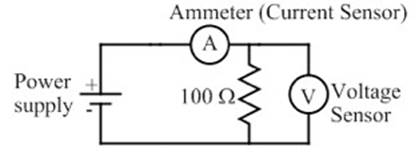
Figure 2: This circuit diagram shows the power supply connected to a 100 Ω resistor, with the voltage sensor (V) measuring the potential difference across the resistor and the ammeter measuring the current through it.
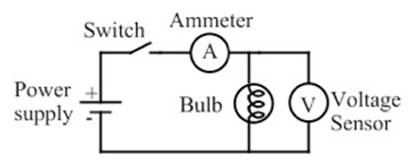
Figure 3: In this circuit diagram, the resistor is replaced by a light bulb, and a switch has been added. The switch is initially open, so that the light bulb is off at the start.
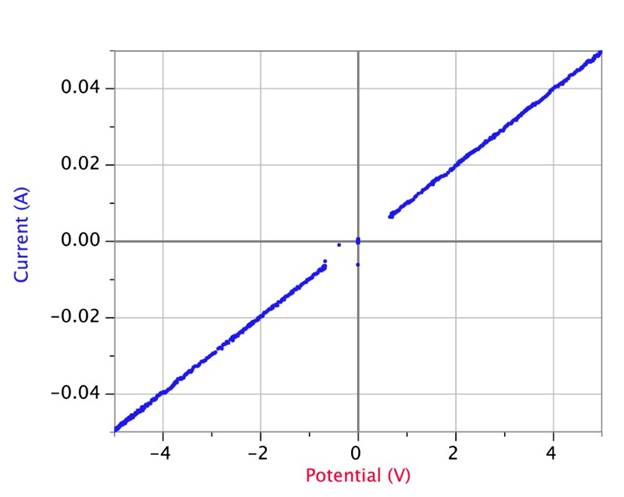
Figure 4: Current vs. voltage graph with a resistor marked 100 Ω. A linear fit to the data results in a slope of 0.00991 A/V. Note that the missing data at the center of the graph is simply an artifact of the particular power supply used in the experiment, which has the unusual feature of not producing voltages below about 0.7 V. 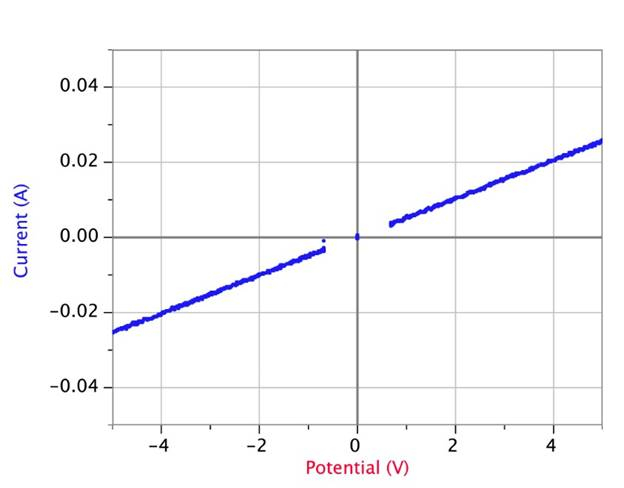
Figure 5: Current vs. voltage graph with a resistor marked 200 Ω. A linear fit to the data results in a slope of 0.00510 A/V.
3. Investigating Light Bulbs
- Replace the resistor from the previous circuit with a small incandescent light bulb ( Figure 3). Repeat the experiment, obtaining a graph of current as a function of voltage for the light bulb. Note any differences in graph form for the light bulb compared to the resistor.
- Figure 6 shows a graph of current vs. voltage for the incandescent light bulb. In general, the current increases as the voltage increases, but the graph is not nearly as linear as the graphs for the resistors. The graph also shows that the current is, in general, higher at a given voltage when the voltage is increasing, compared to its value at that same voltage when the current is decreasing.
- Now, plot current vs. time instead of current vs. voltage. To do this, click on the "voltage" label on the horizontal axis to bring up the list of variables that the graph can be plotted against, and choose time instead of voltage.
- Turn the voltage up, so that the bulb glows brightly, and then switch the power supply off, using the on/off switch. Click on the Collect button (green arrow) on the screen to start the data collection, and switch the power supply back on.
- Observe the graph, shown in Figure 7. The current through the light bulb goes to a high level when the power supply is switched on, and then drops to a smaller constant value. This is quite different than the behavior of a standard resistor, which would typically jump straight to a constant value when the power supply is turned on.
- The explanation for both of these observations is the same. The higher the temperature of the light bulb filament, the larger the resistance. When the bulb is off ( Figure 7), the filament is at room temperature with a relatively low resistance. When the bulb is then turned on, the current jumps to a high level because of the low resistance, but as the filament heats up and the resistance increases, the current drops. Eventually, the temperature stabilizes, and the current is constant.
- When the voltage is increasing ( Figure 6), the filament is warming up, so with a cooler filament the resistance is lower and the current higher. For the second half of the graph, when the voltage reduces, the filament is cooling down from a higher temperature, and thus has a higher resistance and lower current.
- Finally, switch back to current vs. voltage, and use a LED in place of the light bulb.
- As before, obtain a graph of current as a function of voltage for the LED. Be sure to use both positive and negative voltages to see the full range of the circuit behavior with the LED.
- Figure 8 shows the current vs. voltage graph for a LED. The diode does not allow current to flow in one direction, when the voltage is negative; however, when the voltage is positive and above a certain threshold, current flows and increases as quickly as voltage increases. In this way, the diode acts as a one-way valve for current. Note that the light-bulb filament and the resistors show no such directionality.
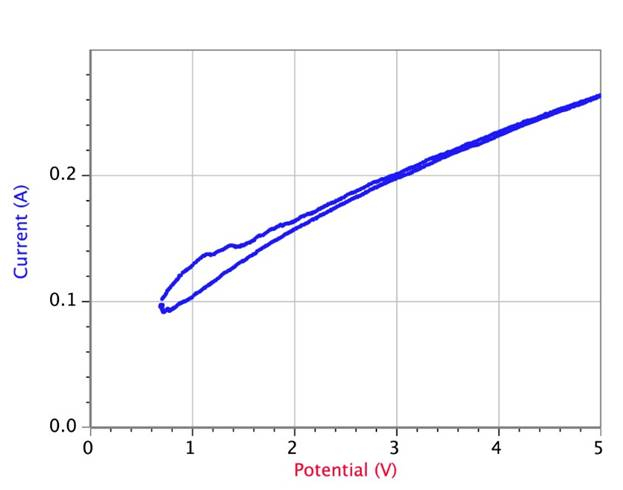
Figure 6: Current vs. voltage graph for an incandescent light bulb. The graph starts at the bottom left, then followed the upper track as the voltage was increased, and the bulb became very bright. The voltage was then decreased, and the graph followed the lower track back down to the bottom left.
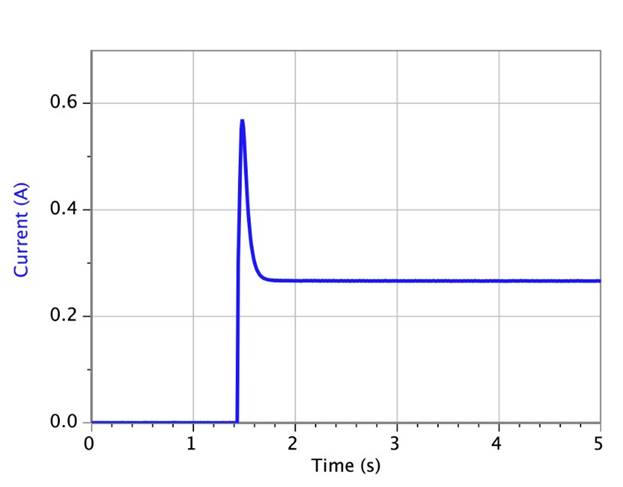
Figure 7: Current vs. time graph for an incandescent light bulb. The bulb was off, and then the voltage was turned on at around the 1.4 second mark and kept at a constant value. The current peaked at about 0.57 A, and then dropped down to a constant value of about 0.27 A.
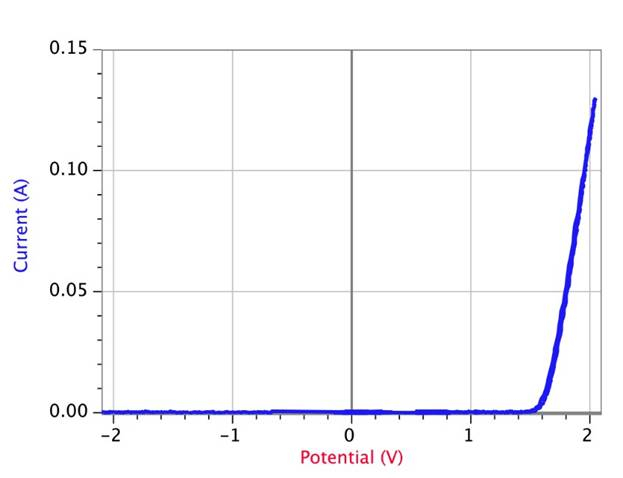
Figure 8: Current vs. voltage graph for a diode. A diode, in some sense, acts as a one-way valve for current. The diode does not allow current to flow when the voltage is negative, but when the voltage is positive and above a certain threshold, the current flows and increases as quickly as voltage increases in one direction.


