Targeted DNA Methylation Analysis by Next-generation Sequencing
In This Article
Summary
Bisulfite amplicon sequencing (BSAS) is a method for quantifying cytosine methylation in targeted genomic regions of interest. This method uses bisulfite conversion paired with PCR amplification of target regions prior to next-generation sequencing to produce absolute quantitation of DNA methylation at a base-specific level.
Abstract
The role of epigenetic processes in the control of gene expression has been known for a number of years. DNA methylation at cytosine residues is of particular interest for epigenetic studies as it has been demonstrated to be both a long lasting and a dynamic regulator of gene expression. Efforts to examine epigenetic changes in health and disease have been hindered by the lack of high-throughput, quantitatively accurate methods. With the advent and popularization of next-generation sequencing (NGS) technologies, these tools are now being applied to epigenomics in addition to existing genomic and transcriptomic methodologies. For epigenetic investigations of cytosine methylation where regions of interest, such as specific gene promoters or CpG islands, have been identified and there is a need to examine significant numbers of samples with high quantitative accuracy, we have developed a method called Bisulfite Amplicon Sequencing (BSAS). This method combines bisulfite conversion with targeted amplification of regions of interest, transposome-mediated library construction and benchtop NGS. BSAS offers a rapid and efficient method for analysis of up to 10 kb of targeted regions in up to 96 samples at a time that can be performed by most research groups with basic molecular biology skills. The results provide absolute quantitation of cytosine methylation with base specificity. BSAS can be applied to any genomic region from any DNA source. This method is useful for hypothesis testing studies of target regions of interest as well as confirmation of regions identified in genome-wide methylation analyses such as whole genome bisulfite sequencing, reduced representation bisulfite sequencing, and methylated DNA immunoprecipitation sequencing.
Introduction
It has been over a half-century since the first report of naturally occurring DNA modifications in the form of cytosine methylation1. Cytosine methylation is a modified cytosine nucleotide base where the 5th carbon on the base ring has a methyl group (5-mC), most frequently occurring in the CpG dinucleotide motif in mammalian genomes. The functional presence of 5-mC in gene promoters is generally associated with transcriptional repression, while the absence is associated with transcriptional activity2.
Tremendous advances have been made in our understanding of the role of DNA methylation in development3, transgeneration propagation of epigenetic profiles4, cancer pathogenesis5,6, and a number of other research areas. Many of these advances have come in the last few years as new methodologies have been developed to profile DNA methylation7. With the advent and popularization of next-generation sequencing (NGS) techniques there are now a number of methods to profile DNA methylation across a whole genome or large regions of a genome8. These approaches open the possibility of discovery studies that quantify DNA methylation patterns and differences in DNA methylation. In addition to these hypothesis-generating approaches, there is a significant need for targeted/hypothesis testing DNA methylation quantitation methods.
Pyrosequencing, methylation specific PCR, and direct Sanger sequencing of bisulfite converted DNA have been the most used methods for analysis of targeted regions (i.e., a promoter region of a single gene or a CpG island)9-12. All of these methods rely on bisulfite conversion, a chemical deamination reaction where unmethylated cytosine’s are converted into uracil’s, while methylated cytosine’s remain intact13,14. PCR amplification of bisulfite-converted DNA results in replacement of uracil’s with thymine15 allowing the differential methylation to read out as a base difference. While highly useful, the limitations to these methods include low quantitative accuracy, short read length, and low sample throughput. To address these limitations we developed a method we have termed Bisulfite Amplicon Sequencing (BSAS)16. The goal of this method is to be able to analyze target genomic regions of interest in a large number of samples with high quantitative accuracy.
BSAS uses elements of existing methods (bisulfite conversion and region-specific PCR amplification) and combines them with simple next-generation library construction (transposome-mediated)17 and benchtop NGS18 (Figure 1). This approach provides for a more quantitative and higher throughput method to examine the cytosine methylation in any region of interest. Here we present the method in detail and describe approaches for troubleshooting and quality checking the BSAS process.
Protocol
1. Nucleic Acid Isolation from Tissue
NOTE: Co-isolation of DNA and RNA from the same tissue sample offers the opportunity to collect DNA for epigenetic analysis and paired RNA for gene expression analysis. The example given here is a form of column purification from experimental tissue but alternative approaches for different sample types or other isolation methods can be employed. The primary requirement is for highly purified nucleic acid without contaminating protein or organic solvents.
- Select a piece of fresh-frozen or fresh tissue for mechanical homogenization and place on ice. Store or transfer tissue to a 2.0 ml round-bottom microcentrifuge tube.
- Add one 5 mm stainless steel bead to each tube containing tissue. Add an appropriate amount of lysis buffer, based on manufacturer’s suggestions of cell number or tissue weight.
- Homogenize the tissue using a bead mill mechanical homogenization at 30 Hz for 30 sec.
NOTE: The frequency and duration of mechanical homogenization is dependent on the tissue type. Softer tissues will completely homogenize using the recommended settings, while tougher tissues require setting optimization. - Carry out the DNA and RNA isolation using silica spin columns at room temperature following manufacturer’s protocol.
- Elute RNA in 50 µl of RNase-free water and place on ice. Use RNA for mRNA expression analysis by qPCR.
- Elute DNA in 100 µl of TE buffer. Repeat elution off DNA column using the eluent to increase DNA concentration and yield. Use DNA for targeted methylation quantitation.
- Assess the quality of DNA and RNA using a standard spectrophotometer for absorbance at 230 nm, 260 nm, 280 nm, and 320 nm.
NOTE: A260/A280 ratio should be ~1.8-2 for high quality DNA. A260/A280 ratio should be ~2 for high quality RNA. The presence of excess absorbance at 230 nm indicates contaminants from the isolation procedure. - Quality check the RNA further by using a capillary electrophoresis chip according to manufacturer’s instructions.
NOTE: High quality RNA will have a RNA integrity number (RIN) >8. The presence of extra peaks in the electropherogram besides rRNA peaks indicate sample contamination. - Quantify DNA and RNA by fluorescent assay according to manufacturer’s protocol.
NOTE: Using a fluorometric assay is more sensitive and specific for quantifying nucleic acids than spectrophotometry alone. - Store isolated DNA and RNA at -80 °C.
2. Target Identification and Primer Design
- Determine the genomic region(s) of interest to be analyzed by BSAS based on the appropriate reference genome sequence. Gene promoters of differentially expressed genes are common targets of methylation quantitation.
- Prepare an in silico bisulfite-converted reference genome for later alignment of sequencing reads by altering the .fasta sequence file in a text editor. In the 5’-3’ orientation, replace non-CpG cytosine’s with thymine’s (Figure 2).
- Design primer sets to amplify regions of interest from bisulfite converted DNA.
- Select and copy the unconverted region of interest, in the 5’-3’ orientation, into a bisulfite-specific PCR primer design program (Figure 3).
NOTE: An optimal bisulfite-PCR amplicon length is 250-400 bp per amplicon as bisulfite treatment fragments DNA and it is difficult to amplify large >400 bp regions. If, for example, a region of 1 kb is of interest, multiple primer pairs can be designed to cover this region. Design amplicons to be of equal bp size for easy pooling. Avoid amplicon lengths <250 bp because these may be of insufficient length for library generation. An optimal primer length for BSAS is > 20 bp per primer. - Select a Tm range of 55-65 °C and a max Tm difference between forward and reverse primers of 1-2 °C.
- Select primer pairs that best cover the region of interest. Do not select primers that contain CpG sites or are directly adjacent to CpG sites, as this will cause bias in the PCR reactions. Use standard PCR primers that can be ordered from any number of academic or commercial providers.
- Reconstitute lyophilized primers in RNase/DNase free water at a working stock of 100 µM.
- Select and copy the unconverted region of interest, in the 5’-3’ orientation, into a bisulfite-specific PCR primer design program (Figure 3).
- Store PCR primers at -20 °C. Dilute 100 µM primer stock to 10 µM working stock for PCR reactions.
3. Bisulfite Specific PCR Optimization
NOTE: For bisulfite conversion of genomic DNA, a number of different commercial kits for bisulfite conversion are available. Select the kit or protocol that best suits the planned experiment.
- Use between 200 ng to 2 µg of genomic DNA. For optimization experiments, run multiple conversion reactions in order to have sufficient bisulfite converted DNA for multiple BS PCR reactions.
- Use small (e.g., 10 µl) elution volumes of bisulfite converted DNA to maintain high DNA concentrations.
NOTE: 1-2 µl of bisulfite converted DNA is sufficient for optimization PCR reactions if 1 µg genomic DNA was used for conversion input. - Amplify bisulfite converted DNA by bisulfite specific PCR. BS-PCR reactions require using a Taq polymerase capable of amplifying bisulfite converted DNA.
- Assemble the following reaction for target amplification optimization of a single amplicon. For multiple samples, assemble reactions in a 96-well PCR plate.
25 µl 2x reaction buffer
0.5 µl dNTP Mix
5 µl 10 µM Forward Primer (Final 1 µM)
5 µl 10 µM Reverse Primer (Final 1 µM)
2 µl template bisulfite converted DNA
0.4 µl (5 U/µl) DNA polymerase
12.1 µl DNase free water (Final reaction volume 50 µl) - Seal PCR plate with the appropriate adhesive or heat-sealed film.
- Place reaction in an appropriate thermal cycler and use the following cycling conditions with a heated lid:
- Perform an initial denaturation at 95 °C for 10 min.
- Denature at 95 °C for 30 sec.
- Anneal for 30 sec at the specific Tm of primers being used. Start at an annealing temperature a few °C below the Tm of the primer for optimization reactions.
NOTE: Best annealing temperatures can also be determined using a gradient thermal cycler to test a range of temperatures. - Perform an extension at 72 °C for 30 sec. Lengthen the extension time for longer amplicons.
- Repeat steps 3.3.3.2-3.3.3.4 for 35 cycles total for initial optimization. Higher cycle numbers might be necessary but should generally be avoided to prevent clonal amplifications that will create reaction artifacts.
- Perform a final extension at 72 °C for 7 min.
- Hold reactions at 4 °C.
- Visualize amplicons by PAGE electrophoresis. Alternatively, use a capillary electrophoresis DNA chip according to manufacturer’s protocol.
- Mix 24 µl of the PCR reaction with 6 µl of 5x loading dye on ice and vortex.
- Make 1 L of 1x TBE running buffer by mixing 200 ml of 5x TBE running buffer and 800 ml of ddH2O. Dilute DNA ladder for a final concentration of 0.5 µg per well in ddH2O and loading dye.
- Load wells with 30 µl of PCR reactions or ladder.
- Run the gel at 200 V for ~45 min. Stop the gel run when the first dye front reaches the end of the gel.
- Stain the gel with 5 µg/ml ethidium bromide by mixing 5 µl of 10 mg/ml in 100 ml of ddH2O. Cover the entire gel and let incubate for ~5 min.
- Image the gel via a UV light box or multimodal imager at an excitation wavelength of 482 nm.
- In reference to the ladder, size the PCR amplicons and determine specificity of the reaction by looking for multiple bands other than the expected amplicon size (Figure 4A and C).
- Once optimal conditions for BS-PCR have been determined, perform BS-PCR on experimental samples.
- Purify amplicons from remaining primers and other reaction components. Perform silica column purification, SPRI bead, or gel-based clean-up and quantification.
- Elute amplicons in 30 µl TE buffer.
- Quantify amplicons using fluorometric assay using manufacturer’s protocols.
- If there are multiple amplicons per sample, pool them at equal weight per volume amounts and store at -20 °C.
- Assemble the following reaction for target amplification optimization of a single amplicon. For multiple samples, assemble reactions in a 96-well PCR plate.
4. NGS Library Preparation and Library QC
NOTE: BSAS NGS library preparation uses a simplified transposome-mediated protocol with dual-indexing (See Materials List for details on library preparation kit selection). This method provides an extremely rapid and high-throughput route for library construction that has been validated and shows little to no bias in bisulfite sequencing applications16,19. Dual-indexing allows for a higher multiplexing of samples than single indexing. Other library preparation styles may be possible but have not been tested.
- Prepare NGS libraries from BS PCR amplicons in a 96-well PCR plate. Dilute amplicons to 0.2 ng/µl for a final input mass of 1 ng, or 5 µl of the 0.2 ng/µl dilution. Perform a clean-up of generated libraries using SPRI beads. Use 50-90 µl SPRI beads for isolating libraries with this protocol. The volume of SPRI beads depends on target size of library and cycle number of desired sequencing reactions.
NOTE: Use a microplate shaker or plate vortexer to resuspend beads.- Elute the libraries off the beads and transfer to a new 96-well plate and seal with heat-sealing film for storage at -20 °C.
- Determine the size and concentration of libraries (Figure 4B and D).
- Run libraries on a capillary electrophoresis DNA sizing chip according to manufacturer’s protocols.
- Use a high sensitivity capillary electrophoresis DNA assay to determine the average size of detected library peaks and an estimation of molarity according to manufacturer’s protocols.
- Quantify libraries by qPCR, using primers designed against the adapter sequences in the generated libraries and use standards with a known concentration.
- Run qPCR reactions on a real-time instrument using the absolute quantitation settings according to manufacturer’s protocols.
- Use the size of libraries and the molar quantitation from qPCR to calculate the molar concentrations of the libraries.
- Run libraries on a capillary electrophoresis DNA sizing chip according to manufacturer’s protocols.
- Dilute libraries to 4 nM using 10 mM Tris-Cl with 0.1% Tween-20 at pH 8.5. Store libraries in a 96-well PCR plate sealed with heat-sealing film at -20 °C.
5. Sequencing Libraries Using a Benchtop Sequencer
- Thaw out and prepare reagents according to manufacturer’s instructions.
- Thaw 4 nM libraries on ice.
- Make 1 ml of 0.2 N NaOH in a 1.5 ml microcentrifuge tube.
- Pool 4 nM libraries in equal volume amounts, if multiple libraries are to be used.
- Dilute and denature pooled libraries according to manufacturer’s instructions to the desired final molar concentration.
- Keep diluted and denature pooled library on ice until ready to load on reagent cartridge.
- Generate a sample sheet containing sample names and corresponding index information and specify to generate .fastq files only.
- Load sample sheet in the corresponding sample sheet folder on the sequencer.
- Add a total of 600 µl diluted and denatured library to the reagent cartridge in the corresponding well.
- Run the sequencing reactions to completion.
6. Methylation Quantitation Data Analysis
NOTE: There are multiple programs available for NGS data analysis including both commercial and open source. Details on running programs can be found with each specific package. General instructions are given at each step along with the specific commands for this software package. (See Materials List for details on software used in this protocol).
- Import .fastq.gz files into appropriate sequencing analysis pipeline retaining quality scores (Qscores) for use in read trimming. (For this example program select ‘Import’ and select the sequencing method used to generate reads. Select .fastq.gz read files to import, and retain Qscores from .fastq files for read trimming applications by deselecting ‘Discard quality scores’ under ‘General Options’. Select a location for the imported reads and select ‘Finish’.)
- Trim and retain reads using the following settings in a NGS data analysis pipeline. (For this program select ‘Trim Sequences’ under ‘NGS Core Tools’, and select the reads to be trimmed.)
- Retain only reads containing ≥ Q30 scores. (For this program select ‘Trim using quality scores’ and set the limit to 0.001.)
- Retain only reads containing ≤ 1 ambiguous nucleotide. (For this program select ‘Trim ambiguous nucleotides’ and set the ‘maximum number of ambiguities’ to 1. Select a location to save trimmed reads and select ‘Finish’.)
- Map trimmed reads to the in silico bisulfite converted gene reference from 2.2. (For the example software select ‘Map Reads to Reference’ under ‘NGS Core Tools’. Select trimmed reads to be mapped and select ‘next’. Select the converted reference sequence and select ‘no masking’ under ‘reference masking’. Select ‘next’.)
- Assign a maximum penalty for mismatches, insertions, and deletions. Set parameters such that 100% of the read length is required to map with 90% sequence identity. For example software, assign a score of 3 for mismatches, insertions, and deletions. Assign a score of 1 for minimum fraction of read length mapped to reference, and assign a score of 0.9 for minimum fraction of identity between mapped read and reference.
- Discard or ignore non-specific reads mapped to reference. These reads can map equally well to multiple regions. For example software select ‘Ignore’ under ‘Non-specific match handling’ and select ‘next’.
- For alignment output generate each sample as an independent file. For example software, select ‘Create stand-alone read mappings’ under ‘Output options’ and ‘Save’ under ‘Result handling’. Select a location to save the read mapping and select ‘Finish’.
- Run a variant calling workflow on the mapped reads. For the example software, select ‘Probabilistic Variant Detection’ under ‘Resequencing Analysis’, select the read mapping to be analyzed and select ‘next’. Select ‘Ignore non-specific matches’ under ‘Read filters’ and select ‘next’.
- Ensure that the sequence is at a depth of ≥ 1000 X by setting the ‘minimum coverage’ under ‘Significance’ to 1,000.
- Ensure that the variant call is present in both forward and reverse reads. For example software, select ‘Require presence in both forward and reverse stands’ under ‘Variant filters’ and select ‘next’.
- Export aligned, variant called data as an annotated table. For example software, select ‘Create annotated table’ under ‘Output options’ and select a location to save the variant table file. Select ‘Finish’.
- Trim and retain reads using the following settings in a NGS data analysis pipeline. (For this program select ‘Trim Sequences’ under ‘NGS Core Tools’, and select the reads to be trimmed.)
- Calculate 5-mC percentage using the variant frequencies at annotated CpG sites in the region of interest from the variant table file. The frequency of cytosine at a reference C in CG is the 5-mC percentage.
NOTE: When using variant calling algorithms for highly methylated CpG’s, replace CpG cytosines with thymines. This will identify the mapped cytosine’s as variants, resulting in cytosine frequency at CpG’s. - Determine bisulfite conversion efficiency (bsc) by first calculating the percentage of C’s not in CpG sites in the reference (C). Multiply the percentage of non CpG C’s by number of total T’s mapped (Tmp), and divide by total C’s mapped at the reference T’s (CmpT). 100 minus the frequency calculated is the bisulfite conversion efficiency (bsc) of that library (Equation 1).

Equation 1. Bisulfite conversion efficiency.
NOTE: While mammalian genomes contain very low amounts of non-CpG cytosine methylation (with the exception potentially of stem cells20), plant genomes contain a significant amount. In order to determine bisulfite conversion efficiency in these reference genomes, a suitable route is to sequence a portion of the mitochondrial genome or chloroplast genome or known unmethylated genes present in plant genomes21 and calculating conversion efficiency as described above. Bisulfite conversion efficiency should be ≥98% in most cases, with the unconverted C’s potentially arising from non CpG methylation.
Representative Results
BSAS reads properly aligned to converted reference sequence will resemble Figure 5. CpG dinucleotides can clearly be identified and methylation states can be estimated by observing base calls at CpG sites in the mapped reads. For example, with methylation controls, 0% methylation will result in all the reads mapped to CpG sites containing T’s (Figure 5A). 100% methylation controls will result in all the reads mapped reads to CpG sites containing C’s (Figure 5B).
Quantitation of cytosine frequency (C/C+T) at CpG sites yields the methylation frequency in the original sample. A representative standard curve generated from whole genome methylation controls (n = 3/methylation ratio) shows linearity of methylation quantitation as well as precision in quantitation at each methylation ratio (Figure 6). As an example of this method in total, RNA and DNA were co-isolated from mouse cerebellum and retina (n=4/group). Rhodopsin expression, selectively expressed in retinal tissue, was measured using qPCR. Expression was only detected in retina (Figure 7A). Using BSAS, CpG methylation levels were quantified in the rhodopsin promoter region. Cumulative methylation levels across the promoter region were >80% in the cerebellum compared to <15% in the retina (p < 0.001, parametric t-test) (Figure 7B). BSAS methylation quantitation benefits from site-specific methylation quantitation, and methylation levels can be compared on a CpG-specific basis across any given genomic region. CpG methylation levels across the rhodopsin promoter were significantly higher in cerebellar samples when compared to retina samples (p <0.001, parametric t-test at each CpG site) (Figure 7C).
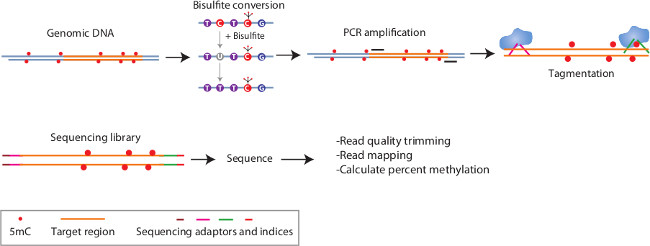
Figure 1: Schematic of BSAS method. In this method, genomic DNA is bisulfite converted to modify unmethylation cytosines to uracils. Subsequently, during PCR these uracils are changed to thymines. PCR amplification is directed against regions of interest and highly enriches for just these sequences. The resulting PCR amplicons are made into dual-indexed libraries through a simple tagmentation process. Subsequently the libraries are sequenced on a benchtop next generation sequencer and the sequencing reads are mapped to the in silico converted reference sequence and percent methylation of cytosine’s is determined in a base-specific manner.
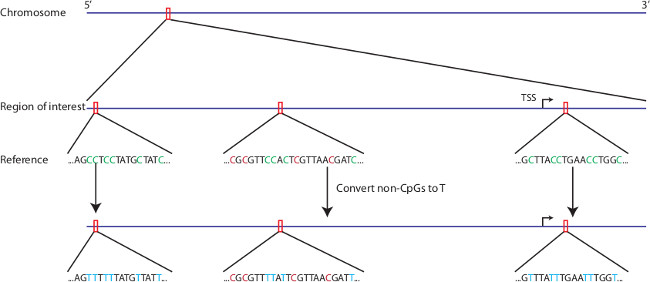
Figure 2: In silico bisulfite conversion of region of interest. Any region of interest from any genomic reference can be selected for in silico bisulfite conversion. Non-CpG cytosines are replaced with thymine’s in the reference sequence. CpG cytosines remain cytosines in the bisulfite converted reference.
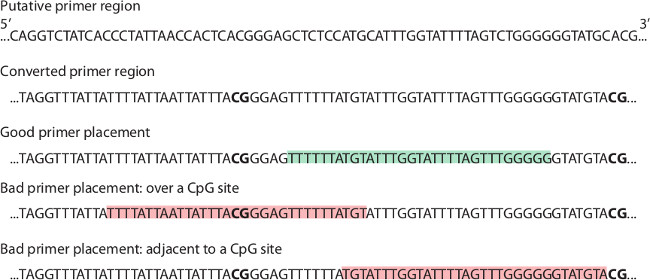
Figure 3: Primer placement. Bisulfite PCR primers are designed against an in silico bisulfite converted reference sequence. Primers are to be designed so they do not overlap CG dinucleotides or designed adjacent to CG dinucleotides.
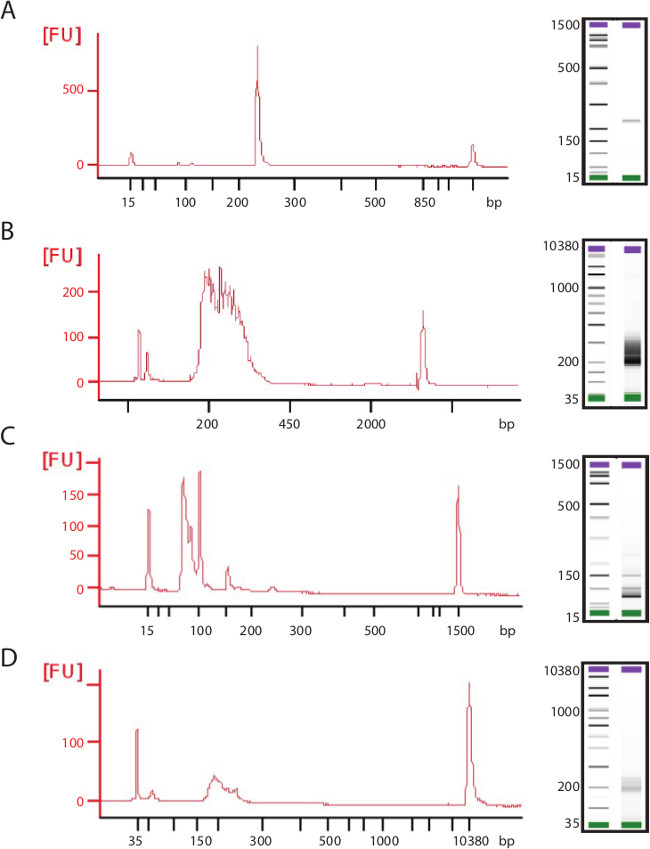
Figure 4: Examples of high and poor quality PCR amplicons and sequencing libraries. Representative electropherogram traces and gel show (A) ideal amplicon for transposome-mediated library generation with a single high concentration product. (B) Library generated from this amplicon shows high concentration and even size distribution. (C) Poor quality PCR amplicons can be low in size, concentration, and contain multiple products and/or primer dimers. These poor quality amplicons will lead to (D) failed library generation with low concentration and low size distribution.
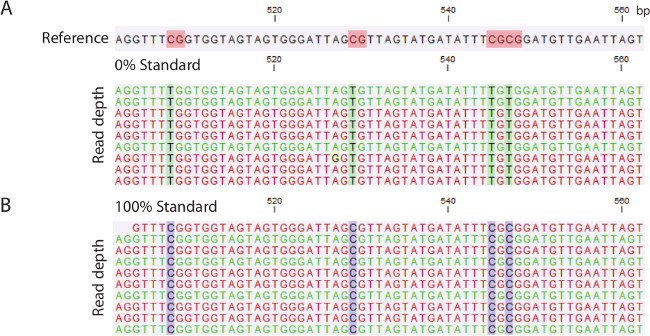
Figure 5: Examples of sequencing outputs from methylation controls. (A) In silico converted reference sequencing with CpG sites highlighted in red. 0% methylation control mapped reads to the selected region showing thymines (greed highlight) mapping at CpG sites. (B) 100% methylation control mapped reads show cytosine’s (blue highlight) mapping at CpG sites.
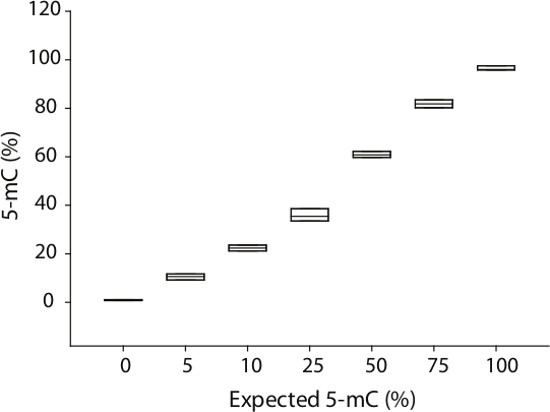
Figure 6: Methylation quantitation across a range of methylation controls. Whole genome methylation controls mixed at methylation ratios (n = 3/ratio) from 0% to 100% were quantified using BSAS. Plotting quantitation of expected versus quantified demonstrates linearity of methylation control quantitation. Across all controls, there was high precision in methylation quantitation.
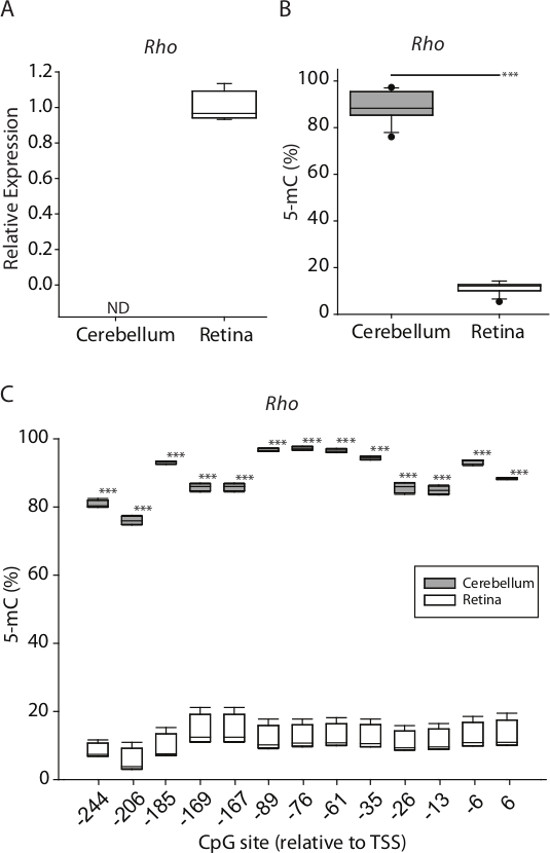
Figure 7: Example of paired DNA methylation and gene expression analysis from tissue samples. (A) Rhodopsin relative mRNA expression from mouse cerebellar and retinal tissue. (B) Rhodopsin average promoter methylation quantified by BSAS between cerebellar and retinal DNA (***p <0.001, parametric t-test). C) CpG site-specific methylation levels across rhodopsin promoter (-244 to +6, relative to transcription start site [TSS]) in mouse cerebellum and retina DNA.
Discussion
BSAS allows for focused, accurate DNA methylation quantitation with high throughput capabilities in both number of samples and number of targets. Additionally, this library generation using transposome-mediated tagmentation requires less input DNA, is quicker and contains fewer steps than traditional shearing and subsequent adapter ligation techniques. These improvements over existing methods allow for precise base-level DNA methylation analysis of any target of interest. Moreover, BSAS provides a new method for confirmation of regions of interest (differentially methylation regions (DMRs), CpG islands, regulatory regions) that have been identified using whole genome bisulfite22 or capture23 approaches. Using orthogonal confirmation approaches and more quantitatively precise methods improves the analytical rigor of epigenomic studies. The high read depth achieved with BSAS allows for accurate quantitation in a narrow confidence interval, resulting in precise quantitation16. Additionally, the ability to run many samples in a single experiment can increase the sample size for confirmations of whole genome methods, which will increase the statistical power; a weakness of many current epigenetic studies. Importantly, BSAS provides a base-specific CpG methylation quantitation, which allows for the generation of testable hypotheses for epigenetic research. Hypotheses such as increased methylation at a specific response element will result in decreased binding of a specific transcription factor. BSAS, combined with paired mRNA expression data, provides a method for obtaining both epigenetic regulation and mRNA expression within a single piece of tissue or cell population. Paired measurements of regulation and expression also increase the scientific rigor and impact of the findings.
Critical steps within the BSAS protocol include primer design, amplicon optimization, and library generation/QC. PCR bias is introduced if primers are not designed properly and amplify at different efficiencies8. The use of methylation standards, such as enzymatically generated 100% and 0% cytosine methylated standards, can be used to determine the degree, if any, of methylation quantitation bias, and is a proper methodological control when quantifying methylation16. Similarly, care should be taken when optimizing PCR reactions for generating a single high-quality amplicon. If no amplicon is present using the suggested guidelines detailed in the protocol, optimization steps include increasing PCR cycle numbers or bsDNA input amount. If there are multiple PCR products, including primer-dimers, optimization steps include decreasing bsDNA input amount, decreasing the PCR primer molar input concentrations, increasing annealing temperatures, or decreasing PCR cycle number. One or a combination of these optimization procedures yields sufficient results to generate a single high-quality amplicon. Alternatively, redesigning primers is a good approach for primer sets that do not yield a single amplicon. For those regions where redesign is not suitable or possible, degenerate primer sets including both cytosine’s and thymine’s at CpG sites in forward primers and adenine’s and guanine’s at CpG sites in reverse primers may work. However, these primer sets need further optimization to ensure no PCR bias is occurring, a process outside the scope of this protocol. Quality libraries are extremely important for success. Ensure that QC measures are carried out to determine size, quality and quantity of libraries before sequencing. Sequencing reactions are prone to failure with input of low-quality libraries. Bias in methylation quantitation can be mitigated by ensuring that methylation frequencies are present in both forward and reverse sequencing reads. Additionally, quality scores of bases aligning to CpG sites should be ≥Q30 for high confidence in quantitation. While others have shown previously little to no bias in tagmentation reactions of bisulfite converted DNA19, ensuring the metrics described above allows for confirmation of low bias methylation quantitation.
BSAS currently measures methylation at CpG sites, however, future expansions of this method will allow paired measurements of CpG 5-hmC with the addition of experimental steps distinguishing between 5-mC and 5-hmC such as introducing potassium perruthenate before bisulfite conversion24. This will increase the impact of BSAS utility by allowing for paired methylation, both 5-mC and 5-hmC, and expression data in order to determine gene expression regulatory roles of DNA methylation. Transposome-mediated library preparation of PCR amplicons does result in decreased sequencing depth at the ends of amplified regions. Therefore, regions of high interest should be designed to reside in the middle of amplicons. However, because BSAS generates sequencing read depths of >1,000 X, the quantitative accuracy of 5-mC measurements near the ends of amplified regions remains high.
Disclosures
The authors have nothing to disclose.
Acknowledgements
The authors thank Colleen Van Kirk for mouse retina and cerebellum samples, and Peter Gregory for figure generation. The authors also thank Dr. Allison Gillaspy and the Laboratory for Molecular Biology and Cytometry Research core for access to the MiSeq. This work was supported by NIH grants DA029405, EY021716, and AG026607 and the Donald W. Reynolds Foundation.
Materials
| Name | Company | Catalog Number | Comments |
| Name | Company | Cat # | Comments |
| Agilent 2100 Bioanlyzer | Agilent | G29393AA | |
| Agilent RNA 6000 Nano kit | Agilent | 5067-1511 | |
| Agilent High Sensitivity DNA kit | Agilent | 5067-4626 | |
| Typhoon 9200 | Amersham/GE Healthcare Life Sciences | ||
| Agencourt AMPure XP - PCR Purification | Beckman Coulter | A63880 | 5 mL |
| PowerPac Basic Power Supply | Bio Rad | 164-5050 | |
| twin.tech PCR plate 96 | Eppendorf | 951020362 | semi-skirted |
| Heatsealing Film | Eppendorf | 0030127838 | |
| Heatsealing Foil | Eppendorf | 0030127854 | |
| Heat Sealer | Eppendorf | 5390000.024 | |
| 0.1-10ul Tips | Eppendorf | 0030073.002 | |
| 2-200ul Tips | Eppendorf | 0030073.045 | |
| 50-1000ul Tips | Eppendorf | 0030073.100 | |
| MixMate | Eppendorf | 5353000.014 | |
| 1.5 mL Microcentrifuge Tubes | Eppendorf | 0030121.023 | |
| Centrifuge 5424 | Eppendorf | 5424000.010 | |
| 2.0 mL Microcentrifuge Tube | Eppendorf | 022363352 | |
| Nextera XT DNA Sample Preparation Kit | Illumina | FC-131-1024 | 24 rxn |
| Nextera XT Index Kit | Illumina | FC-131-1001 | 24 indexes |
| MiSeq Desktop Sequencer | Illumina | ||
| MiSeq Reagent Kit v2 | Illumina | MS-102-2002 | 300cycle |
| KAPA SYBR FAST Universal qPCR kit | KAPA Biosystems | KK4824 | |
| Quant-iT PicoGreen dsDNA Assay kit | Life Technologies | P7589 | |
| Quant-iT RiboGreen RNA Assay kit | Life Technologies | R11490 | |
| ProFlex 96-well PCR system | Life Technologies | 4484075 | |
| Novex 6% TBE DNA gel | Life Technologies | EC6261BOX | 10-well |
| Novex TBE Running Buffer | Life Technologies | LC6675 | 5X (1 L) |
| Novex Hi-Density TBE Sample Buffer | Life Technologies | LC6678 | 5X (10 mL) |
| 1 Kb Plus DNA Ladder | Life Technologies | 10787-018 | |
| Xcell SureLock Mini-Cell | Life Technologies | EI0001 | |
| UltraPure 10mg/mL Ethidium Bromide | Life Technologies | 15585-011 | |
| 7900HT Fast Real-Time PCR system | Life Technologies | 4329001 | 384well block |
| DynaMag-96 Side Skirted | Life Technologies | 12027 | |
| SpectroMax M2 Multi-Mode Microplate Reader | Molecular Devices/VWR | 89429-532 | |
| AllPrep DNA/RNA Mini Kit | Qiagen | 80204 | |
| Stainless Steel Beads | Qiagen | 69989 | 5 mm |
| CLC Genomics Workbench | Qiagen | Software for methylation pipeline | |
| QIAQuick PCR Purification kit | Qiagen | 28104 | 50 rxn |
| TissueLyser II | Retsch/Qiagen | 85300 | |
| Nuclease-Free Water | Sigma | W4502 | |
| TRIS hydrochloride | Sigma | PHG0002-100G | |
| Tween-20 | Sigma | P9416-50ML | |
| NanoDrop 2000 | Thermo Scientific | ||
| 384-well Full-Skirted Plate, Standard | Thermo Scientific | AB-1384 | |
| Absolute qPCR Seal | Thermo Scientific | AB-1170 | |
| EZ DNA Methylation-Lightning kit | Zymo Research | D5030 | 50 rxn |
| ZymoTaq DNA Polymerase | Zymo Research | E2001 | 50 rxn |
References
- Hotchkiss, R. D. The quantitative separation of purines, pyrimidines, and nucleosides by paper chromatography. The Journal of Biological Chemistry. 175 (1), 315-332 (1948).
- Bird, A. DNA methylation patterns and epigenetic memory. Genes & Development. 16 (1), 6-21 (2002).
- Smith, Z. D., Meissner, A. DNA methylation: roles in mammalian development. Nature reviews. Genetics. 14 (3), 204-220 (2013).
- Heard, E., Martienssen, R. A. Transgenerational epigenetic inheritance: myths and mechanisms. Cell. 157 (1), 95-109 (2014).
- Baylin, S. B. DNA methylation and gene silencing in cancer. Nature Clinical Practice. Oncology. 2, S4-S11 (2005).
- Baylin, S. B. The cancer epigenome: its origins, contributions to tumorigenesis, and translational implications. Proceedings of the American Thoracic Society. 9 (2), 64-65 (2012).
- Beck, S., Rakyan, V. K. The methylome: approaches for global DNA methylation profiling. Trends in Genetics : TIG. 24 (5), 231-237 (2008).
- Laird, P. W. Principles and challenges of genomewide DNA methylation analysis. Nature reviews. Genetics. 11 (3), 191-203 (2010).
- Mikeska, T., et al. Optimization of quantitative MGMT promoter methylation analysis using pyrosequencing and combined bisulfite restriction analysis. The Journal of Molecular Diagnostics : JMD. 9 (3), 368-381 (2007).
- Kreutz, M., Hochstein, N., Kaiser, J., Narz, F., Peist, R., et al. Pyrosequencing: powerful and quantitative sequencing technology. Current Protocols In. Molecular Biology / edited by Frederick M. Ausubel ... [et al.]. 104 (Unit 7 15), (2013).
- Dikow, N., et al. Quantification of the methylation status of the PWS/AS imprinted region: comparison of two approaches based on bisulfite sequencing and methylation-sensitive MLPA. Molecular And Cellular Probes. 21 (3), 208-215 (2007).
- Parrish, R. R., Day, J. J., Lubin, F. D., et al. Direct bisulfite sequencing for examination of DNA methylation with gene and nucleotide resolution from brain tissues. Current Protocols In Neuroscience / editorial board, Jacqueline N. Crawley ... [et al.]. 7 (Unit 7 24), (2012).
- Shapiro, R., Servis, R. E., Welcher, M. Reactions of uracil and cytosine derivatives with sodium bisulfite. A specific deamination method. Journal of the American Chemical Society. 92, 422-424 (1970).
- Hayatsu, H., Wataya, Y., Kazushige, K. The addition of sodium bisulfite to uracil and to cytosine. Journal of the American Chemical Society. 92 (3), 724-726 (1970).
- Wang, R. Y., Gehrke, C. W., Ehrlich, M. Comparison of bisulfite modification of 5-methyldeoxycytidine and deoxycytidine residues. Nucleic Acids Research. 8 (20), 4777-4790 (1980).
- Masser, D. R., Berg, A. S., Focused Freeman, W. M. high accuracy 5-methylcytosine quantitation with base resolution by benchtop next-generation sequencing. Epigenetics & Chromatin. 6 (1), 33 (2013).
- Caruccio, N. Preparation of next-generation sequencing libraries using Nextera technology: simultaneous DNA fragmentation and adaptor tagging by in vitro transposition. Methods in Molecular Biology. 733, 241-255 (2011).
- Quail, M. A., et al. A tale of three next generation sequencing platforms: comparison of Ion Torrent, Pacific Biosciences and Illumina MiSeq sequencers. BMC Genomics. 13, 341 (2012).
- Adey, A., Shendure, J. U. l. t. r. a. -. l. o. w. -. i. n. p. u. t. tagmentation-based whole-genome bisulfite sequencing. Genome Research. 22 (6), 1139-1143 (2012).
- Smallwood, S. A., et al. Single-cell genome-wide bisulfite sequencing for assessing epigenetic heterogeneity. Nature Methods. 11 (8), 817-820 (2014).
- Wang, J., et al. Universal endogenous gene controls for bisulphite conversion in analysis of plant DNA methylation. Plant Methods. 7, 39 (2011).
- Lister, R., et al. Human DNA methylomes at base resolution show widespread epigenomic differences. Nature. 462 (7271), 315-322 (2009).
- Ivanov, M., et al. In-solution hybrid capture of bisulfite-converted DNA for targeted bisulfite sequencing of 174 ADME genes. Nucleic Acids Research. 41 (6), e72 (2013).
- Booth, M. J., et al. Oxidative bisulfite sequencing of 5-methylcytosine and 5-hydroxymethylcytosine. Nature Protocols. 8 (10), 1841-1851 (2013).
Reprints and Permissions
Request permission to reuse the text or figures of this JoVE article
Request PermissionThis article has been published
Video Coming Soon
ABOUT JoVE
Copyright © 2025 MyJoVE Corporation. All rights reserved