Analysis of Cardiomyocyte Development using Immunofluorescence in Embryonic Mouse Heart
In This Article
Summary
Mutations that lead to congenital heart defects benefit from in vivo investigation of cardiac structure during development, but high-resolution structural studies in the mouse embryonic heart are technically challenging. Here we present a robust immunofluorescence and image analysis method to assess cardiomyocyte-specific structures in the developing mouse heart.
Abstract
During heart development, the generation of myocardial-specific structural and functional units including sarcomeres, contractile myofibrils, intercalated discs, and costameres requires the coordinated assembly of multiple components in time and space. Disruption in assembly of these components leads to developmental heart defects. Immunofluorescent staining techniques are used commonly in cultured cardiomyocytes to probe myofibril maturation, but this ex vivo approach is limited by the extent to which myocytes will fully differentiate in culture, lack of normal in vivo mechanical inputs, and absence of endocardial cues. Application of immunofluorescence techniques to the study of developing mouse heart is desirable but more technically challenging, and methods often lack sufficient sensitivity and resolution to visualize sarcomeres in the early stages of heart development. Here, we describe a robust and reproducible method to co-immunostain multiple proteins or to co-visualize a fluorescent protein with immunofluorescent staining in the embryonic mouse heart and use this method to analyze developing myofibrils, intercalated discs, and costameres. This method can be further applied to assess cardiomyocyte structural changes caused by mutations that lead to developmental heart defects.
Introduction
During development, heart contractions begin soon after cardiomyocytes migrate to the midline and form the linear heart tube1,2. The sarcomere is the basic contractile unit within the cardiomyocyte; this highly organized cytoskeletal structure contains actin filaments anchored to the Z-disc by sarcomeric α-actinin (s-α-actinin) and myosin fibers anchored to the M line (Figure 1). As the cardiomyocyte matures, sarcomeres assemble in series to form myofibrils that extend across the cell. Myofibrils are anchored to the ends of the cardiomyocyte by the intercalated disc, the cell-cell junctional structure that contains a transitional junction with a subset of Z-disc elements such as s-α-actinin3, adherens junction proteins such as N-cadherin and β catenin, gap junction proteins, and desmosomes (Figure 1)4. Along the longitudinal membrane, the Z-discs of peripheral myofibrils also attach to the cell membrane via costameres; these specialized focal adhesions provide an anchor between the myofibril, plasma membrane, and extracellular matrix to provide additional structural support to the cardiomyocyte (Figure 1)4. Early in heart development, cardiomyocytes are arranged in finger-like projections known as trabeculae that protrude into the ventricular space and contain relatively mature myofibrils5. As heart development proceeds, the cardiomyocytes in the sub-epicardial region proliferate to form the compact myocardium that comprises the ventricular walls, but sarcomere and myofibril assembly are delayed as compared with trabecular myocardium5,6.
Models of sarcomere and myofibril assembly come largely from immunofluorescence studies on cultured cardiomyocytes7-10, which are straightforward but lack a three-dimensional environment, blood flow, and contacts with other cardiac cells present in vivo. High-resolution structural studies using immunofluorescence in the mouse embryonic heart are technically challenging, and few studies have explored the emergence of intercalated discs and costameres during mouse cardiac development. The adherens junction protein β catenin appears to localize to intercalated discs by embryonic day (E) 17.511, N-cadherin localizes to linear structures that may represent intercalated discs by E18.512 versus postnatal day 013, and costameres have been detected at E18.514, but these proteins display diffuse and more continuous membrane distribution at earlier developmental time points11-13.
Here, we describe a straightforward and reproducible method for immunostaining and fluorescence microscopy of sectioned mouse embryonic hearts that allows for detailed analysis of myofibril and cardiomyocyte development, including the emergence of intercalated discs as early as E12.5 and nascent costameres at E16.5. This protocol may be useful for probing the effects of mutations on sarcomere formation as well as myofibril and cardiomyocyte maturation.
Protocol
NOTE: All experimental procedures were approved by the UCSF Institutional Animal Care and Use Committee.
1. Cryopreservation and Fixation of Embryonic Mouse Hearts.
1.1) Snap-freezing embryonic hearts
- Fill a 3.5 cm petri dish and 7 mm cryomolds with Optimal Cutting Temperature (OCT) medium (see Materials Table). In a chemical hood, cool 2-methylbutane in liquid nitrogen.
- Dispense 30 ml of phosphate buffered saline (PBS) into 10 cm petri dishes, 10 ml of PBS into 3.5 cm petri dishes, and place all petri dishes on ice. Prepare one 10 cm dish and several 3.5 cm dishes per pregnant mouse.
- Isolate embryos as previously described15, performing the dissection in ice-cold PBS.
- Briefly, euthanize the pregnant female using CO2 narcosis and cervical dislocation.
- Make an incision in the abdomen, dissect out the uterus by cutting the vessels along the inner curvature of the uterus, and transfer the uterus to a 10 cm petri dish containing ice-cold PBS.
- Cut the uterus in between each embryo and transfer to an individual 3.5 cm Petri dish containing ice-cold PBS. Isolate each embryo as described15.
- Open the pericardial cavity using fine forceps, remove the heart away from the lungs and vasculature by cutting at the aorta, inferior vena cava, and pulmonary veins, and transfer into the 3.5 cm petri dish containing OCT.
- Let the heart equilibrate in OCT for several seconds, then transfer the heart into the 7 mm mold containing OCT. Orient the anterior wall of the heart to the bottom of the mold.
- Gently place the mold into liquid nitrogen-cooled 2-methylbutane. Take care not to allow 2-methylbutane liquid to touch the OCT or heart. Freeze until the OCT is solid white, then transfer the mold to an ice bucket containing dry ice. Move on to the next embryo.
- Wrap cryomolds in foil and store at -80 °C until ready for cryosectioning.
1.2) Alternative: Paraformaldehyde (PFA) fixing, cryoprotecting, and OCT embedding embryonic hearts
- Fill the wells of a 12-well tissue culture plate with 4% PFA in 1x PBS.
- Dissect out the embryonic hearts as described in 1.1.3. Place each heart into a well containing 4% PFA and fix at 4 °C O/N.
- Cryoprotection: using a plastic transfer pipette, move each heart to an 1.5 ml microcentrifuge tube containing 1.5 ml of 15% sucrose in PBS and gently agitate at 4 °C until the heart sinks to the bottom of the tube (several hours to O/N). Transfer each heart to a 1.5 ml microcentrifuge tube containing 1.5ml of 30% sucrose in PBS and gently agitate at 4 °C again until the heart sinks to the bottom of the tube (several hours to O/N).
- Using a plastic transfer pipette, place the cryoprotected heart into OCT and let it equilibrate for several minutes to remove excess sucrose, then transfer the heart into the 7 mm mold containing OCT. Orient the anterior wall of the heart to the bottom of the mold.
- Freeze the heart in OCT by placing the mold in either liquid nitrogen-cooled 2-methylbutane or dry ice.
- Wrap cryomolds in foil and store at -80 °C until ready for cryosectioning.
2. Cryosectioning
- Set cryostat temperature to -17 °C.
- Place cryomolds into the cryostat chamber and equilibrate to temperature for 15-20 min.
- Invert the cryomold and use gentle pressure to expel the heart block from the mold. Orient the anterior wall of the heart to the top of the molded tissue block.
- Place a large drop of OCT onto the chuck, and mount the heart block onto the OCT drop to freeze onto the chuck. Keep the orientation such that the anterior wall of the heart is furthest from the chuck.
- Load the chuck and mounted heart block onto the cryostat object holder. Adjust so that the angle of the blade is 3-5° relative to the sample.
- Collect 10 µm sections onto microscope slides that have been pre-treated with a positively charged coating (see Materials Table). Allow to dry completely before storing at -80 °C.
3. Immunofluorescence
- For snap-frozen sections, fix and permeabilize tissue in acetone for 10 min in a fume hood at RT.
- For snap-frozen and PFA-fixed sections, incubate in PBS-0.1% Triton X-100 for 20 min to remove OCT and to permeabilize PFA-fixed sections.
- Block for 45 min in 1x blocking buffer, diluted in PBS.
- If using a primary antibody generated in mouse, incubate in donkey or goat anti-mouse IgG (H+L) monovalent Fab fragment diluted 1:100 in PBS-0.1% Tween 20 for 45 min at RT (see Discussion).
- Incubate in primary antibody or antibodies diluted in 1x blocking buffer for 2 hr at RT or O/N at 4 °C (see Table of Materials/Equipment for specific dilutions).
- Wash sections in 1x PBS three times for 10 min at RT.
- Incubate in Alexa Fluor-conjugated secondary antibody diluted 1:500 in blocking buffer for 2 hr at RT, protected from light.
- Wash sections in 1x PBS three times for 10 min at RT, protected from light.
- Optional: Incubate in Hoechst dye diluted 1:2,000 in PBS at RT (protected from light) to label nuclei, then rinse with PBS.
- Post-fix labeled sections in 1% PFA for 1 min at RT.
- Mount slides in anti-fade medium (with DAPI if nuclei are not already labeled) by placing two drops of medium on each end of the slide and then covering with a coverslip. Seal coverslips with nail polish. Store protected from light at 4 °C until ready to image.
4. Confocal Imaging and Image Analysis
- Turn on the appropriate laser wavelengths, camera, and confocal microscope including stage mover and z motor. Launch the imaging software program. Use the 405, 488, and 561 laser wavelengths for imaging Hoechst-, Alexa 488-, and Alexa 568-stained sections, respectively.
NOTE: See Materials Table for our hardware and software specifications. - Mount the control slide (coverslip down for an inverted microscope) on the slide stage.
- Using the 4X objective (see Materials Table), find the sample and area of interest. Capture the image to use as a map when imaging at high magnification.
- Remove the slide, making minimal adjustments to the slide stage. Change to the 60x oil immersion objective (see Materials Table), place a small drop of oil on the objective, and replace the slide (coverslip down) onto the slide stage.
- Find sample again. Set the laser power, exposure time, and binning to the desired levels for each channel.
NOTE: We generally use laser power of 0.8, camera exposure time of 100 msec, and binning of 2 (see Materials Table for hardware and software specifications); optimal settings need to be empirically determined for each experiment.- Once optimal settings are determined, use the same settings for all tissue sections within the experiment. Use the intensity histogram to note the optimal intensity range for each channel (this information will be used for analysis).
- Generate a z stack using the acquisition function: select the appropriate laser channels, then choose the upper and lower limits of the z stack. Choose a z stack step size that is one-half the value of the optical slice thickness provided by the software. Click “run” to collect the images.
- Use Fiji16 or a comparable program for image analysis. Within Fiji, open the z stack file with Custom color mode option and the channels split into separate windows. Open the “Adjust Brightness/Contrast” tool from the Image pulldown menu; within each channel, set the optimal histogram intensity range determined in 4.5.1. Apply these channel ranges to all z stacks being analyzed.
- Merge the individual channels into a single composite image using Image->Color pulldown menu.
- Create a flattened z stack from the composite image using the Image->Stacks->z project menu. This image will be significantly brighter than the 3D image; adjust the histogram intensity range for the control sample to avoid oversaturation, and apply the same settings to the experimental flattened z stack.
- To generate a 3D image, first use the Image->Stacks->3D project menu 17. Choose either the x-axis or y-axis of rotation. Set the slice spacing as the same number of microns as the z stack step size. Choose the desired total rotation and set the rotation angle increment to 1. Then open the Image J 3D Viewer from the Plugins pulldown menu. Choose the composite image generated in 4.8, display as Volume, and set the Resampling factor to 1 or 2.
Representative Results
Figures 2 through 6 show typical results for co-staining of different proteins in a snap-frozen and acetone-fixed heart. The antibody against s-α-actinin reproducibly labeled Z-discs and intercalated discs with high specificity and minimal background (Figures 2A, 3A, 4A, 5A, 6A, and 6C); Figure 6 demonstrates that the anti-mouse IgG (H+L) monovalent Fab fragment effectively blocks endogenous mouse IgG binding by anti-mouse secondary antibodies. The antibody against adherens junction protein β catenin bound the membrane of both cardiomyocytes and non-cardiomyocyte cells, and co-localization with s-α-actinin occurred in presumed intercalated discs at E16.5 (Figure 2C and D), as expected from the β catenin staining pattern in the adult heart18. β1 integrin immunofluorescence in the embryonic heart is especially challenging and often fails to identify focal adhesions14, but β1 integrin staining in these studies revealed signal with the same periodicity as s-α-actinin-labeled Z-discs, possibly reflecting nascent costameres forming at E16.5 (Figure 3D).
At E12.5, s-α-actinin and tropomyosin (sarcomere thin filament protein) immunofluorescence revealed a staining pattern with regular periodicity in trabecular cardiomyocytes consistent with mature myofibrils in these cells (Figures 4A and 5A for s-α-actinin; Figure 4B for tropomyosin). N-cadherin staining in trabecular cardiomyocytes at E12.5 hearts tended to colocalize with areas of intense s-α-actinin staining (Figure 5B-D and Figure 6A-C) possibly representing intercalated discs. In contrast to trabecular myocytes, s-α-actinin in the compact zone was more punctate than linear, and tropomyosin staining was diffuse rather than linear (Figure 4A and 4B). Thus, sarcomere assembly may occur later in compact compared to trabecular myocardium. Furthermore, differential patterns of s-α-actinin and tropomyosin in the compact zone suggest that s-α-actinin organizes into puncta and immature Z-discs early, while tropomyosin incorporation into the thin filament may be a later event in myofibril assembly.
Figure 7, Movie 1, and Movie 2 demonstrate typical results from a PFA-fixed E12.5 embryonic heart. In these examples, a LifeAct-RFPruby transgenic embryo was used for imaging; the LifeAct-RFPruby transgene19 labels filamentous actin but requires PFA fixation. Z-discs labeled with s-α-actinin were easy to visualize in most areas, but the signal-to-noise ratio was decreased compared to snap-frozen heart sections (Figure 7A); this signal was typical for s-α-actinin immunofluorescence in PFA-fixed tissue, in which epitopes may be masked by protein cross-links. Figure 7B shows co-visualization of filamentous actin and immunolabeled s-α-actinin within myofibrils (arrowheads) and filamentous actin within endocardial cells adjacent to trabecular myocytes (arrows). Three-dimensional image reconstruction revealed additional details: individual cardiomyocytes were more easily discerned, myofibrils within a cardiomyocyte were roughly parallel to one another, but individual cardiomyocytes were oriented at varying angles to one another (Figure 7C and D, Movie 1, and Movie 2). The close approximation between endocardial cells and cardiomyocytes was better appreciated in the three-dimensional views as well.
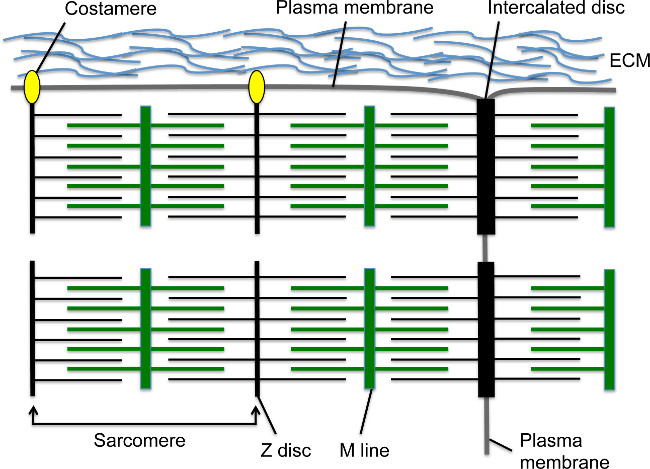
Figure 1. Cardiomyocyte sarcomeres, intercalated discs, and costameres. The Z-disc anchors actin filaments, while the M line anchors myosin fibers, which overlap the actin filaments. The sarcomere comprises one Z-disc – M line – Z-disc unit. Multiple sarcomeres in series create a myofibril. The lateral end of the myofibril inserts into the transverse border of the cardiomyocyte at a specialized cell-cell junctional structure called the intercalated disc. Peripheral myofibrils connect to the longitudinal cardiomyocyte plasma membrane via costameres, which form focal adhesions with the extracellular matrix between cardiomyocytes. Please click here to view a larger version of this figure.
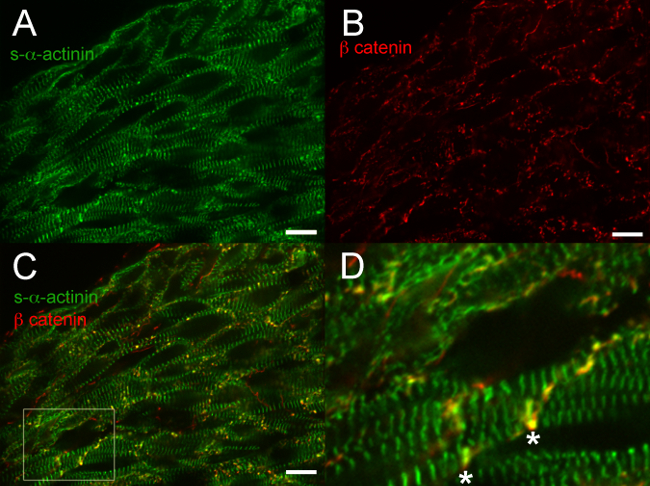
Figure 2. s-α-actinin and β catenin immunofluorescence at embryonic day 16.5. The heart was excised, snap frozen, cryosectioned, acetone-fixed, and immunostained using (A) mouse monoclonal clone EA53 antibody against s-α-actinin, which labeled cardiomyocyte Z-disc and intercalated discs, and (B) rabbit polycloncal antibody against the adherens junction protein β catenin. (C) Merged images show s-α-actinin and β catenin staining. (D) Magnified area of interest from panel C; asterisks mark presumed intercalated discs with co-localization of s-α-actinin and β catenin. Images were obtained from the peripheral left ventricular wall or compact myocardium, with the epicardial layer at the upper left of panels A-C. Intensity histogram display range 460-1600 (out of possible 0-65535) for both the s-α-actinin/488 nm and β catenin/561 nm laser channels. Scale bar 10 µm. Please click here to view a larger version of this figure.
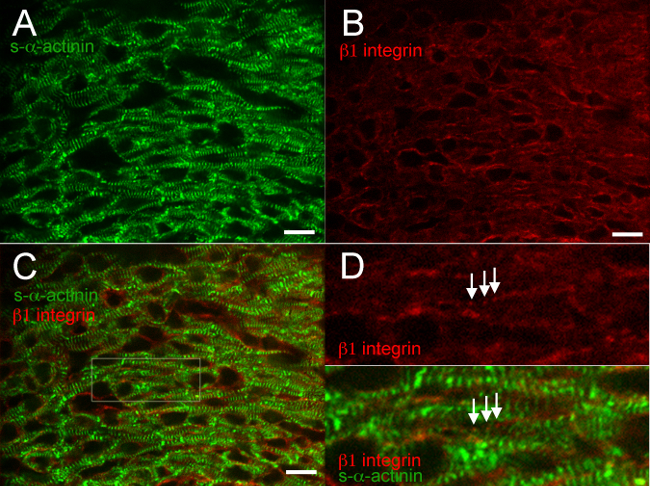
Figure 3. s-α-actinin and β1 integrin immunofluorescence at embryonic day 16.5. The heart was excised, snap frozen, cryosectioned, acetone-fixed, and immunostained using (A) mouse monoclonal clone EA53 antibody against s-α-actinin and (B) goat polyclonal antibody against the focal adhesion protein β1 integrin. (C) Merged images show β1 integrin in cardiomyocyte as well as non-cardiomyocyte cells. Note both diffuse and punctate β1 integrin signal in cardiomyocytes. (D) Magnified area of interest from panel C. Note punctate, periodic β1 integrin staining (arrows) with periodicity similar to nearby s-α-actinin-staining in Z-discs; these structures may represent costameres. Images were obtained from the left ventricular compact myocardium. Intensity histogram display range 460-1200 (out of possible 0-65535) for the s-α-actinin/488 nm laser channel and 460-600 for the β1 integrin/561 nm laser channel. Scale bar 10 µm. Please click here to view a larger version of this figure.
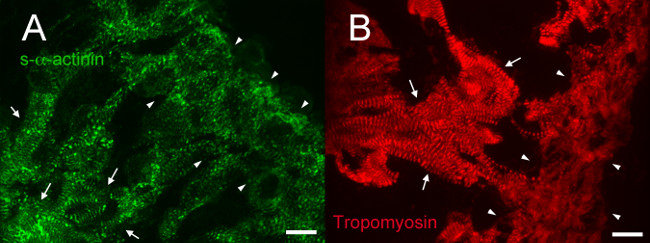
Figure 4. s-α-actinin and tropomyosin immunofluorescence at embryonic day 12.5: myofibril organization in trabecular and compact myocardium. Hearts from littermate embryos were excised, snap frozen, cryosectioned, acetone-fixed, and immunostained using (A) mouse monoclonal clone EA53 antibody against s-α-actinin and (B) mouse monoclonal antibody against the myofibril thin filament protein tropomyosin (Developmental Studies Hybridoma Bank CH1). Trabecular (arrows) and compact myocardium (arrowheads) are indicated. Note linear s-α-actinin staining with regular periodicity in the trabecular myocardium, compared to a range of staining patterns including puncta as well as linear staining in the compact layer (A). Note also linear tropomyosin staining with regular periodicity in the trabecular myocardium but more diffuse staining in compact myocardium. Intensity histogram display range 460-1,400 (out of possible 0-65535) for the s-α-actinin channel and 460-1,000 for the tropomyosin channel. Scale bar 10 µm. Please click here to view a larger version of this figure.
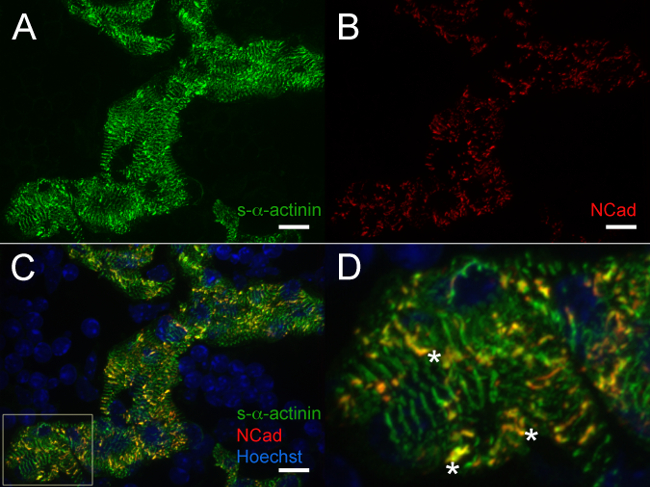
Figure 5. s-α-actinin and N-cadherin immunofluorescence at embryonic day 12.5: myofibrils and intercalated discs in trabecular cardiomyocytes. The heart was excised, snap frozen, cryosectioned, acetone-fixed, and immunostained using (A) mouse monoclonal clone EA53 antibody against s-α-actinin and (B) rabbit polyclonal antibody against the focal adhesion protein N-cadherin. 0.2 µm optical slices were collected as a z stack, and z stacks were flattened to generate the images. (C) Merged flattened stacks show both N-cadherin and s-α-actinin staining within trabecular cardiomyocytes as well as nuclei labeled with Hoechst dye. (D) Magnified area of interest from panel C; asterisks mark intercalated discs with co-localization of s-α-actinin and N-cadherin. Intensity histogram display range 470-1,200 (out of possible 0-65535) for the Hoechst/405 nm laser channel and 470-2,000 for both the s-α-actinin/488 nm and N-cadherin/561 nm laser channels. Scale bar 10 µm. Please click here to view a larger version of this figure.
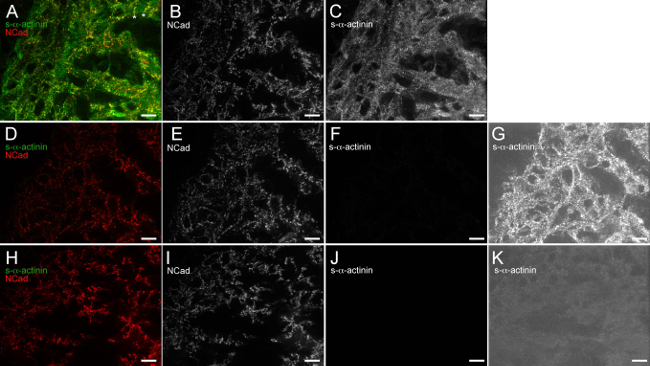
Figure 6. Anti-mouse IgG (H+L) monovalent Fab fragment effectively blocks endogenous mouse IgG binding by anti-mouse secondary antibodies. The E12.5 embryonic heart was excised, snap frozen, cryosectioned, acetone-fixed, and immunostained. (A-C) Sections were blocked with 1x blocking buffer followed by anti-mouse IgG monovalent Fab fragment, exposed to mouse monoclonal clone EA53 primary antibody against s-α-actinin and rabbit polyclonal primary antibody against N-cadherin, washed, and exposed to Alexa Fluor 488 anti-mouse and Alexa Fluor 586 anti-rabbit secondary antibodies. (A) Merged image using intensity histogram display range 480-2500 (out of possible 0-65535). Asterisks note regions in which N-cadherin signal is restricted to the transverse end of trabecular cardiomyocytes, which likely represents nascent intercalated discs. (B) N-cadherin-only channel using intensity histogram display range 480-2,500. (C) s-α-actinin-only channel using intensity histogram display range 480-2,500. (D-G) Sections were blocked with 1x blocking buffer only (no anti-mouse IgG monovalent Fab fragment blocking step), exposed to rabbit polyclonal primary antibody against N-Cadherin only (no mouse monoclonal primary antibody), washed, and exposed to Alexa Fluor 488 anti-mouse and Alexa Fluor 586 anti-rabbit secondary antibodies. (D) Merged image using intensity histogram display range 480-2500. (E) N-cadherin-only channel using intensity histogram display range 480-2500. (F) s-α-actinin-only channel using intensity histogram display range 480-2,500. (G) s-α-actinin-only channel using high-sensitivity intensity histogram display range 480-530, which reveals background detection of endogenous mouse IgG in the absence of the anti-mouse IgG monovalent Fab fragment blocking step. (H-K) Sections were blocked with 1x blocking buffer followed by anti-mouse IgG monovalent Fab fragment, exposed to rabbit polyclonal primary antibody against N-Cadherin (no mouse monoclonal primary antibody), washed, and exposed to Alexa Fluor 488 anti-mouse and Alexa Fluor 586 anti-rabbit secondary antibodies. (H) Merged image using intensity histogram display range 480-2,500. (I) N-cadherin-only channel using intensity histogram display range 480-2,500. (J) s-α-actinin-only channel using intensity histogram display range 480-2,500. (K) s-α-actinin-only channel using high-sensitivity intensity histogram display range 480-530, which demonstrates the lack of background endogenous mouse IgG detection when the anti-mouse IgG monovalent Fab fragment blocking step is used. Please click here to view a larger version of this figure.
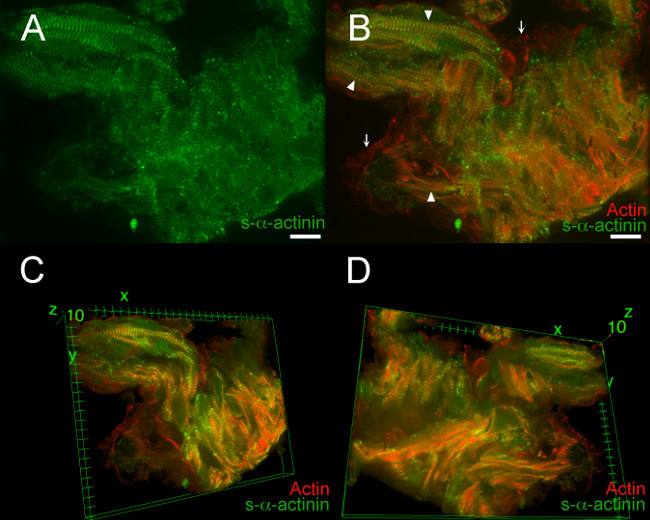
Figure 7. s-α-actinin and actin organization in trabecular cardiomyocytes at embryonic day 12.5. The LifeAct-RFPruby transgenic mouse line was used to visualize filamentous actin19, while the mouse monoclonal clone EA53 antibody against s-α-actinin was used to label Z-discs and intercalated discs. Embryos were PFA-fixed. 0.2 µm optical slices were collected as a z stack. (A) Flattened z stack shows that s-α-actinin staining was more diffuse in PFA-fixed tissue than in snap-frozen and acetone fixed sections (Figures 2-5). (B) Flattened z stack shows both filamentous actin and s-α-actinin. Filamentous actin fluorescence localized between Z-discs within myofibrils (arrowheads). Filamentous actin fluorescence was also seen in endocardial cells that line the trabecular myocytes (arrows). (C) Three-dimensional view of the trabecular cardiomyocytes, as viewed from the top of the stack. (D) Three-dimensional view of the trabecular cardiomyocytes, as viewed from the bottom of the stack. Intensity histogram display range 470-900 (out of possible 0-65535) for both the 488 nm laser channel and for the 561 nm laser channel in A and B; display range 460-800 for both channels in C and D. Scale bar 10 µm. Please click here to view a larger version of this figure.
Movie 1. 360° rotational 3D view of s-α-actinin and actin organization in trabecular cardiomyocytes at embryonic day 12.5. The image stack from Figure 6 was rendered in three dimensions using the Image J 3D Viewer plugin within the Fiji image analysis program. Intensity histogram display range 470-800 (out of possible 0-65535) for both the 488 nm and 561 nm laser channels.
Movie 2. Selected 3D views of s-α-actinin and actin organization in trabecular cardiomyocytes at embryonic day 12.5. The image stack from Figure 6 was rendered in three dimensions using the Image J 3D Viewer plugin within the Fiji image analysis program. Small rotations around the x, y, and z axes showed relatively aligned myofibrils within cardiomyocytes but poor alignment between most cardiomyocytes. Small rotations also demonstrated the close approximation of endocardial cells lacking s-α-actinin around cardiomyocytes. Intensity histogram display range 470-800 (out of possible 0-65535) for both the 488 nm and 561 nm laser channels.
Discussion
The optimal tissue fixation technique and dilution must be empirically determined for each antibody. In our hands, snap-freezing is superior to PFA fixation for several cardiomyocyte antigens, including s-α-actinin, β-catenin, β1-integrin, tropomyosin, talin (not shown) and N-cadherin; in contrast, PFA fixation yields superior results for focal adhesion kinase (not shown). The protein crosslinks formed by PFA may mask epitopes and limit antibody binding; antigen retrieval may be required in such cases, and methods for antigen retrieval may be found elsewhere20. PFA concentration or length of fixation can be decreased to reduce epitope masking, with optimal conditions empirically determined for each antibody and at each developmental stage. Appropriate negative controls should be used when characterizing a new antibody or cardiac mutant, including pre-immune serum as the primary antibody control and a “no primary antibody” control. Use of knockout mice is an ideal negative control but early lethality prevents their use for many of the gene products studied here.
Use of adequate volumes to completely submerge experimental and control slides in the same immunofluorescence blocking, antibody, and wash solutions was important as was gentle rocking of slides during incubation to ensure uniform exposure of the sections to the solutions. This approach minimized technical variability in staining between sections and slides within an experiment. When cost limits the antibody solution volume, use a Pap pen to limit flow of solutions beyond the tissue sections and keep slides in a humidified chamber during long incubations. If a monoclonal mouse primary antibody - and therefore an anti-mouse secondary antibody - is being used, a second blocking step to cover endogenous mouse immunoglobulins will be necessary (step 3.4) to decrease nonspecific background signal.
Appropriate microscopy and image processing techniques are critical to obtaining biologically accurate information21. The intensity histogram indicates the distribution of pixels at each intensity level (0 – 65535 levels for a 16-bit image) for each color. Background, brightness, and contrast can be adjusted by setting an intensity display range that flanks the histogram peak; to make valid comparisons between conditions, the same settings between control and experimental conditions must be used.
This protocol provides a reliable method to analyze cardiomyocyte maturation and development in the native embryonic mouse heart. While immunofluorescence of cardiomyocyte-specific proteins is often used to mark cardiomyocytes during development, few studies employ techniques that allow high-resolution analysis of myofibril structure and the emergence of intercalated discs and costameres12-14,22,23. This technique can be used for in vivo assessment of mutations that cause developmental heart defects, as a means of identifying changes in cardiomyocyte maturation that may shed light on mechanisms of structural abnormalities.
Acknowledgements
The authors would like to thank Drs. Hilary Clay, Stephen Wilson, Anna Payne-Tobin, and James Smyth for helpful discussions. Microscopy was done at the Cardiovascular Research Institute Imaging Core at the University of California, San Francisco. This work was supported by NIH K08 HL105657 (LDW) and NIH HL65590 (SRC).
Materials
| Name | Company | Catalog Number | Comments |
| Name of Reagent/ Equipment | Company | Catalog Number | Comments/Description |
| Cryomold, Disposable Base Mold, 7x7 mm | Richard-Allen Scientific | 58949 | This size not available from Fisher Scientific |
| Cryomold, Disposable Base Mold, 15x15 mm | Fisher Scientific | 22-050-159 | Also available from Richard-Allen Scientific, catalog number 58950 |
| Tissue-Tek Optimal Cutting Temperature (OCT) medium 4583 | VWR | 25608-930 | |
| 2-methyl butane | Sigma | M32631 | |
| Paraformaldehyde | Fisher Scientific | T353-500 | Use fresh 4% solution in 1X PBS, pH 7.2-7.4. |
| Sucrose | Sigma | S0389 | Use 15% and 30% solutions in 1X PBS. |
| Disposable transfer pipette | Fisher Scientific | S30467-1 | |
| Superfrost Plus slides | Fisher Scientific | 12-550-15 | "Plus" indicates positively-charged coating and is critical for maintaining tissue adherence to the slide. |
| Acetone | Sigma | 179124 | |
| Triton X-100 | Sigma | X100 | |
| Western Blocking Agent | Roche | 11921673001 | Blocking buffer for immunofluorescence, when secondary antibodies are from different species. Dilute to 1X in PBS. |
| Tween 20 | Sigma | P9416 | |
| Donkey Anti-mouse IgG (H+L) monovalent Fab fragment | Jackson ImmunoResearch | 715-007-003 | Goat Anti-mouse IgG (H+L) also available. For blocking endogenous immunoglobulins. |
| Anti-s-a-actinin antibody | Sigma | A7811 | Mouse monoclonal, clone EA53. Dilute 1:400 for snap-frozen/acetone-fixed sections, dilute 1:300 for PFA-fixed sections. Before incubation on mouse tissue, block endogenous mouse immunoglobulins with anti-mouse IgG (H+L) monovalent Fab fragment. |
| Anti-bcatenin antibody | Cell Signaling | 9587s | Rabbit polyclonal. Requires snap-freezing/acetone fixation. Dilute 1:400. |
| Anti-b1 integrin antibody | R&D | AF2405 | Goat polyclonal. Dilute 1:200. Snap-frozen/acetone-fixed tissue staining is superior to PFA-fixed tissue. |
| Anti-tropomyosin antibody | Developmental Studies Hybridoma Bank, University of Iowa | CH1 | Mouse monoclonal. Requires snap-freezing/acetone fixation. Dilute 1:200. Before incubation on mouse tissue, block endogenous mouse immunoglobulins with anti-mouse IgG (H+L) monovalent Fab fragment. |
| Anti-N-cadherin antibody | Santa Cruz | sc-7939 | Rabbit polyclonal. Dilute 1:200. Snap-frozen/acetone-fixed tissue staining is superior to PFA-fixed tissue. |
| Anti-talin antibody | Sigma | T3287 | Mouse monoclonal, clone 8d4. Requires snap-freezing/acetone fixation. Dilute 1:200. Before incubation on mouse tissue, block endogenous mouse immunoglobulins with anti-mouse IgG (H+L) monovalent Fab fragment. |
| Anti-phosphotyrosine 397 focal adhesion kinase antibody | Invitrogen | 700255 | Rabbit monoclonal antibody. Requires PFA fixation. Dilute 1:500. |
| Alexa Fluor 488 Donkey Anti-Mouse IgG (H+L) Antibody | Life Technologies | A-21202 | |
| Alexa Fluor 568 Donkey Anti-Rabbit IgG Antibody | Life Technologies | A10042 | |
| Alexa Fluor 488 Goat Anti-Mouse IgG (H+L) Antibody | Life Technologies | A-11001 | |
| Alexa Fluor 568 Goat Anti-Rabbit IgG (H+L)Antibody | Life Technologies | A-11011 | |
| Hoechst 33342 dye | Life Technologies | H3570 | Nuclear stain |
| Vectashield | Vector labs | H-1000 | |
| Coverslips | Fisher Scientific | 12-548-5M | |
| MLC 400B Monolithic Laser Combiner Laser box | Keysight (formerly Agilent) | ||
| Clara Interline CCD camera | Andor | ||
| Eclipse Ti inverted microscope | Nikon | ||
| CSU-X1 Spinning disk confocal scanner unit | Yokogawa | ||
| CFI Plan Apochromat 4X air objective | Nikon | Numerical aperture (NA) 0.2, Working distance (WD) 15.7 mm | |
| CFI Plan Apochromat VC 60x oil immesion objective (MRD01602) | Nikon | NA 1.4, WD 0.13 mm | |
| NIS Elements Imaging Software | Nikon | http://nikon.com/products/instruments/lineup/bioscience/img_soft/index.htm | |
| Image analysis software | Fiji | http://fiji.sc/Fiji |
References
- Risebro, C. A., Riley, P. R. Formation of the ventricles. The Scientific World Journal. 6, 1862-1880 (2006).
- Ji, R. P., et al. Onset of cardiac function during early mouse embryogenesis coincides with entry of primitive erythroblasts into the embryo proper. Circulation research. 92, 133-135 (2003).
- Bennett, P. M., Maggs, A. M., Baines, A. J., Pinder, J. C. The transitional junction: a new functional subcellular domain at the intercalated disc. Molecular biology of the cell. 17, 2091-2100 (2006).
- Sparrow, J. C., Schock, F. The initial steps of myofibril assembly: integrins pave the way. Nature reviews. Molecular cell biology. 10, 293-298 (2009).
- Kastner, P., et al. Vitamin A deficiency and mutations of RXRalpha, RXRbeta and RARalpha lead to early differentiation of embryonic ventricular cardiomyocytes. Development. 124, 4749-4758 (1997).
- Zhang, W., Chen, H., Qu, X., Chang, C. P., Shou, W. Molecular mechanism of ventricular trabeculation/compaction and the pathogenesis of the left ventricular noncompaction cardiomyopathy (LVNC). American journal of medical genetics Part C, Seminars in medical genetics. 163C, 144-156 (2013).
- Kim, Y. Y., et al. Cellular localization of alpha3beta1 integrin isoforms in association with myofibrillogenesis during cardiac myocyte development in culture. Cell adhesion and communication. 7, 85-97 (1999).
- Lu, M. H., et al. The vinculin/sarcomeric-alpha-actinin/alpha-actin nexus in cultured cardiac myocytes. The Journal of cell biology. 117, 1007-1022 (1992).
- Schultheiss, T., et al. Differential distribution of subsets of myofibrillar proteins in cardiac nonstriated and striated myofibrils. The Journal of cell biology. 110, 1159-1172 (1990).
- Samarel, A. M. Costameres, focal adhesions, and cardiomyocyte mechanotransduction. American journal of physiology. Heart and circulatory physiology. 289, H2291-H2301 (2005).
- Sinn, H. W., Balsamo, J., Lilien, J., Lin, J. J. Localization of the novel Xin protein to the adherens junction complex in cardiac and skeletal muscle during development. Developmental dynamics : an official publication of the American Association of Anatomists. 225, 1-13 (2002).
- Lu, S., Borst, D. E., Horowits, R. N-RAP expression during mouse heart development. Developmental dynamics : an official publication of the American Association of Anatomists. 233, 201-212 (2005).
- Hirschy, A., Schatzmann, F., Ehler, E., Perriard, J. C. Establishment of cardiac cytoarchitecture in the developing mouse heart. Developmental biology. 289, 430-441 (2006).
- Whitman, S. A., et al. Desmoplakin and talin2 are novel mRNA targets of fragile X-related protein-1 in cardiac muscle. Circulation research. 109, 262-271 (2011).
- Kalaskar, V. K., Lauderdale, J. D. Mouse embryonic development in a serum-free whole embryo culture system. Journal of visualized experiments : JoVE. , (2014).
- Schindelin, J., et al. Fiji: an open-source platform for biological-image analysis. Nature. 9, 676-682 (2012).
- Schmid, B., Schindelin, J., Cardona, A., Longair, M., Heisenberg, M. A high-level 3D visualization API for Java and ImageJ. BMC. 11, 274 (2010).
- Swope, D., Cheng, L., Gao, E., Li, J., Radice, G. L. Loss of cadherin-binding proteins beta-catenin and plakoglobin in the heart leads to gap junction remodeling and arrhythmogenesis. Molecular and cellular biology. 32, 1056-1067 (2012).
- Riedl, J., et al. Lifeact mice for studying F-actin dynamics. Nature. 7, 168-169 (2010).
- Shi, S. R., Shi, Y., Taylor, C. R. Antigen retrieval immunohistochemistry: review and future prospects in research and diagnosis over two decades. The journal of histochemistry and cytochemistry : official journal of the Histochemistry Society. 59, 13-32 (2011).
- North, A. J. Seeing is believing? A beginners' guide to practical pitfalls in image acquisition. The Journal of cell biology. 172, 9-18 (2006).
- Risebro, C. A., et al. Prox1 maintains muscle structure and growth in the developing heart. Development. 136, 495-505 (2009).
- Ehler, E., Rothen, B. M., Hammerle, S. P., Komiyama, M., Perriard, J. C. Myofibrillogenesis in the developing chicken heart: assembly of Z-disk, M-line and the thick filaments. Journal of cell science. 112 (Pt 10), 1529-1539 (1999).
Explore More Articles
This article has been published
Video Coming Soon
ABOUT JoVE
Copyright © 2025 MyJoVE Corporation. All rights reserved