Characterizing Lewis Pairs Using Titration Coupled with In Situ Infrared Spectroscopy
In This Article
Summary
Here, we present a method for the observation of solution interactions between Lewis acids and bases by employing in situ infrared spectroscopy as a detector for titration under synthetically relevant conditions. By examining solution interactions, this method represents a complement to X-ray crystallography, and provides an alternative to NMR spectroscopy.
Abstract
Lewis acid-activation of carbonyl-containing substrates is a fundamental basis for facilitating transformations in organic chemistry. Historically, characterization of these interactions has been limited to models equivalent to stoichiometric reactions. Here, we report a method utilizing in situ infrared spectroscopy to probe the solution interactions between Lewis acids and carbonyls under synthetically relevant conditions. Using this method, we were able to identify 1:1 complexation between GaCl3 and acetone and a highly ligated complex for FeCl3 and acetone. The impact of this technique on mechanistic understanding is illustrated by application to the mechanism of Lewis acid-mediated carbonyl-olefin metathesis in which we were able to observe competitive binding interactions between substrate carbonyl and product carbonyl with the catalyst.
Introduction
The utilization of Lewis acids to activate substrates containing carbonyls is ubiquitous in organic synthetic methods1,2,3,4. The study of these interactions has relied on solid state X-ray crystallography, as well as in situ NMR spectroscopy2. Limitations of these techniques manifest from artifacts that arise from crystallization, or the inability to probe paramagnetic Lewis acids via NMR analysis. To overcome these issues, chemists have employed infrared (IR) spectroscopy to determine the exact structure of Lewis pairs. Further, IR has been utilized to determine Lewis acidity4,5,6,7,8,9. The Susz lab studied the solid-state interactions of Lewis acids and carbonyls in the stoichiometric regime. Utilizing IR in conjunction with elemental analysis, the Susz group was able to elucidate the structures of neat, 1:1 mixtures of Lewis pairs. This analysis provided a great deal of insight into structural ramifications of the interactions of simple carbonyl compounds with commonly utilized Lewis acids in the solid state, and of particular interest to our lab: FeCl310,11. We posited that we could add to the existing understanding of the interactions of these ou important Lewis pairs via an in situ method that examines synthetically relevant conditions.
In situ IR enables chemists to perform real-time measurements of functional group conversions in situ. These data supply key insights into reaction rates to support hypotheses about the operating mechanisms of a process and to influence of reaction performance. Real-time observations allow chemists to directly track the interconversion of reaction components over the course of the reaction, and the information gleaned can be employed by the synthetic chemist in the development of new compounds and the optimization of synthetic routes and new chemical processes.
Employing in situ IR spectroscopy as a detection method, we probed the substrates and intermediates that participate in the catalytic cycle of metal-mediated carbonyl-olefin metathesis12. The Fe(III)-catalyzed carbonyl-olefin metathesis process, developed by the Schindler lab, exemplifies a powerful method for the production of C=C bonds from functional groups utilized ubiquitously in the construction of complex molecules13,14,15. Since the original report, this process has inspired a plethora of synthetic developments beyond the utilization of Fe(III)16,17,18,19,20,21,22,23,24,25. Importantly, this reaction requires that the Lewis acid catalyst differentiate between a substrate carbonyl and a product carbonyl for successful reactivity. To observe this competitive interaction under synthetically relevant conditions, we combined titration with the continuous observation provided by in situ IR.
We believe this method is of general importance to chemists studying carbonyl-centered reactions catalyzed by Lewis acids. This detailed demonstration aims to help chemists apply this technique to their system of study.
Protocol
1. Open-air reference spectrum
- Open the data acquisition software. Click Instrument. Under the Configure tab, click Collect Background. Click Continue. Set scans to 256 and click OK to collect a background.
NOTE: Make sure the probe is in the same position in which data collection will take place. Position changes of the probe may impact spectra.
2. Solvent reference spectrum
- In the data acquisition software, click File. Click New. Click QuickStart.
- Set Duration to 15 min and Sample Interval to 15 s. Click Create to create experiment.
NOTE: At this point, the chemical system must be attached to the in situ IR probe to proceed. The following steps are for the preparation of the chemical system to be studied. - Under inert atmosphere, add Lewis acid to a flame-dried 25 mL 2-neck round bottom flask charged with a stir bar (Figure 1B). Seal the flask with rubber septa and attach an Ar-filled balloon to the flask. Add desired volume of anhydrous solvent via syringe (minimum 3 mL) (Figure 1C).
NOTE: FeCl3 is not soluble in dichloroethane (DCE). GaCl3 is soluble in DCE. - Remove one septum and attach the flask to the in situ IR probe (Figure 1D). Place the flask in a temperature-controlled bath set to desired temperature (Figure 1E).
- Start the experiment in the data acquisition software by clicking the
 button to begin collecting data, and stop collecting data after 2 min.
NOTE: The name of this file is the solvent reference spectrum that you will use in step 3.1.3.
3. Titration software setup
- Creating new titration experiment
- In the data acquisition software, click File | New | Quick Start. Set Duration to 8 h and Sample Interval to 15 s.
NOTE: The data acquisition has the ability to set experiment duration between 15 min and 2 d and sample interval between 15 s and 1 h. - Click Create to create experiment. In the data acquisition software, go to Spectra tab and click Add Spectra. Click From File and open appropriate solvent reference spectrum obtained in step 2. Check the box with the time signature. Click OK.
- Start experiment in the data acquisition software by clicking the
 button to begin collecting data.
- In the data acquisition software, click File | New | Quick Start. Set Duration to 8 h and Sample Interval to 15 s.
- Click Solvent Subtraction and select appropriate reference spectrum added in step 3.1.3. Stir for 15 min to reach temperature. Use the in situ IR probe to determine temperature.
4. Titration procedure
- Add 10 µL of carbonyl analyte via syringe (Figure 1F).
- Observe signal response on the data acquisition (Figure 2). System will shift from equilibrium and change with time.
- When the IR signal stabilizes and remains constant, collect IR spectrum.
NOTE: The data acquisition collects spectra at a set frequency. Data in our lab are collected every 15 s. We note the time at which the system reaches equilibrium and use the spectrum collected at the time for analysis. - Repeat steps 4.1-4.3 until desired amount of analyte is added.
NOTE: FeCl3 mixture becomes homogeneous once 1 equiv 1 is added and GaCl3 mixture remains homogeneous regardless of amount of 1 added.
5. Analysis of IR spectra
- Export data for the data acquisition software.
- Click File | Export | Multi-spectrum file.
- Under Format, check CSV and under Data, check Raw. Click Export to export IR data to spreadsheet or mathematical processing software.
- Plot desired region of IR spectrum, as shown in Figure 3A,D.
- Examine the spectrum for transitions and/or isosbestic points.
- Separate spectra by progression, as shown in Figure 3B,C for GaCl3 and Figure 3E,F for FeCl3.
6. Component analysis
- Identify λmax of each species of interest, as shown in Figure 4A for GaCl3 and 1 and Figure 4D for FeCl3 and 1, to generate a table of Absorbance vs. equivalent of analyte added, as shown in Figure 4B for GaCl3 and Figure 4E for FeCl3.
- To account for dilution, multiply the absorbance by the total volume of the solution for each spectrum, as shown in Figure 4B for GaCl3 and Figure 4E for FeCl3.
- Plot product of absorbance*volume as a function of equivalents of analyte, as shown in Figure 4C for GaCl3 and Figure 4F for FeCl3.
7. Analysis of consumption of species
- For in situ-generated species that can be identified, plot a Beer-Lambert relationship, as shown in Figure 5A.
- For known species, measure the impact of concentration on Absorbance at the desired λmax and plot a Beer-Lambert relationship.
- Using the two Beer-Lambert relationships, determine the observed in situ amounts of the species of interest, as shown in Figure 5B.
NOTE: CMAX = 2 mmol as defined by the amount of FeCl3 present. CADD is the moles of acetone (1) added. CCOORD is the moles of FeCl3-acetone complex (3). COBS is the moles of unbound 1. CND is the moles of 1 not detected. CMAX – CCOORD is the moles of 3 that have been consumed. - Plot CND vs. (CMAX – CCOORD) to determine if there is a correlation, as shown in Figure 5C.
NOTE: The slope of this line will be in moles of species 1 per moles of species 3.
Representative Results
In this study, in situ IR-monitored titration was used to observe the interactions of 1 and GaCl3 as well as 1 and FeCl3 (Figure 6)12. Using this collection of protocols, we were able to determine that GaCl3 and 1 form 1:1 complex 2 in solution. Alternatively, when FeCl3 and 1 are combined, more complex behavior is observed. Figure 6 displays the equilibria we were examining. Figure 1 displays the physical setup of the titration of FeCl3 with 1. Figure 2 displays the raw feed of data obtained by the in situ IR using the data acquisition software for the titration of FeCl3 with 1. Figure 3 displays the process of extracting the transitions that result from this titration method applied to GaCl3 and FeCl3. Figure 4 displays the extraction of λmax data of the titration of GaCl3 with 1 and the titration of FeCl3 with 1. Figure 5 displays the extraction of complex coordination behavior from the titration of FeCl3 with 1. Figure 7 displays an application of these protocols for the examination of competitive access to a Lewis acid. Figure 8 shows the application of these protocols to revising the mechanism of metal catalyzed carbonyl-olefin metathesis.
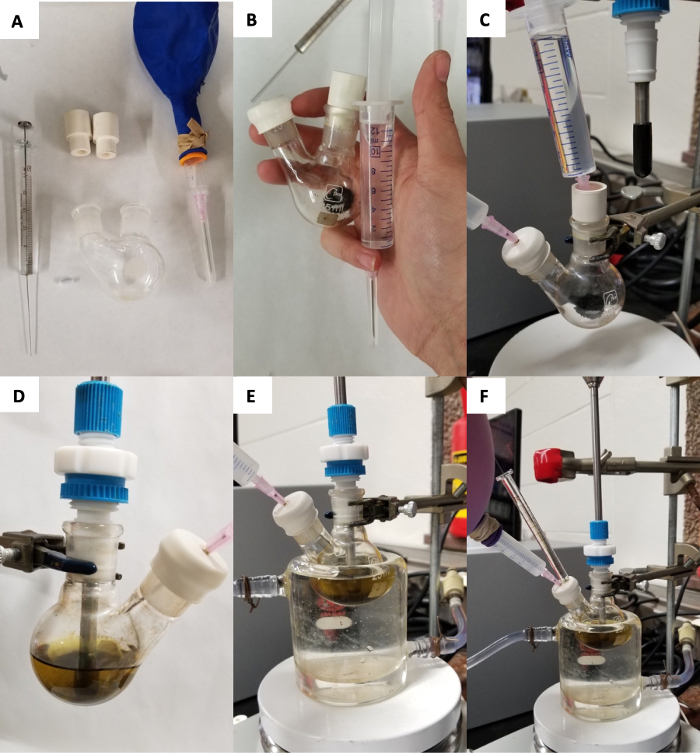
Figure 1: Visual guide to system setup. Necessary components for performing the titration (A). Assembled components prior to attachment to the in situ IR (B). Flask with Ar and ready for solvent addition (C). Flask attached to the in situ IR with solvent (D). Flask under temperature control (E). Ready for addition of analyte (F). Please click here to view a larger version of this figure.
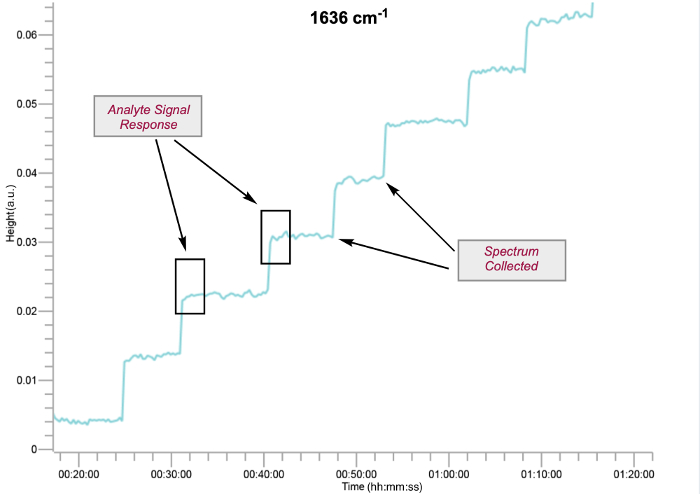
Figure 2: Analyte signal response in the data acquisition interface at 1636 cm-1 for titration of 2 mmol FeCl3 in 12 mL of DCE with 1. The spectrum is collected when the system is at equilibrium, after analyte addition. Please click here to view a larger version of this figure.
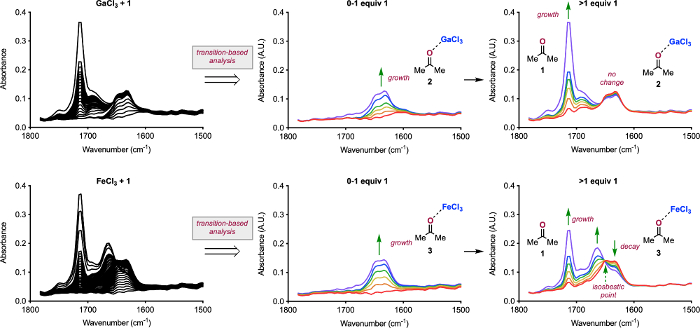
Figure 3: Analysis of IR spectra. Spectra collected for the titrations GaCl3 with 0-4 equiv 1 (A) and FeCl3 with 0-4 equiv 1 (D). Breakdown of titration of GaCl3 with 0-1 equiv 1 showing the formation of 2 (B) and with 1-4 equiv 1 showing the presence of 1 (C). Breakdown of titration of FeCl3 with 0-1 equiv 1 showing the formation of 3 (E) and with 1-4 equiv 1 showing the presence of 1, the consumption of 3, and the formation of a new species (F). Reprinted (adapted) with permission from Hanson, C. S., et al12. Copyright 2019 American Chemical Society. Please click here to view a larger version of this figure.
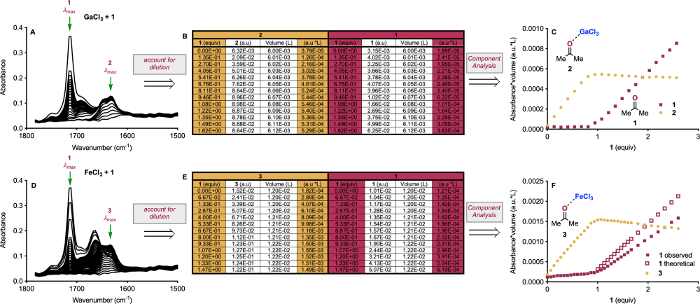
Figure 4: Extraction of λmax data from IR for Component Analysis. Spectra collected for the titrations GaCl3 with 0-4 equiv 1 with the λmax for 1 and 2 indicated (A) and FeCl3 with 0-4 equiv 1 with the λmax for 1 and 3 indicated (D). Table showing representative data normalized to account for dilution for GaCl3 (B) and for FeCl3 (E). Data from (B) plotted for component analysis of titration of GaCl3 with 1 (C) and for component analysis of titration of FeCl3 with 1 (F). Reprinted (adapted) with permission from Hanson, C. S., et al12. Copyright 2019 American Chemical Society. Please click here to view a larger version of this figure.

Figure 5: Consumption analysis of titration of FeCl3 with 1. Segment of IR data used to generate a Beer-Lambert relationship for [3] and the segment of IR data used to determine the consumption of 3 (A). Moles of each 1-containing species measured from IR (B). Plot of moles of 1 not detected vs. moles of 3 consumed (C). Reprinted (adapted) with permission from Hanson, C. S., et al12. Copyright 2019 American Chemical Society. Please click here to view a larger version of this figure.

Figure 6: Lewis acid/base equilibria probed in this study. Titrations of GaCl3 with 1 to form 2 and FeCl3 with 1 to form 3 and 4 are reported. Please click here to view a larger version of this figure.
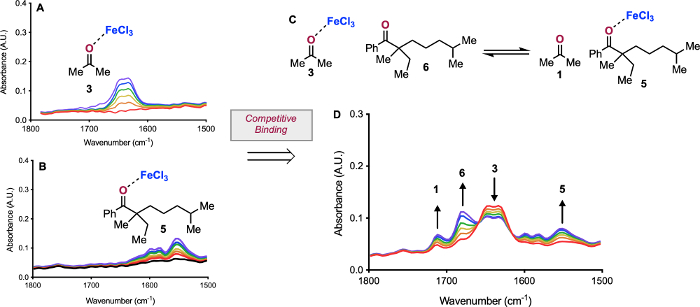
Figure 7: Competitive binding experiment. Carbonyl region of IR spectrum of 3 (A) and of IR spectrum of 5 (B). Equilibrium probed in titration of 3 with 6 (C). IR data of titration of 3 with 1 equiv 6 (D). Reprinted (adapted) with permission from Hanson, C. S., et al12. Copyright 2019 American Chemical Society. Please click here to view a larger version of this figure.
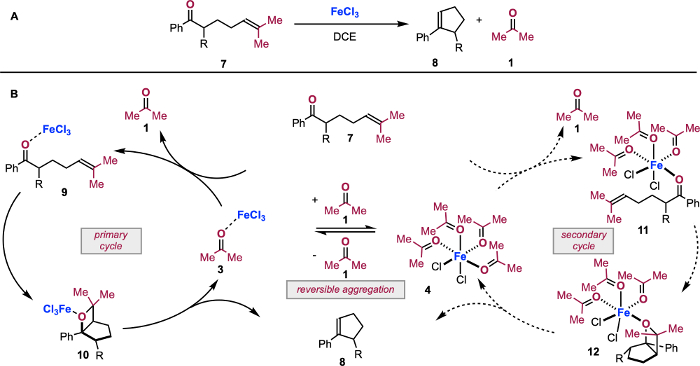
Figure 8: Application of in situIR data in mechanistic proposal. Carbonyl-olefin metathesis reaction of 7 (A). The revised mechanistic proposal of carbonyl-olefin metathesis facilitated by titration coupled with in situ IR spectroscopy (B). Reprinted (adapted) with permission from Hanson, C. S., et al12. Copyright 2019 American Chemical Society. Please click here to view a larger version of this figure.
Discussion
Under anhydrous conditions, Lewis acids can have a range of solubilities. The two examples we have presented are GaCl3 and FeCl3 in DCE. GaCl3 is homogeneous at the onset of the titration, while FeCl3 is largely insoluble. Beginning with the homogeneous solution of GaCl3, we completed a titration from 0-4 equiv 1 in 10 μL increments and extracted the IR spectra (Figure 3A). Examination of the transitions that occur over the course of the titrations shows a formation of a single species in the carbonyl region at 1630 cm-1, which grows from 0-1 equiv 1 (Figure 3B) 26,27. When greater than 1 equiv 1 is added to the solution, no change in the peak at 1630 cm-1 occurs and unbound 1 is observed at 1714 cm-1 (Figure 3C). These results are consistent with the formation of 2. When the same titration is performed with FeCl3 (Figure 3D), a peak at 1636 cm-1 forms from 0-1 equiv 1, which is consistent with 3 (Figure 3E). Importantly, the mixture becomes homogenous once 1 equiv 1 is achieved. When the titration proceeds beyond 1 equiv 1, unbound 1 is observed at 1714 cm-1, 3 decreases in intensity, an isosbestic point resolves at 1648 cm-1, and a new peak at 1663 cm-1 forms.
Using the titration IR data, the equivalents of analyte used can be employed to perform Component Analysis of the solution interactions (Figure 4). To account for dilution, we can employ a normalization with respect to volume of the Beer-Lambert equation (eq. 1):

where 1) both absorbance (A) and volume (V) are measurable terms; 2) molar absorptivity (ε) and pathlength (l) are constant, allowing 3) number of moles (n) to be examined. The normalized absorbance can easily be computed in a spreadsheet (Figure 4B,D), and then this term can be plotted against equivalents of analyte. In Figure 4C, we can see that the signal for 2 increases linearly with respect to 1 until 1 equiv, at which point the signal for 1 increases linearly and 2 is unchanged. In Figure 4F, we see a similar linear increase in the signal of 3 to 1 equiv 1, followed by the presence of 1 beyond 1 equiv added. However, we also observe a linear decrease in the intensity of 3, and we observe less 1 than we should, assuming similar behavior to GaCl3.
Yet more information is available from the IR data for the titration of FeCl3 with 1. The maximum amount of 3 that can form is defined by the amount of FeCl3 added (CMAX = 2 mmol FeCl3 in the example titration). We know the amount of 1 we add to the flask (CADD), and we can measure the amount of unbound 1 we observe at 1714 cm-1 (COBS) and the amount of 3 we observe at 1636 cm-1 (CCOORD) using Beer-Lambert relationships. Lastly, we know we cannot account for all of the 1 added to the flask as free 1 or 3, indicating that some 1 is not detected (CND). We can combine these terms for 1 in the following mass balance (eq. 2):

We can use the titration data to calculate the values of these terms in each IR spectrum generated during the titration (Figure 5B). With these values, we can plot the amount of 1 missing (CND) as a function of the amount 3 consumed (CMAX-CCOORD) to determine if there is a correlation (Figure 5C). This correlation is consistent with 3 equiv 1 consuming 1 equiv 3, which may form a complex similar to 4. We have obtained further support for this number of attached ketones via examination of solution conductivity, which is consistent with one or more of the chlorides being displaced to the outer sphere of Fe(III), and X-ray crystallography of an analogous structure with benzaldehyde12. However, it is likely that there is a mixture of different types of highly-ligated structures that are formed in solution, as is indicated by our non-whole number slopes in our consumption analysis in Figure 5, and the crystal structure we observe may simply be the one complex that precipitates.
In addition to the interactions between two species, this method can be used to probe competitive interactions (Figure 7). By establishing the formation and spectral properties of 3 (Figure 7A) and 5 (Figure 7B), the competition of carbonyls for access to the Lewis acid can be observed. By preforming 3 in solution, we can examine how 6 displaces 1 (Figure 7C). When we probe this system, we see that as we add 6 to 3, not all 6 binds to FeCl3. However, we do observe the consumption of 3 with concomitant presence of 1, as well as the formation of 5.
Using this type of competition experiment, we have been able to simulate the state of FeCl3 as a catalyst in carbonyl-olefin metathesis (Figure 8). We previously demonstrated that at low turnovers, carbonyl-olefin metathesis operates via the primary cycle in Figure 8B28. Substrate 7 interacts with FeCl3 to form complex 9 as the resting state of the cycle. Complex 9 then undergoes turnover-limiting [2+2]-cycloaddition to form oxetane complex 10. Retro-[2+2] yields cycloalkene product 8 and 3, which in turn must have the molecule of 1 displaced by a molecule of 7. However, as the [1] increases, 3 is converted to complex 4. Coordinatively saturated 4 then either sequesters FeCl3 or is catalytically competent, resulting in a parallel cycle via ketone complex 11 and oxetane complex 12.
In conclusion, the utilization of in situ IR to monitor the titration of Lewis acids with carbonyl compounds allows chemists to gain insight into Lewis acid/base solution interactions under synthetically relevant conditions. Not only can this technique be employed to identify discrete structures, but it can be employed to observe the transition of one discrete species into another, as well. Findings from this method have been utilized to propose the mechanism of other metathesis reactions29. We are currently using data gathered via this method to facilitate the reactivity of recalcitrant substrates in carbonyl-olefin metathesis, as well as to develop new forms of metathesis reactions. Lastly, the competitive interactions between substrate carbonyls and product carbonyls likely impact other Lewis acid-catalyzed reactions. We are employing this method to examine these other catalytic regimes.
Acknowledgements
We thank Loyola University Chicago, Merck, Co., Inc., and the NIH/National Institute of General Medical Sciences (GM128126) for financial support. We thank Mettler-Toledo Autochem Inc. for their support in the production of this article.
Materials
| Name | Company | Catalog Number | Comments |
| Acetone | BDH | BDH1101-19L | Dried over potassium carbonate |
| Balloon | VWR | 470003-408 | Round Balloons, Assorted Colors, 9" dia. |
| Detector LN2 RiR15 | Mettler Toledo | 14474603 | |
| 1,2 Dichloroethane | Beantown | 223375-2.5L | Dried over 3Å molecular sieves |
| Gallium (III) Chloride | Beantown | 127270-100G | Anhydrous ≥99.999% (trace metals basis) |
| 25 µL glass syringe | Hamilton | 80285 | |
| Inert Argon Gas | Airgas | Ultra High Purity | |
| Iron (III) Chloride | Sigma Aldrich | 157740-100G | Reagent Grade, 97% |
| 100-mL Jacketed Beaker | AceGlass | 5340-03 | |
| 3Å Molecular Sieves | Alfa Aesar | L05335 | |
| 25-mL 2 neck flask | CTechGlass | FL-0143-003 | |
| 18G Needle | BD Biosciences | 305196 | Needles with Regular Bevel, 38.1 mm (11/2") |
| Potassium Carbonate | Sigma Aldrich | 60109-1KG-F | Anhydrous |
| Prism 8 | GraphPad | Mathematical Processing Software | |
| Probe DST 6.35 x 1.5m X 203 DiComp | Mettler Toledo | 14474510 | in situ IR probe |
| Rice Stir Bar | Dynalon | 303495 | Diameter: 3 mm (1/8"), Length: 10 mm (3/8") |
| 14/20 Rubbber Septa | VWR | 89097-554 | |
| 5-mL Syringe | AIR-TITE | 53548-005 | HSW Norm-Ject Sterile Luer-Slip Syringes, Air-Tite |
| 10-mL Syringe | AIR-TITE | 53548-006 | HSW Norm-Ject Sterile Luer-Slip Syringes, Air-Tite |
| System ReactIR 15 | Mettler Toledo | 1400003 | in situ IR system |
| Thermostatic Bath | Haake | Haake A82 |
References
- . . NATO ASI Series, Ser. C: Mathematical and Physical Sciences: Selectivities in Lewis Acid Promoted Reactions. 289, (1989).
- Santelli, M., Pons, J. M. . Lewis Acids and Selectivity in Organic Synthesis. , (1996).
- Yamamoto, H. . Lewis Acids in Organic Synthesis. , (2000).
- Satchell, D. P. N., Satchell, R. S. Quantitative Aspects of the Lewis Acidity of Covalent Metal Halides and Their Organo Derivatives. Chemical Reviews. 69, 251-278 (1969).
- Mohammad, A., Satchell, D. P. N., Satchell, R. S. Quantitative Aspects of Lewis Acidity. Part VIII. The Validity of Infrared Carbonyl Shifts as Measures of Lewis Acid Strength. The Interaction of Lewis Acids and Phenalen-1-one(Perinaphthenone). Journal of the Chemical Society B: Physical Organic. , 723-725 (1967).
- Satchell, D. P. N., Satchell, R. S. Quantitative Aspects of Lewis Acidity. Q. Chemical Society Reviews. 25, 171-199 (1971).
- Driessen, W. L., Groeneveld, W. L. Complexes with Ligands Containing the Carbonyl Group. Part I: Complexes with Acetone of Some Divalent Metals Containing Tetrachloro-ferrate(III) and -indate(III) Anions. Recueil des Travaux Chimiques des Pays-Bas. 88, 977-988 (1969).
- Driessen, W. L., Groeneveld, W. L. Complexes with Ligands Containing the Carbonyl Group. Part III: Metal (II) Acetaldehyde, Propionaldehyde and Benzaldehyde Solvates. Recueil des Travaux Chimiques des Pays-Bas. 90, 87-96 (1971).
- Driessen, W. L., Groeneveld, W. L. Complexes with Ligands Containing the Carbonyl Group. Part IV Metal(II) Butanone, Acetophenone, and Chloroacetone Solvates. Recueil des Travaux Chimiques des Pays-Bas. 90, 258-264 (1971).
- Chalandon, P., Susz, B. P. Etude de Composés d'Addition des Acides de Lewis. VI Spectre d'Absorption Infrarouge de l'Acétone-Trifluorure de Bore; Spectre d'Absorption Infrarouge et Moment de Dipǒle du Di-propyl-cétone-trifluorure de Bore. Helvetica Chimica Acta. 41, 697-704 (1958).
- Susz, B. P., Chalandon, P. Etude de Composés d'Addition des Acides de Lewis. IX. - Spectres d'Absorption Infrarouge des Composés Formés par la Benzophénone et l'Acétophénone avec BF3, FeCl3, ZnCl2 et AlCl3 et Nature de la Liaison Oxygène-Métal. Helvetica Chimica Acta. 41, 1332-1341 (1958).
- Hanson, C. S., Psaltakis, M. C., Cortes, J. J., Devery, J. J. III Catalyst Behavior in Metal-Catalyzed Carbonyl-Olefin Metathesis. Journal of the American Chemical Society. 141, 11870-11880 (2019).
- Ludwig, J. R., Schindler, C. S. Lewis Acid Catalyzed Carbonyl-Olefin Metathesis. Synlett. 139, 2960 (2017).
- Becker, M. R., Watson, R. B., Schindler, C. S. Beyond Olefins: New Metathesis Directions for Synthesis. Chemical Society Reviews. 47, 7867-7881 (2018).
- Riehl, P. S., Schindler, C. S. Lewis Acid-Catalyzed Carbonyl-Olefin Metathesis. Trends in Analytical Chemistry. 1, 272-273 (2019).
- Ludwig, J. R., Zimmerman, P. M., Gianino, J. B., Schindler, C. S. Iron(III)-Catalysed Carbonyl-Olefin Metathesis. Nature. 533, 374-379 (2016).
- Ma, L., et al. FeCl3-Catalyzed Ring-Closing Carbonyl-Olefin Metathesis. Angewandte Chemie International Edition. 55, 10410-10413 (2016).
- McAtee, C. C., Riehl, P. S., Schindler, C. S. Polycyclic Aromatic Hydrocarbons via Iron(III)-Catalyzed Carbonyl-Olefin Metathesis. Journal of the American Chemical Society. 139, 2960-2963 (2017).
- Groso, E. J., et al. 3-Aryl-2,5-Dihydropyrroles via Catalytic Carbonyl-Olefin Metathesis. ACS Catalysis. 8, 2006-2011 (2018).
- Ludwig, J. R., et al. Interrupted Carbonyl-Olefin Metathesis via Oxygen Atom Transfer. Science. 361, 1363-1369 (2018).
- Albright, H., et al. GaCl3-Catalyzed Ring-Opening Carbonyl-Olefin Metathesis. Organic Letters. 20, 4954-4958 (2018).
- Albright, H., et al. Catalytic Carbonyl-Olefin Metathesis of Aliphatic Ketones: Iron(III) Homo-Dimers as Lewis Acidic Superelectrophiles. Journal of the American Chemical Society. 141, 1690-1700 (2019).
- Tran, U. P. N., Oss, G., Pace, D. P., Ho, J., Nguyen, T. V. Tropylium-Promoted Carbonyl-Olefin Metathesis Reactions. Chemical Science. 9, 5145-5151 (2018).
- Tran, U. P. N., et al. Carbonyl-Olefin Metathesis Catalyzed by Molecular Iodine. ACS Catalysis. 9, 912-919 (2019).
- Catti, L., Tiefenbacher, K. Brønsted Acid-Catalyzed Carbonyl-Olefin Metathesis inside a Self-Assembled Supramolecular Host. Angewandte Chemie International Edition. 57, 14589-14592 (2018).
- Greenwood, N. N. The Ionic Properties and Thermochemistry of Addition Compounds of Gallium Trichloride and Tribromide. Journal of Inorganic and Nuclear Chemistry. 8, 234-240 (1958).
- Greenwood, N. N., Perkins, P. G. Thermochemistry of the Systems which Boron Trichloride and Gallium Trichloride Form with Acetone and Acetyl Chloride, and the Heat of Solution of Boron Tribromide in Acetone. Journal of the Chemical Society Resumed. , 356 (1960).
- Ludwig, J. R., et al. Mechanistic Investigations of the Iron(III)-Catalyzed Carbonyl-Olefin Metathesis Reaction. Journal of the American Chemical Society. 139, 10832-10842 (2017).
- Djurovic, A. Synthesis of Medium-Sized Carbocycles by Gallium-Catalyzed Tandem Carbonyl-Olefin Metathesis/Transfer Hydrogenation. Organic Letters. 21, 8132-8137 (2019).
This article has been published
Video Coming Soon
ABOUT JoVE
Copyright © 2024 MyJoVE Corporation. All rights reserved