
A subscription to JoVE is required to view this content. Sign in or start your free trial.
Abstract
Neuroscience
Quantification of Macronutrients Intake in a Thermogenetic Neuronal Screen using Drosophila Larvae
* These authors contributed equally
ERRATUM NOTICE
Important: There has been an erratum issued for this article. Read more …Abstract
Foraging and feeding behaviors allow animals to access sources of energy and nutrients essential for their development, health, and fitness. Investigating the neuronal regulation of these behaviors is essential for the understanding of the physiological and molecular mechanisms underlying nutritional homeostasis. The use of genetically tractable animal models such as worms, flies, and fish greatly facilitates these types of studies. In the last decade, the fruit fly Drosophila melanogaster has been used as a powerful animal model by neurobiologists investigating the neuronal control of feeding and foraging behaviors. While undoubtedly valuable, most studies examine adult flies. Here, we describe a protocol that takes advantage of the simpler larval nervous system to investigate neuronal substrates controlling feeding behaviors when larvae are exposed to diets differing in their protein and carbohydrates content. Our methods are based on a quantitative colorimetric no-choice feeding assay, performed in the context of a neuronal thermogenetic-activation screen. As a read-out, the amount of food eaten by larvae over a 1 h interval was used when exposed to one of the three dye-labeled diets that differ in their protein to carbohydrates (P:C) ratios. The efficacy of this protocol is demonstrated in the context of a neurogenetic screen in larval Drosophila, by identifying candidate neuronal populations regulating the amount of food eaten in diets of different macronutrient quality. We were also able to classify and group the genotypes tested into phenotypic classes. Besides a brief review of the currently available methods in the literature, the advantages and limitations of these methods are discussed and, also, some suggestions are provided about how this protocol might be adapted to other specific experiments.
Erratum
Erratum: Quantification of Macronutrients Intake in a Thermogenetic Neuronal Screen using Drosophila LarvaeAn erratum was issued for: Quantification of Macronutrients Intake in a Thermogenetic Neuronal Screen using Drosophila Larvae. A figure was updated.
Figure 1 was updated from:
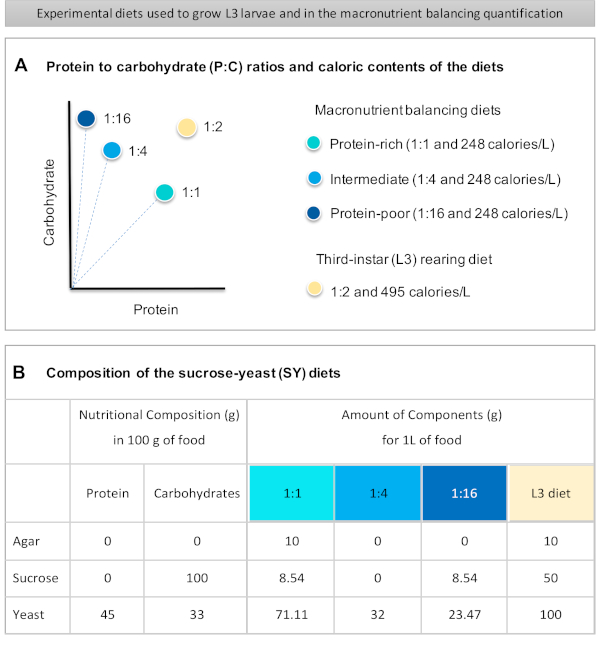
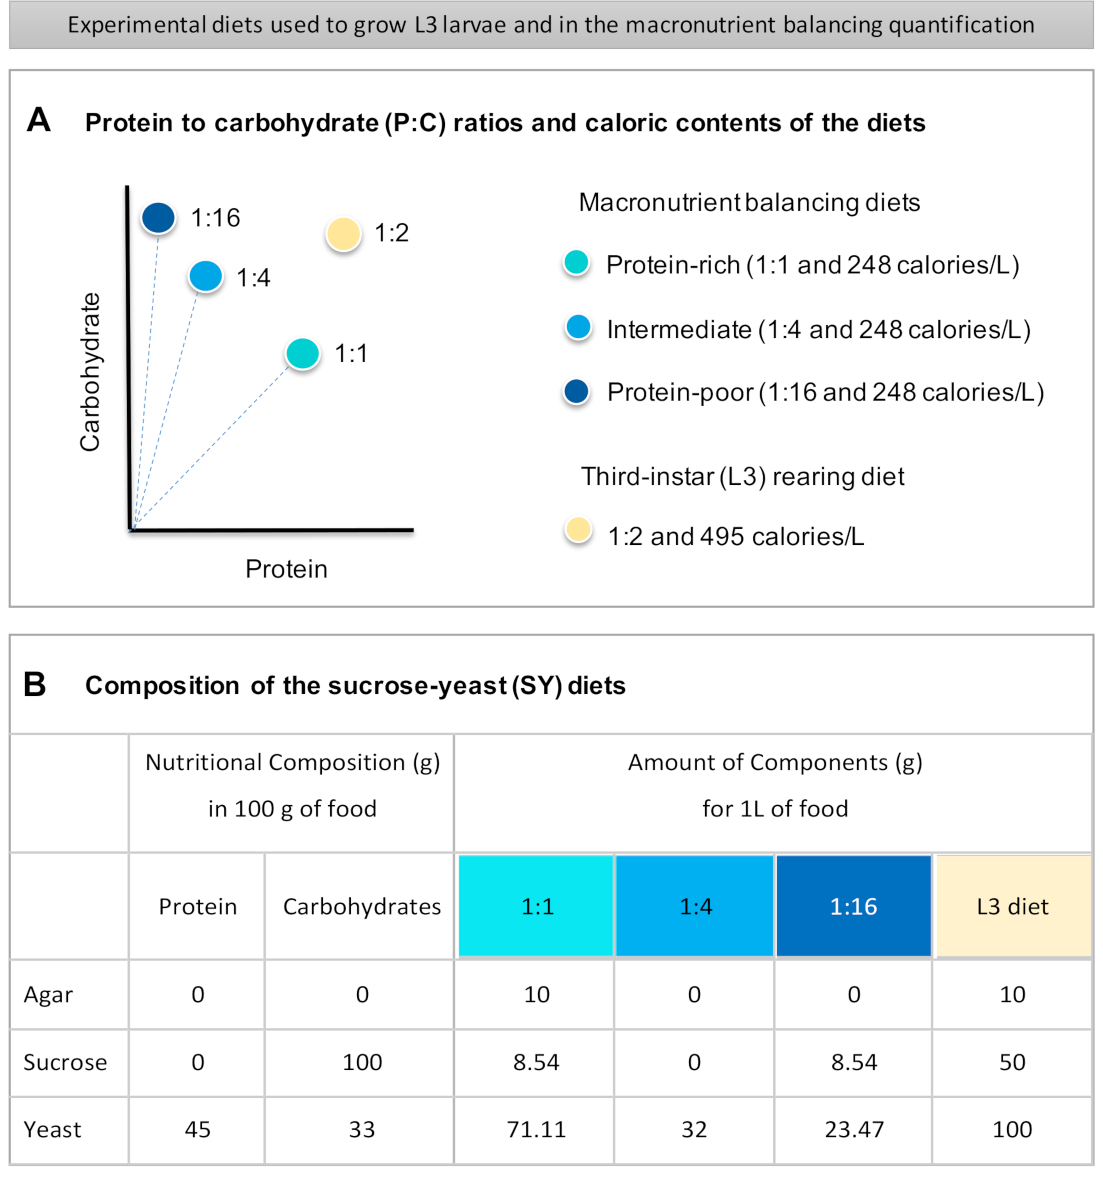
Figure 1: The sucrose-yeast (SY) diets used in our protocol. (A) The blue dots represent the isocaloric (248 calories/L) macronutrient balancing diets used in the feeding assay, which differ in the protein to carbohydrate (P:C) ratios: 1:1, 1:4 and 1:16. The beige dot represents the diet used to rear the experimental third-instar larvae (L3), which contained a P:C ratio of 1:2 and a caloric density of 495 calories/L. (B) Detailed composition and nutritional information of the sucrose-yeast (SY) based diets. The components are the same for all the diets: agar, sucrose and yeast. The amount in grams of the components needed to prepare 1 L of diet is shown. Note that 1% (v/v) of blue dye must be added to the macronutrient balancing diets and to the L3 rearing diet nipagin and propionic acid solutions must be added to a final concentration (v/v) of 3% and 0.3%, respectively. Please click here to view a larger version of this figure.
to:
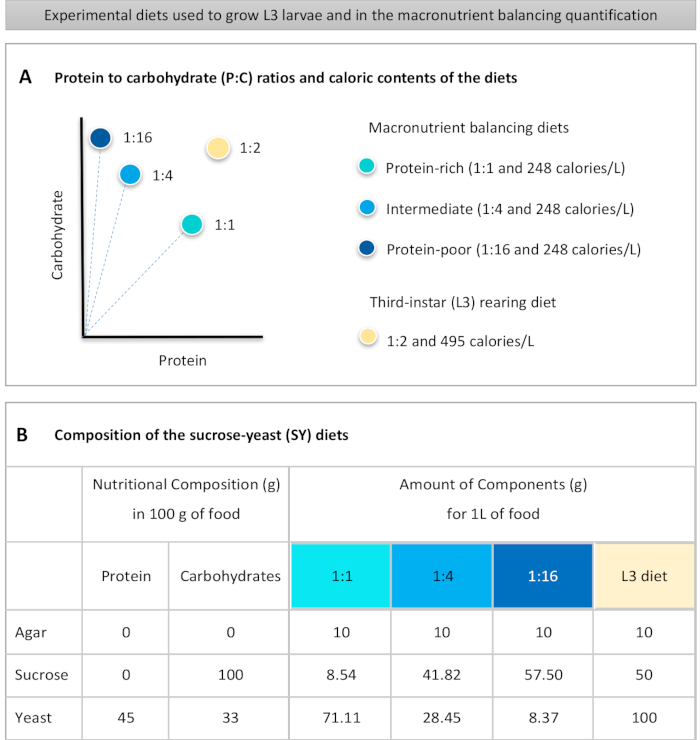
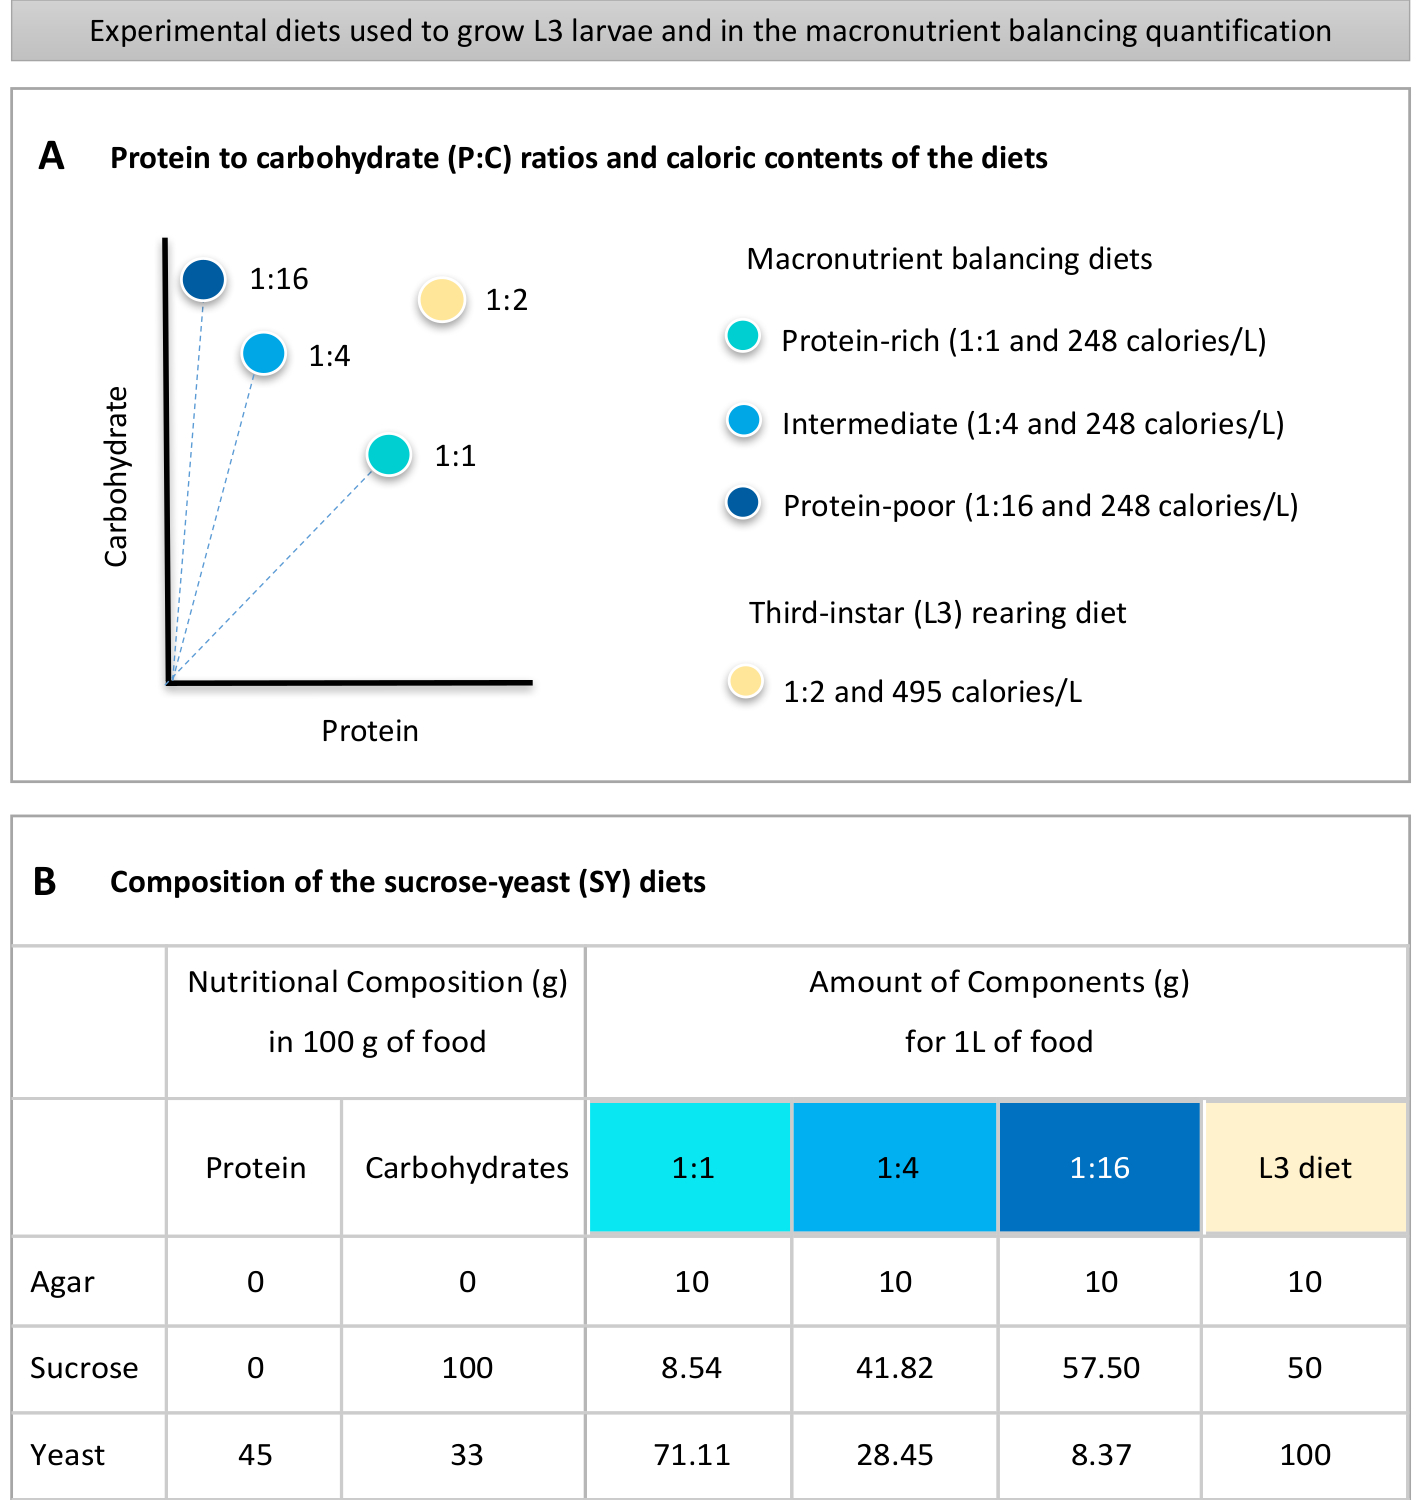
Figure 1: The sucrose-yeast (SY) diets used in our protocol. (A) The blue dots represent the isocaloric (248 calories/L) macronutrient balancing diets used in the feeding assay, which differ in the protein to carbohydrate (P:C) ratios: 1:1, 1:4 and 1:16. The beige dot represents the diet used to rear the experimental third-instar larvae (L3), which contained a P:C ratio of 1:2 and a caloric density of 495 calories/L. (B) Detailed composition and nutritional information of the sucrose-yeast (SY) based diets. The components are the same for all the diets: agar, sucrose and yeast. The amount in grams of the components needed to prepare 1 L of diet is shown. Note that 1% (v/v) of blue dye must be added to the macronutrient balancing diets and to the L3 rearing diet nipagin and propionic acid solutions must be added to a final concentration (v/v) of 3% and 0.3%, respectively. Please click here to view a larger version of this figure.
ABOUT JoVE
Copyright © 2024 MyJoVE Corporation. All rights reserved