Modifications of the Langendorff Method for Simultaneous Isolation of Atrial and Ventricular Myocytes from Adult Mice
In This Article
Summary
This protocol describes modifications of the Langendorff method including the depth of aorta cannulation for simultaneous Isolation of atrial and ventricular myocytes from adult mice.
Abstract
A single cardiomyocyte is a vital tool in the cellular and subcellular level studies of cardiac biology and diseases as a fundamental unit of contraction and electrical activity. Hence, isolating viable, high-quality cardiomyocytes from the heart is the initial and most crucial experimental step. Comparing the various protocols for isolating the cardiomyocytes of adult mice, the Langendorff retrograde perfusion is the most successful and reproducible method reported in the literature, especially for isolating ventricular myocytes. However, isolating quality atrial myocytes from the perfused heart remains challenging, and few successful isolation reports are available. Solving this complicated problem is extremely important because apart from ventricular disease, atrial disease accounts for a large part of heart diseases. Therefore, further investigations on the cellular level to reveal the mechanisms are warranted. In this paper, a protocol based on the Langendorff retrograde perfusion method is introduced and some modifications in the depth of aorta cannulation and the steps that may affect the digestion process to isolate atrial and ventricular myocytes were simultaneously made. Moreover, the isolated cardiomyocytes are confirmed to be amenable to patch clamp investigation.
Introduction
Cardiac disease is one of the leading global causes of mortality1. To address this burden on the healthcare system, an in-depth understanding of the heart's physiology and pathology is essential. Besides whole animal and intact heart preparation, cellular preparation is another indispensable tool for functional and disease study2. By applying the patch clamp, calcium imaging, molecular biology, and other advanced technologies, researchers can obtain more information on the electrophysiological properties, calcium homeostasis, signaling pathways, metabolic states, and gene transcriptions in a single cardiomyocyte (CM). This is extremely helpful in revealing the physiological and pathological mechanisms of the cardiac disease process3,4,5,6,7. For animal research, species ranging from small (e.g., mice, rats, and guinea pigs) to large (e.g., rabbits and dogs) animals can be used. Small animals are usually preferred, particularly mice, because they are amenable to genetic and disease model manipulation8,9,10.
Techniques of acutely isolated CMs have undergone a long development period and are still evolving11. The Langendorff retrograde perfusion is the most successful and reproducible CMs isolation method applied in rats and mice, especially for isolating ventricular myocytes (VMs)12,13,14,15. However, reports of successfully isolated atrial myocytes (AMs) are scarce16,17,18. Further investigations on both levels of the whole organ/system and the cellular/subcellular to reveal the mechanisms and explore new therapeutic approaches are warranted because atrial fibrillation (AF), the most common type of arrhythmia, is increasingly becoming prevalent globally, and current treatment modalities in both pharmacological therapies and cardiac ablation remain ineffective in approximately 40%-50% of AF patients19. Successful adult mouse CMs isolation is the first step for cellular study. Two primary isolation methods can be used: the chunk and Langendorff methods. In the Langendorff perfusion method, tissue digestion depends on the enzyme solution delivered by the coronary arteries and their branches to the capillary beds. A proper aorta cannulation depth that can avoid penetrating the aortic valves and blocking the coronary artery ostia is the prerequisite of achieving such a perfusion pattern, which is also the essential step for efficient digestion and ideal VM yield. Hence, it is reasonable to assume that the aorta cannulation's depth may similarly affect the atria vessel's perfusion and finally affect the AM yield. To test this hypothesis, aorta cannulation at different depths was performed and the corresponding AM yields were compared. The data showed that the aorta cannulation depth is directly relevant to the AM yield. Herein, a protocol to isolate AMs and VMs simultaneously is introduced.
Protocol
Adult male C57BL/6 mice weighing 20-30 g, 8-10 weeks of age were purchased from the Animal Centre of Capital Medical University, Beijing, China. All experimental procedures were approved by the Animal Care and Use Committee of Capital Medical University and were performed in compliance with the Guide for the Care and Use of Laboratory Animals proposed by the Institute of Animal Resources and published by the National Institutes of Health. Excel and Origin 8.5 were used for data acquisition and analysis. Data are presented as means ± SD, for statistical evaluation, Student's t test was used and P < 0.05 was considered statistically significant.
1. Solution and perfusion apparatus preparation
- Assemble a constant flow Langendorff apparatus (commercially available or self-made). Figure 1 provides a simple schematic.
- Prepare the solutions according to the reagents given in Table 1 and Table 2.
- Turn on the circulating water bath and adjust a suitable input temperature (42.7 °C in our laboratory) to ensure that the perfusate circulation system's outflow from the cannula reaches 37 °C.
- Clean the perfusion system by circulating deionized water. If a sterile condition is required, run 75% ethanol through the perfusion system for 15 min, followed by deionized water (at least 10 cycles to avoid alcohol toxicity effects on the heart).
- Measure the time and volume for one cycle of the perfusate circulation system to determine how many milliliters of oxygenated Tyrode's solution to be loaded in the following perfusion step.
- Sterilize all the surgical tools in the desired method.
- Set the flow rate of the perfusate perfusion system at 4 mL/min.
- Prepare two clean 35 mm Petri dishes-one containing Tyrode's solution (Petri dish 1), the other containing solution 1 (Petri dish 2).
- Prepare a 1 mL syringe filled with solution 1 and a 20 G blunt steel cannula needle with a notch from where the distance is 1 mm to the tip. Prepare a loose knot with 3-0 suture to the cannula shaft. Regulate the viewing field of the stereomicroscope and ensure that the cannula tip is below the liquid surface of Petri dish 2.
2. Animal preparation
- Administer heparin (concentration, 1,000 IU/mL; 0.2 mL/mouse) intraperitoneally to the mice to avoid blood clots. After 10 min, anesthetize the mice with sodium pentobarbital (50 mg/kg, I.P. injection) and ensure that the mice stop responding to tail/toe pinches. Perform cervical dislocation 20 min after heparin administration.
- Transfer the mice onto the surgical platform, fix the mice in a supine position, sterilize the chest with 75% ethanol, and dry it with gauze or napkin.
3. Heart excision and aorta cannulation
- Lift the skin of the xiphoid with tissue forceps and make a minor lateral incision through the skin with tissue scissors. Perform a blunt dissection between the skin and fascia and extend the incision of the skin in a V-shape toward the axillae on both sides.
- Continue the same incision trace through the rib cage, and then, deflect the rib cage upward by clamping the sternum with tissue forceps to fully expose the heart and lungs.
- Peel off the pericardium using a curved forceps. Tear the thymus gland toward both sides by two curved forceps if it covers the great vessels. Gently pull the base of the heart toward the tail with curved forceps until a "Y"-shaped blood vessel (the aorta and its branch arteries) can be seen.
- To reserve different lengths of the aorta for cannulation and comparison, transect the aorta at the left common carotid artery (green line in Figure 2) and cut the brachiocephalic artery at the same time in some mice. Transect at the ascending aorta in other mice (black line in Figure 2).
NOTE: For those who are new to this procedure, this step can also be done under a stereoscopic microscope. - Excise the heart, and immediately immerse in Petri dish 1 to wash and pump out the residual blood.
- Transfer the heart to Petri dish 2, and trim any surplus tissue using fine iris scissors if necessary. For those who are new to this procedure, do this step under the stereomicroscope to avoid erroneously cutting the aorta or other heart structures.
- Push the syringe to expel air bubbles before aorta cannulation. Perform retrograde aorta cannulation with the assistance of two straight tying forceps (smooth jaws) under the stereomicroscope. Ensure that the whole cannulation process is under the liquid surface.
- Avoid penetrating the aortic valves and adjust the depths to the ascending aorta (the mouse that the aorta was transected at the left common carotid artery) and the aortic root (the mouse that the aorta was transected at the ascending aorta), respectively.
NOTE: The depth of aorta cannulation (referred to as simply as depth) is defined here as the position where the cannula tip is in the aorta or where the aorta is ligated. - Ligate the aorta with the pre-knot 3-0 suture to the cannula notch. Gently press the syringe content to rinse the residual blood.
NOTE: The blood will leave the coronary arteries and effuse from the dorsal veins If the depth is properly positioned. The heart and the atrial appendages will expand and become pale. - Remove and connect the cannula to the Langendorff apparatus. Once again, take care to avoid any air bubbles entering the heart.
NOTE: Be aware that the time from thoracotomy to initial perfusion should not exceed 5 min.
4. Heart perfusion
- First, prime and perfuse oxygenated Tyrode's solution for approximately 10 s (the volume of liquid running 10 s in the system used in this protocol is approximately 0.7 mL) if there is residual blood in the atria, and then switch to solution 1. However, just perfuse with solution 1 If there is no residual blood in the atria. Perfuse the heart for approximately 2 min.
- Switch to solution 3. Suck about 2.5 mL of solution 3 with a single-use sterile polyethylene pipet and prewarm it in the water bath for later use, with the remainder used for perfusion for approximately 11-12 min. Discard solution 3 perfused in the first 2 min. Recycle the rest to the perfusate reservoirs by the peristaltic pump for reuse until digestion is completed.
- Terminate the digestion when the heart becomes swollen and turns slightly pale and flaccid (spongy texture) or an imprint exists if the myocardium is gently pinched using a toothed forceps.
5. Cell isolation and calcium reintroduction
- Remove the ventricles and the atria with forceps, and place them in different Petri dishes. Add the prewarmed solution 3 to the Petri dishes.
- Triturate the tissue into a turbid texture with blunt forceps and gently pipette the tissue for even digestion. Avoid introducing air bubbles.
- Transfer the turbid digested tissue with the pipette into solution 4 to arrest the remaining enzyme activity, and then centrifuge for 20 s at 192×g. Remove the supernatant and add solution 5 into the cell sediment and pipette to evenly disperse the cells.
- Reintroduce calcium in a stepwise manner in order to avoid calcium paradox and calcium overload. Gradually add in a total of 50 µL 100 mM/L CaCl2 (at every 5 min interval of 5 µL, 10 µL, 15 µL, and 20 µL, respectively) to the cell suspension.
6. Cell storage
- For the patch clamp study, store the cells in Tyrode's solution. For other cellular studies, store the cells in solution 6.
- To ensure the accuracy of acute functional studies' (e.g., Ca2+ sparks, Ca2+ waves, Ca2+ release, Ca2+ leak, and patch clamp recordings) results, finish these kinds of functional experiments within the next 6 h.
Representative Results
This paper, where the cannula tip is positioned in the aorta, which is defined as the depth of aorta cannulation (referred to simply as depth), also represents where the aorta is ligated. The AM and VM isolated from a heart that was cannulated and ligated at the ascending aorta are represented as AMAA and VMAA, respectively. Moreover, AM and VM isolated from a heart that was cannulated and ligated at the aortic root are represented as AMAR and VMAR, respectively. Figure 2 shows the overview of the aorta and the transection positions. Also, Figure 3 shows the depths and the ligation places that correspond to the aorta transection positions. Depth was associated with the atria and atrial appendages' perfusion. Both atrial appendages are inflated when the cannula tip is at the ascending aorta, indicating sufficient atria perfusion. However, when at the aortic root, atria perfusion is insufficient and both atrial appendages are wizened (Figure 4). The CM morphology and viability that are isolated from the cannulated hearts at different depths after calcium reintroduction (Figure 5). Cell morphologies of AMAA, AMAR, VMAA, and VMAR are under the confocal microscope before and after calcium reintroduction. AMs are spindle-shaped, whereas VMs are rod-shaped with rectangular ends. Moreover, AMs and VMs have intact membranes, clear contours, clear striated sarcomeres, and smooth-surfaced (Figure 6). Cell viability was assessed via trypan blue staining. Normal cells with intact membranes can exclude trypan blue and will not be stained, whereas cells loss activity will intracellularly quickly accumulate trypan blue (Figure 7). AMs and VMs were placed in different object slides to perform cell counting. The total yields of AM and the percentage of viable spindle-shaped CMs (survival rate) were determined by transferring 10 µL of the cell suspension to an object slide and counted under an inverted phase-contrast microscope at 4 × 10 fields of view. The same method was used to determine the total yields of VMs (rod-shaped) and the percentage of viable VMs. This method is preferred over using a hemocytometer, because the CMs did not easily distribute into the counting area of the hemocytometer because of their size and shape. A bar graph (Figure 8) shows the survival rates of AMAA, AMAR, VMAA, and VMAR before and after calcium reintroduction. Each value represents the mean ± SD from 10 mice. Before calcium reintroduction, the survival rates of AMAA are significantly higher than those of AMAR (70.9% ± 2.8% and 41.0% ± 5.2%, respectively; p < 0.01). After calcium reintroduction, the survival rates of AMAA are significantly higher than those of AMAR (69.4% ± 3.0% and 37.7% ± 4.9%, respectively; p < 0.01).
The VMAA survival rates did not differ from those of the VMAR (89.5% ± 2.7% vs 88.1% ± 2.6%, respectively; p > 0.05) before calcium reintroduction. Similarly, the VMAA survival rates did not differ from those of the VMAR (82.2% ± 1.9% vs 82.9% ± 1.6%, respectively; p > 0.05) after calcium reintroduction.
A heart cannulated at depth as this protocol recommended (at the ascending aorta), a viable VMs and AMs yield of approximately 4.1 million and approximately 180,000, respectively, after calcium reintroduction. The whole-cell patch clamp recording of the sodium current (Figure 9A, B) and current densities (Figure 9C) in the isolated AM and VM confirm that the cell quality has met the requirements for electrophysiological experiments. The anatomy of the aorta (Figure 10) shows that the ostium of the atrial vessel is near the aortic root and is adjacent to the ostium of the coronary artery (CA). Table 3 shows the distance from the cannula tip to the CA ostium of hearts cannulated and ligated at the ascending aorta and the aortic root, respectively.
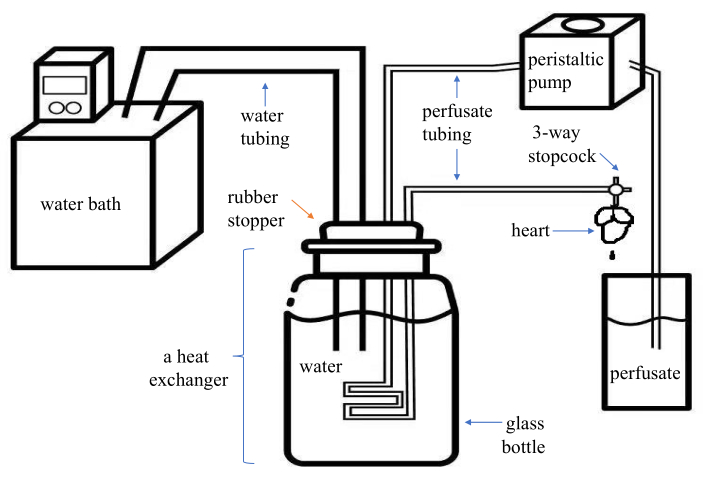
Figure 1. Schematic diagram of an assembled modified Langendorff system. This system is economical and portable for the users. It has two parts of plastic tubing-one for the water (inner diameter, 8 mm) and one for the perfusate (inner diameter, 1.5 mm)-of which the distal end is connected to a PE medical three-way stopcock with a Luer lock. A glass bottle containing water and with a rubber stopper form as a heat exchanger. The perfusate is pumped into the plastic tubing in the heat exchanger by the peristaltic pump and comes out from the three-way stopcock connected to the cannula. Please click here to view a larger version of this figure.
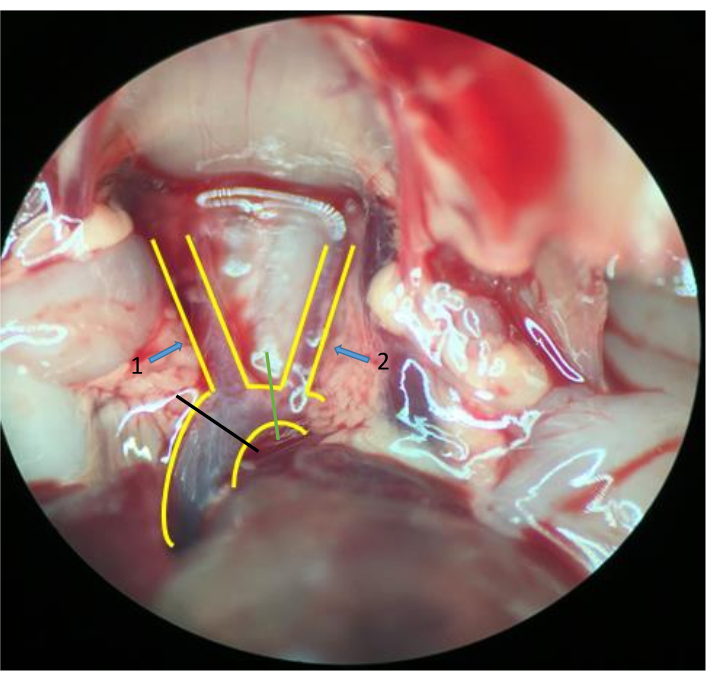
Figure 2. Aorta and tissues around. A "Y"-shaped blood vessel structure is the aorta and its branches: the brachiocephalic artery (arrow 1) and the left common carotid artery (arrow 2). Transect the aorta between the left common carotid artery (green line) and simultaneously cut the brachiocephalic artery in some mice; transect at the ascending aorta (black line) in other mice (stereomicroscope 10 × 2 magnification). Please click here to view a larger version of this figure.
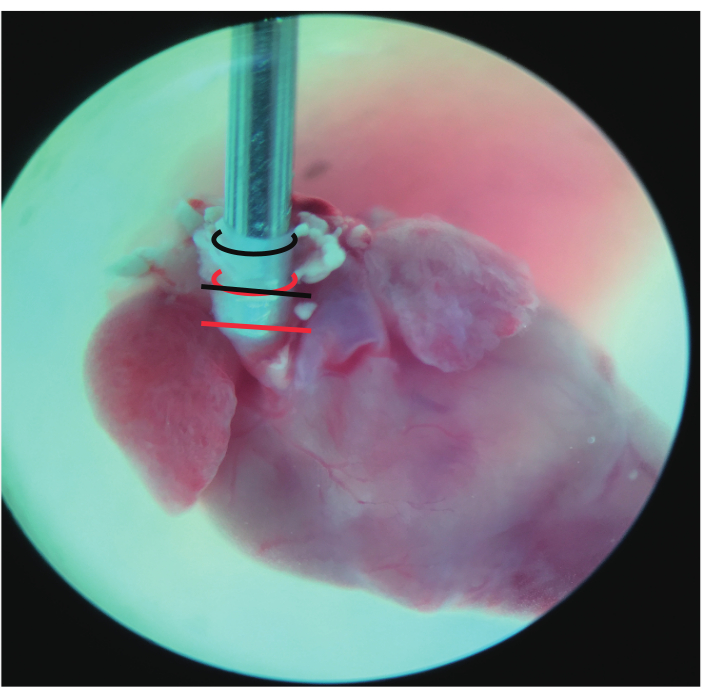
Figure 3. Frontal view of the cannulated heart. The black curved line represents the incisal edge of the aorta that was transected between the left common carotid artery. The red curved line represents the incisal edge of the aorta transected at the ascending aorta. The straight line represents where the aorta was ligated: black at the ascending aorta and red at the aortic root (stereomicroscope 10 × 2 magnification). Please click here to view a larger version of this figure.
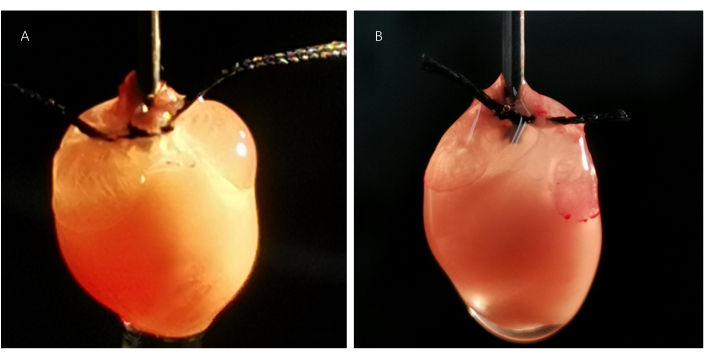
Figure 4. Perfusion state of the cannulated hearts. The atria are sufficiently perfused, and both atrial appendages are inflated in the heart (A) cannulated and ligated at the ascending aorta. However, both atrial appendages are wizened in the heart (B) cannulated and ligated at the aortic root, indicating poor atria perfusion. Please click here to view a larger version of this figure.
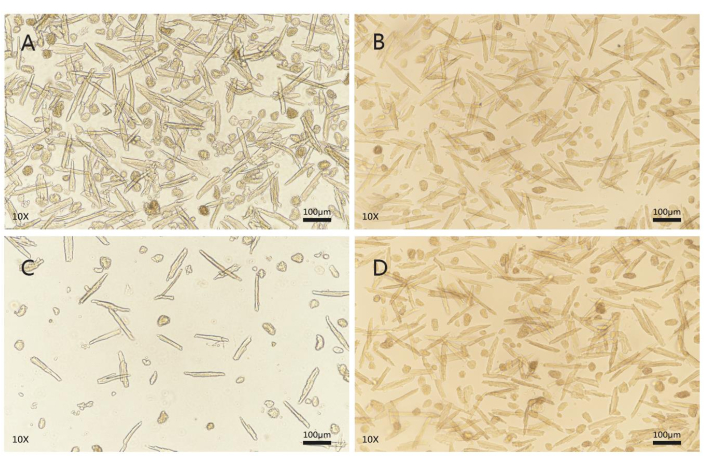
Figure 5. Cell morphology and viability evaluation after calcium reintroduction. AMs (A) and VMs (B) isolated from the heart cannulated and ligated at the ascending aorta are represented as AMAAs and VMAAs, respectively. AMs (C) and VMs (D) isolated from the heart cannulated and ligated at the aortic root are represented as AMARs and VMARs, respectively. High-quality CMs are quiescent and have intact membranes, clear contours, clear striated sarcomeres, and a smooth cell surface. AMs are spindle-shaped, whereas VMs are rod or brick-shaped with rectangular ends. CMs that spontaneously contract or contain blebs in the membrane are of poor quality, and those that shrink into a spherical shape are dead cells. A random field of view (fluorescence microscope, 10 × 10 magnification; scale bars, 100 µm). AM = atrial myocyte, VM = ventricular myocyte. Please click here to view a larger version of this figure.
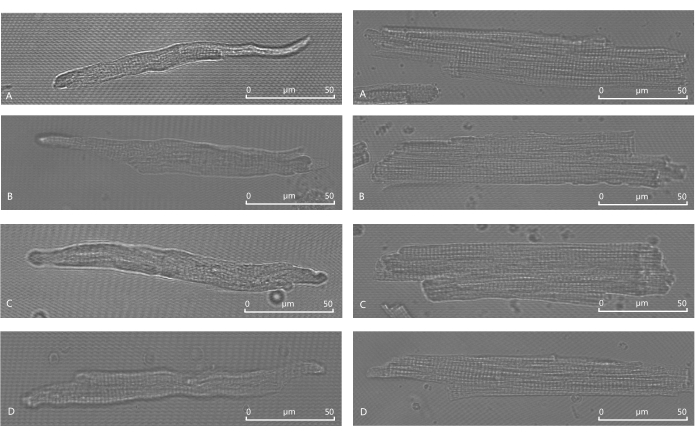
Figure 6. Cell morphology under a confocal microscope before and after calcium reintroduction. Before calcium reintroduction, AMAA (A) and AMAR (C) are spindle-shaped with clear contours, striated sarcomeres, and smooth membrane surfaces. After calcium reintroduction, AMAA (B) and AMAR (D) are also spindle-shaped with clear contours, striated sarcomeres, and smooth membrane surfaces. Before calcium reintroduction, VMAA (E) and VMAR (G) are rod- or brick-shaped with clear contours, striate sarcomeres, and smooth membrane surfaces with rectangular ends. After calcium reintroduction, VMAA (F) and VMAR (H) are also rod- or brick-shaped with clear contours, striated sarcomeres, and smooth membrane surfaces with rectangular ends (confocal microscope oil, 63 × 10 magnification; scale bars, 50 µm). Please click here to view a larger version of this figure.
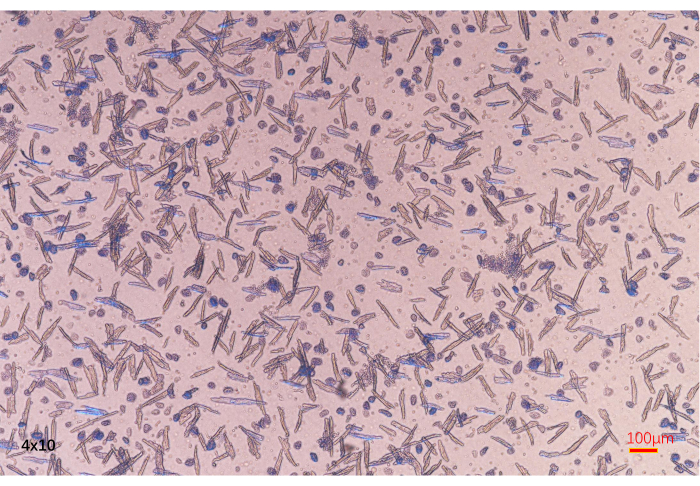
Figure 7. Cell viability assessment. Damaged cells that lose activity are stained by trypan blue. In contrast, viable cells cannot be stained by trypan blue (fluorescence microscope, 4 × 10 magnification; scale bars, 100 µm). Please click here to view a larger version of this figure.
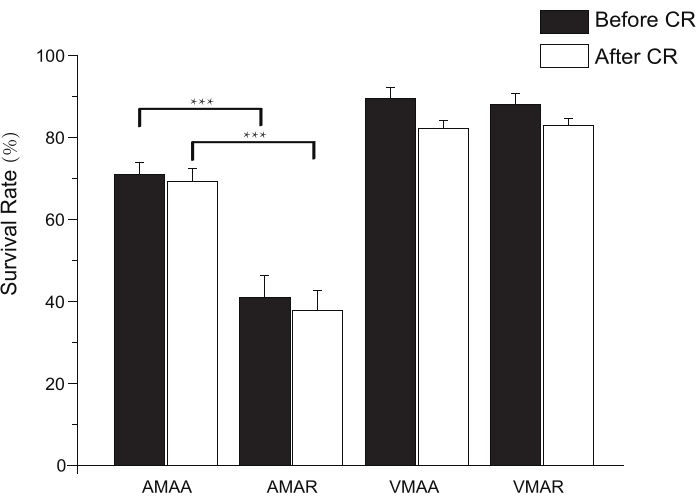
Figure 8. Bar graph showing the survival rates of AMAA, AMAR, VMAA, and VMAR before and after calcium reintroduction. CR = calcium reintroduction. Each value represents the mean ± SD from 10 mice. ***p < 0.01. Please click here to view a larger version of this figure.
| Solution | Contents (final concentration in mmol/L, if not specified differently) | noted |
| Perfusion solution (solution 1) | 113 NaCl, 4.7 KCl, 0.6 KH2PO4, 0.6 Na2HPO4, 1.2 MgSO4, 12 NaHCO3, 10 KHCO3, 10 HEPES, 15 Taurine, 5 Glucose, 10 2,3-butanedione monoxime(BDM) | Which can be stored for 3 days at 4 °C. Glucose, Taurine and BDM are added on the day of experiment. Prepare 200 mL of perfusion solution for each heart. |
| Tyrode’s solution (solution 2) | 140 NaCl, 4 KCl, 1 MgCl2, 10 HEPES, 1 CaCl2, 5 Glucose | Which can be stored for 3 days at 4 °C. CaCl2 and Glucose are added on the day of experiment, adjust pH to 7.3-7.4 with saturated NaOH at room temperature (28-30°C) with a PH meter. |
Table 1. Solutions for adult mouse CM isolation.
| Solution | Contents | noted |
| Digestion solution(solution 3) | 25 mL solution 1, 6μL 100 mM/L CaCl2, 25mg collagenase II, 50μL (2.5 % 10×) trypsin | for each heart |
| Stop solution 1(solution 4) | 9 mL solution 1, 1 mL FBS (Fetal Bovine Serum), 4μL 100 mM/L CaCl2 | for each heart |
| Stop solution 2(solution 5) | 9.5 mL solution 1, 0.5 mL FBS (Fetal Bovine Serum), 4μL 100 mM/L CaCl2 | for each heart |
| Cell resuspension solution(solution 6) | 13 mL solution 1, 7μL 1M/L CaCl2, BSA (Bull Serum Albumin) at a dose that can form a thin layer covering the surface of the liquid | for each heart |
Table 2. Solutions for adult mouse CM isolation and storage.
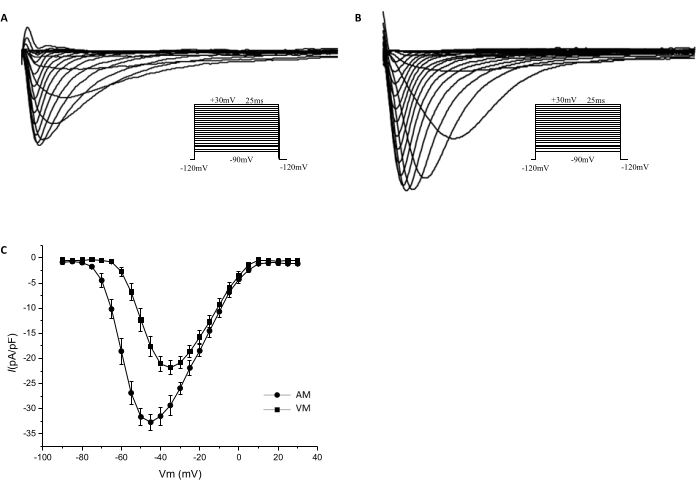
Figure 9. Current-voltage curves of the sodium channels. Whole-cell patch clamp techniques were used to record sodium currents of the isolated cardiomyocytes in the voltage clamp mode. The voltage clamp protocol is shown in the inset. Sodium currents recorded from the AM (A) and VM (B) are shown. The current densities at potentials of −45mV, −40mV, and −35 mV are significantly higher in AM (−32.71 ± 1.597 pA/pF, −31.49 ± 1.820 pA/pF, and −29.34 ± 1.939 pA/pF, respectively; n = 10) than in VM (−17.66 pA/pF ± 1.976 pA/pF, −21.09 ± 1.560 pA/pF, and −21.86 ± 1.381 pA/pF, respectively; n = 8; P < 0.05). (C) The I-V curves show the sodium current densities that were normalized to cell capacitance. Please click here to view a larger version of this figure.
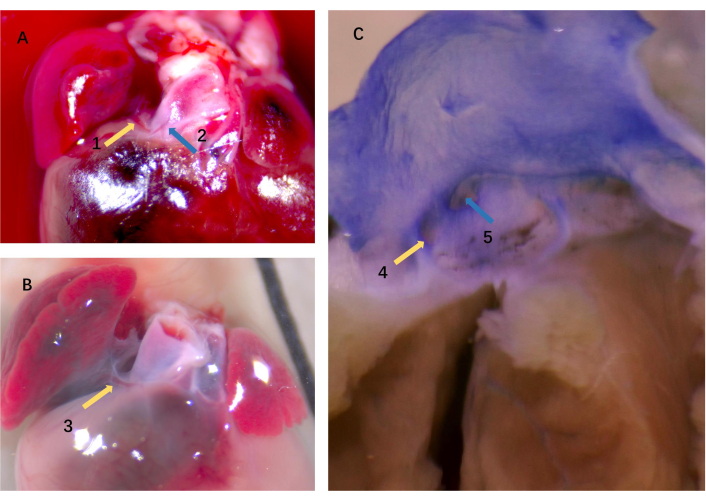
Figure 10. Origin and distribution of the atrial vessel. The atrial vessel (arrow 1) and the CA (arrow 2) in panel A. Panel B is a closer look at the atrial vessel (arrow 3). (C) Two different-sized ostia exist; one (arrow 4) corresponds to the atrial vessel that irrigated the atrial appendages, and the other one (arrow 5) corresponds to the CA (stereomicroscope 10 × 5 magnification). CA = coronary artery. Please click here to view a larger version of this figure.
| The serial number of the mice | 1 | 2 | 3 | 4 | 5 | 6 | 7 | 8 | 9 | 10 | ||
| The depth of aorta cannulation is at the ascending aorta | 0.5 | 0.6 | 0.3 | 0.4 | 0.8 | 0.3 | 0.8 | 0.7 | 0.5 | 0.7 | ||
| The depth of aorta cannulation is at the aortic root | 0.2 | -0.1 | 0.1 | 0 | -0.1 | 0.1 | -0.2 | 0 | -0.1 | 0 | ||
Table 3. Distance from the cannula tip to the coronary artery ostium. The hearts of C57BL/6 mice (n = 20) were used to cannulate and ligate the aorta at depths of the ascending aorta and the aortic root, respectively. The aorta is anatomized, and the distance from the cannula tip to the CA ostium was measured. The distance is measured in millimeters, and positive or negative signs represent the cannula tip above and below the CA ostium, respectively.
Discussion
Single CM is a valuable and indispensable tool in cellular level studies of cardiac function and diseases20. Hence, the isolation of viable CMs from the hearts is the initial and most crucial step. Cell quality is one of the significant determinants of conducting successful experiments, especially in optical and electrophysiological experiments. Compared with the CMs of other animals, rodent CMs are more vulnerable to ischemia and hypoxia because of a higher concentration of intracellular sodium ions, which favors calcium influx through the Na+/Ca2+ exchanger21. Moreover, the number of AMs is far lesser than that of VMs; thus, successful isolation is extremely difficult to achieve. The Langendorff method is excellent for isolating mice VMs22, but the success rate in isolating AMs is low, and few reports are available. The proper depth of aorta cannulation is also an essential factor in yielding ideal VMs aside from temperature, enzyme activity, PH, and water quality used for buffer preparation. The principle of the Langendorff method relies on retrograde perfusion of the heart. Upon perfusion, the aortic valve is closed; thereby, the perfusate is forced into the coronary arteries, delivering enzyme solution through the vessel branches, and the myocardial tissue is evenly digested. To achieve this kind of circulation pattern, the aorta must reserve enough length for cannulation and ligation, also the cannula tip must not penetrate the aortic valves or block the CA ostium. Thus, it is reasonable to speculate that the depth of aorta cannulation is also associated with atria perfusion, which affects the digestion efficacy of the atria and the yields of AM in a similar way. The protocol presented here confirmed the hypothesis, and crucial steps for optimizing cell yield along with the suggestions are noted below.
In step 1.9, to better secure the aorta, a blunt 20 G cannula with a notch (or a circumferential groove) from where the distance is 1 mm to the tip is recommended. Based on our experiences, the cannula size that is a little bit larger than the diameter of the aorta was found to prevent the cannula tip from puncturing the aortic valves during cannulation because the aorta, relying on its intrinsic elasticity, can snugly fit into the cannula and produce friction, which acts as a protective factor when moving forward or backward adjusting the cannulation depth. In terms of the notch's position, the heart will easily slip off during cannulation because of gravity if it is too near the cannula tip. Conversely, the space for adjusting the cannulation depth and ligation position will be very confined if too far. Given these circumstances, transecting the aorta between the left common carotid artery (as the green line in Figure 2) to ensure the aorta is long enough and can be cannulated and ligated at the ascending aorta is better in step 3.3. Whereas transecting at the ascending aorta, the reserved length for cannulation at least could secure the cannula tip close to the aortic root and will not penetrate the aortic valves after ligation. The anatomy of the aorta and the measurement of the distance from the cannula tip to the CA ostium indicate that transecting the aorta between the left common carotid artery is an ideal position to achieve a proper aorta cannulation depth.
Cannulation depth was found to be associated with the atria's perfusion, which in turn acts as a depth indicator. Figure 4 shows that atria perfusion is good when the depth is at the ascending aorta, and both atrial appendages are inflated. However, atria perfusion is insufficient when the depth is at (or approaching) the aortic root and both atrial appendages are wizened. The total and viable count of AM yielded from the inflated atrial appendages were higher (Figure 8). These findings indicate that the aorta cannulation depth can affect the perfusion and digestion of the atria and atrial appendages in a certain way and finally affect AM yield and quality. The yield and quality of AM were inferred to be associated with the distribution of the vessels that supply the atria. The study of Fernández et al.23 has demonstrated various anomalies in the origin and course of mouse CA. They found that the CAs ostia were highly variable and were not all located in the aortic sinus. Some CAs may originate anomalously from above the aortic sinuses, named the high take-off ostium. Some CAs may originate from the same aortic sinus, and the ostium of the atrium vessel is just nearby. The anatomy of the aorta in the present study (Figure 10) is also consistent with the finding of Fernández. This may be the cause why attempts to isolate AM by the Langendorff method have been largely unsuccessful if the cannulation depth is not appropriate. Thus, the cannula tip will have a greater chance of blocking the atrium vessel ostium that is adjacent to the CA ostium if not enough space is available between the cannula tip and the CA ostium. By contrast, the perfusion and cell yield of the ventricle were hardly affected as long as the aortic valves were not penetrated by the cannula tip. This is probably because the CAs that supply blood to the ventricle have bigger ostia and more origins. If one ostium was occluded by the cannula, ventricle perfusion can be compensated by another CA or the collateral circulation, whereas the blood vessel that supplies the atrium is rather small and has no substitute. Thus, the influence of the depth in aorta cannulation is important.
Other noteworthy factors and trouble shootings in the digestion and cell storage process are listed as follows. First, consider perfusing oxygenated Tyrode's solution in step 4.1 to make the muscle contract and pump out residual blood if the blood in the atria has not been rushed out after aorta ligation. This can help avoid the adverse effect of ca2+ and other materials released from the damaged erythrocytes. Second, perfusing ca2+-free solution ahead of time to dissociate the connection and expand the space between cells can improve the efficacy of enzyme digestion because intercalated disks between CMs are calcium-dependent intercellular junctions. However, time should be limited to 3-5 min to avoid the calcium paradox phenomenon24. A mixed enzyme solution is recommended. Collagenase type II disrupts the extracellular matrix network, and trypsin helps clear the granular material that remains on the cell surface if collagenase II digestion is incomplete. This ensures a smooth cell surface, which is critical to forming a GΩ seal in the patch clamp recording. Nevertheless, trypsin concentration should be controlled in the proper range to avoid over digestion and cell injury because it can degrade the membrane protein. Using collagenase type II alone to improve cell yield may often lead to tissue over digestion, and the isolated CMs will be calcium intolerant after prolonged collagenase exposure25. The use of 2,3-butanedione monoxime (BDM), a substance that prevents spontaneous contraction by inhibiting the myosin ATPase and preventing cross-bridge formation, is still controversial26,27,28,29. According to previous experience, adding BDM is necessary for this protocol. Enzyme solution is prepared with solution 1 although solution 1 does not contain calcium, and calcium is added to activate the enzyme. The benefit of adding BDM in the perfusion solution includes (1) inhibiting myocytes contraction and reducing oxygen consumption during enzyme solution perfusion and (2) preventing myocytes from hypoxia and improving the quality of the isolated myocytes. Some studies reported that BDM may have a potential adverse influence on cellular electrical properties. However, the results of the whole-cell patch clamp recording of the sodium current did not indicate an undesirable effect. In the cell storage step (step 6), numerous studies have chosen the KB buffer, a calcium-free but high potassium concentration solution, in which cells can maintain a better state because they are in polarized and low metabolic conditions. However, the glycocalyx of the cell membrane will separate from the lipid bilayer in the absence of exogenous calcium for a certain length of time and the membrane permeability will increase, affecting the subsequent functional analysis30,31,32.
All myocytes isolation techniques can be essentially categorized currently into either chunk (a small piece of tissue) digestion in an enzymatic solution or CA perfusion with enzymatic solution (the Langendorff perfusion)22. Compared with the Langendorff method, the chunk digestion method is easier to perform and is also routinely used for isolating CMs in many laboratories. However, this method normally produces a low yield of CMs of poor quality from adult tissues22. Moreover, cells isolated by this method may not be suitable for conducting comparative experiments. For example, when testing the cell type-specific drug effects between AM and VM, the impact of different isolation conditions cannot be neglected or excluded. This is because the myocardium and the tissue density of the ventricle are much thicker and denser than that of the atrium, resulting in differing digestion times and enzyme concentrations. Furthermore, excessive agitation and pipetting of the tissue during digestion will damage the cells and significantly impact functional studies. Moreover, many previous studies have shown that AMs are more vulnerable to calcium. However, AMs isolated by the current protocol can be tolerant of gradient calcium reintroduction probably because the tissue is easy to rupture at the end of the digestion process. Thus, mechanical damage is less, whereas cells would suffer more mechanical damages as steps of the chunk method need repeated rupture and centrifugal. More recently, Ackers et al.33 reported a simplified, Langendorff-free method for the isolation of viable cardiac myocytes and nonmyocytes. The VMs and the fibroblasts can be effectively isolated, but the amount of the AMs was not mentioned. However, this protocol has several limitations. First, the distribution of the heart blood vessels may have variations for individual differences and mice strain, and the recommended cannulation depth cannot guarantee a successful AMs isolation for each time. Second, for those who are new to this procedure may take a certain amount of time to practice aorta transection and retrograde aorta cannulation. Finally, this method was not tested in other heart disease models except in healthy and elderly mice. Hence, it will require adjustments in enzyme concentrations and time of digestion because of the heart's fibrosis extent. The disadvantage of different digestion conditions encountered in the chunk method will not be a problem in the Langendorff method in which the enzyme solution is evenly distributed to the tissue by the vessel beds.
In summary, the protocols for the simultaneous isolation of single AM and VM described here have demonstrated that the proper aorta cannulation depth can effectively improve atrium perfusion and AM yield. The CMs isolated by this method are of high quality, possess good calcium tolerance, and have been successfully applied to patch clamp recording and calcium handling (Ca2+ release and Ca2+ wave measurement by the IonOptix system) in the team34. It is anticipated that the isolation protocol can be used for cell preparation in a series of cellular and subcellular investigations, which will help deepen the understanding of cardiac physiology and pathology. Importantly, it will enable the discovery of more clinically relevant heart disease mechanisms and intervention methods.
Disclosures
The authors have nothing to disclose.
Acknowledgements
This work was supported by grants of National Natural Science Foundation of China (No. 81770322, 81870244, 81500254, 81870243, 81470465) and the Beijing Natural Science Foundation (No. 7192051). Author contributions: Bai and Liu designed and conceived the project. Wen and Ruan provided valuable advices for the experiments. Wu and Linling Li carried out the experimental work and played key roles in data acquisition, analysis and interpretation. Li participated in the Langendorff apparatus assembling. Peng, Zhang, Wang and Yang participated in preparation of the reagents and solutions before experiment. Wu wrote the article.
Materials
| Name | Company | Catalog Number | Comments |
| 2,3-butanedione monoxime (BDM) | Sigma-Aldrich | 31550 | |
| Bull Serum Albumin (BSA) | Sigma-Aldrich | A2153 | |
| CaCl2 | Sigma-Aldrich | C4901 | |
| Collagenase type II | Worthington | 43D14160 | |
| Excel | data acquisition and analysis | ||
| Fetal Bovine Serum (FBS) | Zhejiang Tianhang Biotechnology | 150207 | |
| Glucose | Sigma-Aldrich | G7528 | |
| HEPES | Sigma-Aldrich | H3375 | |
| HEPES | Sigma-Aldrich | H3375 | |
| KCl | Sigma-Aldrich | P9333 | |
| KH2PO4 | Sigma-Aldrich | P5655 | |
| KHCO3 | Sigma-Aldrich | 237205 | |
| MgCl2 | Sigma-Aldrich | M8266 | |
| MgSO4 | Sigma-Aldrich | M7506 | |
| Na2HPO4 | Sigma-Aldrich | S7907 | |
| NaCl | Sigma-Aldrich | S7653 | |
| NaHCO3 | Sigma-Aldrich | S5761 | |
| Origin 8.5 | OriginLab, Northampton, MA,US | data acquisition and analysis | |
| Peristaltic pump | Longerpump | BT100-2J | |
| Sodium pentobarbital | Shanghai Reagent Factory | 810923 | |
| Taurine | Sigma-Aldrich | T0625 | |
| Trypan blue | Solarbio | C0040 | |
| Trypsin | Invitrogen | 15090046 | |
| Water bath | JULABO | ED (v.2) |
References
- Mahmood, S. S., Levy, D., Vasan, R. S., Wang, T. J. The framingham heart study and the epidemiology of cardiovascular diseases: a historical perspective. Lancet. 383 (9921), 999-1008 (2014).
- Olejnickova, V., Novakova, M., Provaznik, I. Isolated heart models: cardiovascular system studies and technological advances. Medical & Biological Engineering & Computing. 53 (7), 669-678 (2015).
- Guinamard, R., Hof, T., Sallé, L. Current recordings at the single channel level in adult mammalian isolated cardiomyocyte. Methods in Molecular Biology. 1183, 291-307 (2014).
- Santana, L. F., Kranias, E. G., Lederer, W. J. Calcium sparks and excitation-contraction coupling in phospholamban-deficient mouse ventricular myocyte. The Journal of Physiology. 503, 21-29 (1997).
- Chou, C. C., et al. Intracellular calcium dynamics and anisotropic reentry in isolated canine pulmonary veins and left atrium. Circulation. 111 (22), 2889-2897 (2005).
- Brittsan, A. G., et al. Chronic SR Ca2+-ATPase inhibition causes adaptive changes in cellular Ca2+ transport. Circulation Research. 92 (7), 769-776 (2003).
- Mohler, P. J., et al. Ankyrin-B mutation causes type 4 long-QT cardiac arrhythmia and sudden cardiac death. Nature. 421 (6923), 634-639 (2003).
- Paigen, K. A miracle enough: the power of mice. Nature medicine. 1 (3), 215-220 (1995).
- Ni, L., et al. Atrial-specific gene delivery using an adeno-associated viral vector. Circulation Research. 124 (2), 256-262 (2019).
- Dobrev, D., Wehrens, X. H. T. Mouse models of cardiac arrhythmias. Circulation Research. 123 (3), 332-334 (2018).
- Jian, Z., et al. In vivo cannulation methods for cardiomyocytes isolation from heart disease models. PLoS One. 11 (8), 0160605 (2016).
- Li, D., Wu, J., Bai, Y., Zhao, X., Liu, L. Isolation and culture of adult mouse cardiomyocytes for cell signaling and in vitro cardiac hypertrophy. Journal of Visualized Experiments: JoVE. (87), e51357 (2014).
- Graham, E. L., et al. Isolation, culture, and functional characterization of adult mouse cardiomyoctyes. Journal of Visualized Experiments JoVE. (79), e50289 (2013).
- Roth, G. M., Bader, D. M., Pfaltzgraff, E. R. Isolation and physiological analysis of mouse cardiomyocytes. Journal of Visualized Experiments: JoVE. (91), e51109 (2014).
- Motayagheni, N. Modified Langendorff technique for mouse heart cannulation: Improved heart quality and decreased risk of ischemia. MethodsX. 4, 508-512 (2017).
- Kohncke, C., et al. Isolation and Kv channel recordings in murine atrial and ventricular cardiomyocytes. Journal of Visualized Experiments: JoVE. (73), e50145 (2013).
- Wagner, E., Brandenburg, S., Kohl, T., Lehnart, S. E. Analysis of tubular membrane networks in cardiac myocytes from atria and ventricles. Journal of Visualized Experiments: JoVE. (92), e51823 (2014).
- Plačkić, J., Kockskämper, J. Isolation of atrial and ventricular cardiomyocytes for in vitro studies. Methods in Molecular Biology. 1816, 39-54 (2018).
- Andrade, J., Khairy, P., Dobrev, D., Nattel, S. The clinical profile and pathophysiology of atrial fibrillation: relationships among clinical features, epidemiology, and mechanisms. Circulation Research. 114 (9), 1453-1468 (2014).
- Louch, W. E., Sheehan, K. A., Wolska, B. M. Methods in cardiomyocyte isolation, culture, and gene transfer. Journal of Molecular and Cellular Cardiology. 51 (3), 288-298 (2011).
- Bers, D. M. Cardiac Na/Ca exchange function in rabbit, mouse and man: what's the difference. Journal of Molecular and Cellular Cardiology. 34 (4), 369-373 (2002).
- Chen, X., O'Connell, T. D., Xiang, Y. K. With or without Langendorff: a new method for adult myocyte isolation to be tested with time. Circulation Research. 119 (8), 888-890 (2016).
- Fernández, B., et al. The coronary arteries of the C57BL/6 mouse strains: implications for comparison with mutant models. Journal of Anatomy. 212 (1), 12-18 (2008).
- Zimmerman, A. N., Hulsmann, W. C. Paradoxical influence of calcium ions on the permeability of the cell membranes of the isolated rat heart. Nature. 211 (5049), 646-647 (1966).
- Schlüter, K. D., Schreiber, D. Adult ventricular cardiomyocytes: isolation and culture. Methods in Molecular Biology. 290, 305-314 (2005).
- Thum, T., Borlak, J. Butanedione monoxime increases the viability and yield of adult cardiomyocytes in primary cultures. Cardiovascular Toxicology. 1 (1), 61-72 (2001).
- Hall, A. R., Hausenloy, D. J. Mitochondrial respiratory inhibition by 2,3-butanedione monoxime (BDM): implications for culturing isolated mouse ventricular cardiomyocytes. Physiological Reports. 4 (1), 12606 (2016).
- Scaduto, R. C., Grotyohann, L. W. 2,3-butanedione monoxime unmasks Ca (2+)-induced NADH formation and inhibits electron transport in rat hearts. American Journal of Physiology. Heart and Circulatory Physiology. 279 (4), 1839-1848 (2000).
- Watanabe, Y., et al. Inhibitory effect of 2,3-butanedione monoxime (BDM) on Na (+)/Ca (2+) exchange current in guinea-pig cardiac ventricular myocytes. British Journal of Pharmacology. 132 (6), 1317-1325 (2001).
- Benndorf, K., Boldt, W., Nilius, B. Sodium current in single myocardial mouse cells. European Journal of Physiology. 404 (2), 190-196 (1985).
- Fiset, C., Clark, R. B., Larsen, T. S., Giles, W. R. A rapidly activating sustained K+ current modulates repolarization and excitation-contraction coupling in adult mouse ventricle. The Journal of Physiology. 504, 557-563 (1997).
- Isenberg, G., Klockner, U. Calcium tolerant ventricular myocytes prepared by preincubation in a "KB medium". European Journal of Physiology. 395 (1), 6-18 (1982).
- Ackers-Johnson, M., et al. A simplified, Langendorff-free method for concomitant isolation of viable cardiac myocytes and nonmyocytes from the adult mouse heart. Circulation Research. 119 (8), 909-920 (2016).
- Jiang, L., et al. Ibrutinib promotes atrial fibrillation by inducing structural remodeling and calcium dysregulation in the atrium. Heart Rhythm. 16 (9), 1374-1382 (2019).
Reprints and Permissions
Request permission to reuse the text or figures of this JoVE article
Request PermissionThis article has been published
Video Coming Soon
ABOUT JoVE
Copyright © 2025 MyJoVE Corporation. All rights reserved