Self-Assembly of Microtubule Tactoids
In This Article
Summary
This article presents a protocol for the formation of microtubule assemblies in the shape of tactoids using MAP65, a plant-based microtubule crosslinker, and PEG as a crowding agent.
Abstract
The cytoskeleton is responsible for major internal organization and re-organization within the cell, all without a manager to direct the changes. This is especially the case during mitosis or meiosis, where the microtubules form the spindle during cell division. The spindle is the machinery used to segregate genetic material during cell division. Toward creating self-organized spindles in vitro, we recently developed a technique to reconstitute microtubules into spindle-like assemblies with a minimal set of microtubule-associated proteins and crowding agents. Specifically, MAP65 was used, which is an antiparallel microtubule crosslinker from plants, a homolog of Ase1 from yeast and PRC1 from mammalian organisms. This crosslinker self-organizes microtubules into long, thin, spindle-like microtubule self-organized assemblies. These assemblies are also similar to liquid crystal tactoids, and microtubules could be used as mesoscale mesogens. Here, protocols are presented for creating these microtubule tactoids, as well as for characterizing the shape of the assemblies using fluorescence microscopy and the mobility of the constituents using fluorescence recovery after photobleaching.
Introduction
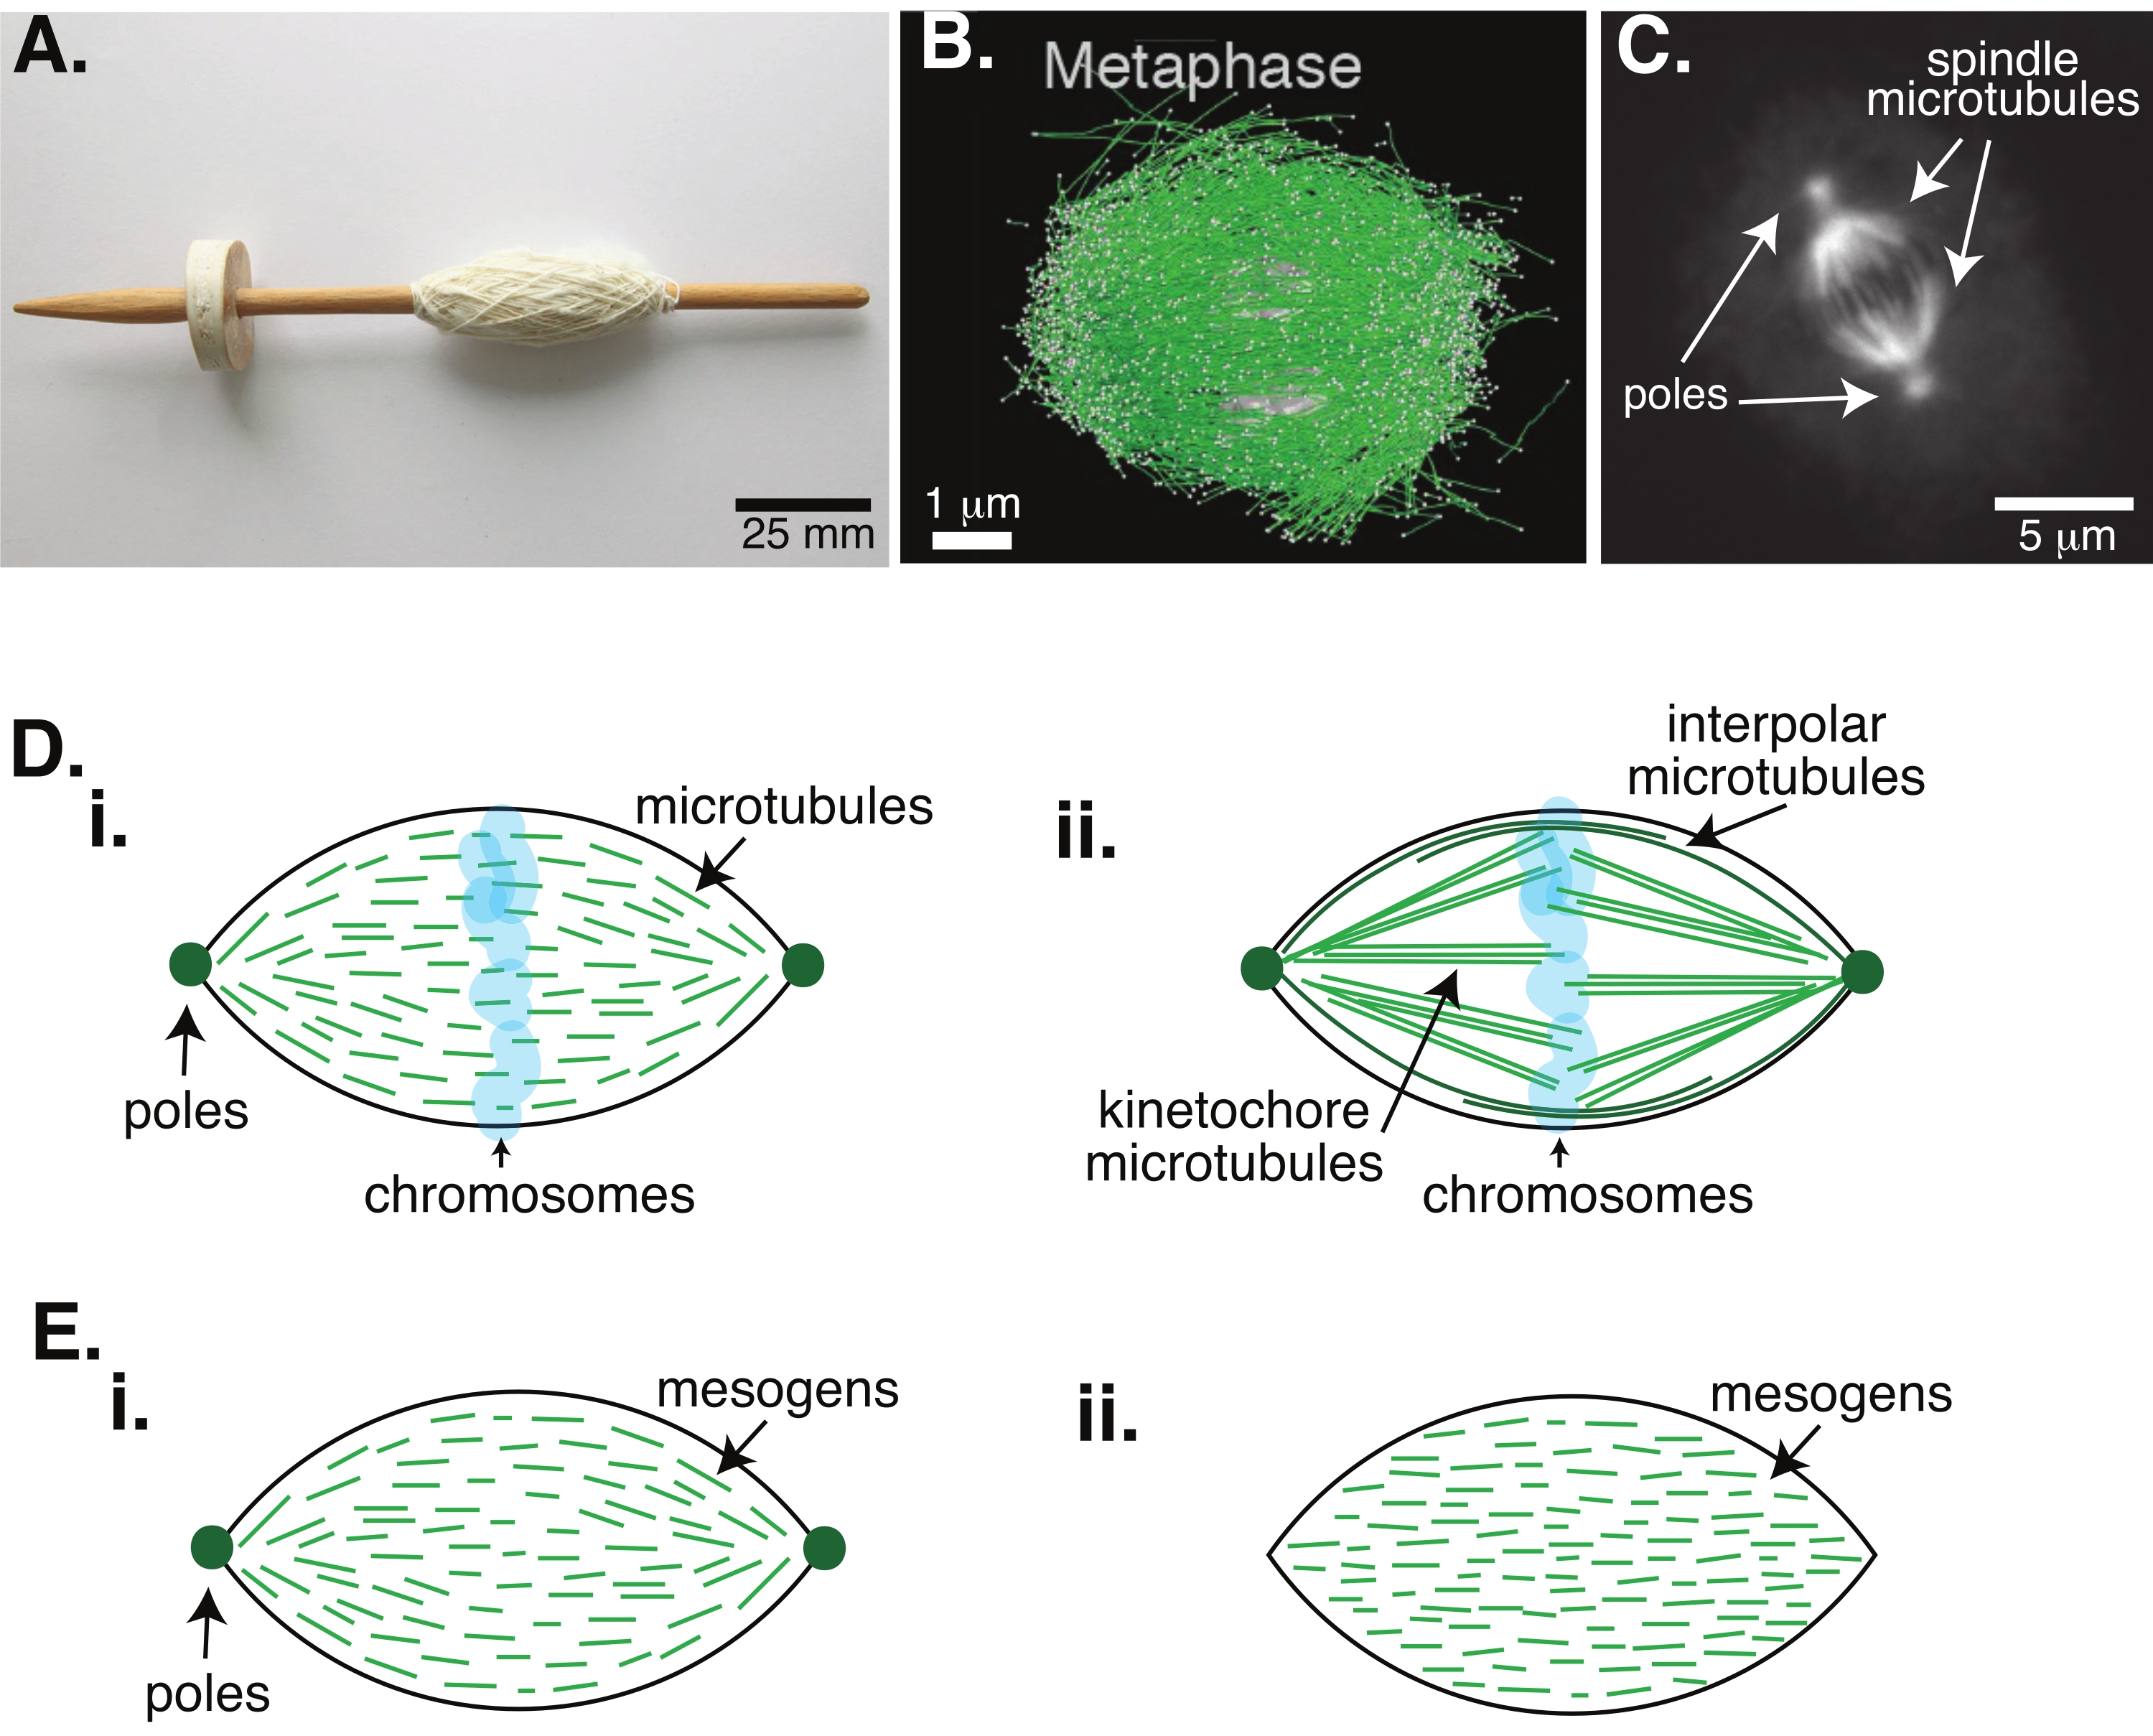
Cell division via mitosis is one of the most important biological processes to sustain life. The microtubule filaments, composed of tubulin dimers, are essential structural elements of this process. The transient machinery created in metaphase when the chromosomes are aligning in the cell center is called the mitotic spindle due to its shape, which is like a spindle of a loom covered in threads (Figure 1A). It is well-established across many organisms that microtubules are used in metaphase to push and pull condensed chromosomes into the center of the cell, aligning them and hooking them up to microtubules that will pull them apart in anaphase (Figure 1B,C). The spindle forms in both meiosis (Figure 1B) and mitosis (Figure 1C), created from many overlapping microtubules not wrapped around the central axis like thread but running parallel to the interface. Creating these microtubule-based structures requires associated proteins that crosslink and associated enzymes that can act as motors to help push and pull the chromosomes1.
Studies of meiotic spindles have shown that the microtubules are short, dynamic, and overlapping in crosslinked arrays2,3,4,5,6 (Figure 1Di). Due to the physical organization of these short microtubules, the meiotic spindle is similar to a liquid crystal tactoid (Figure 1E). Indeed, spindles have been shown to coalesce and merge, as one would expect from liquid crystal tactoids5.
Many studies dating back to the 1960s have used fixation, serial sections, and electron microscopy to determine that there are two types of microtubules inside the mitotic spindle7,8,9,10. The first type is called the kinetochore microtubules, which connect the spindle pole to the kinetochore. The second type is called the interpolar or polar microtubules, which grow past the chromosomes and overlap at the midzone (Figure 1Dii)8,9,10. A third type is called the astral microtubules, which are outside of the spindle and connect the poles to the cell edge; these microtubule organizations are outside of the scope of the current discussion. There have been recent studies on the interaction between augmin6 and gamma-tubulin ring complex influencing nucleation centers for microtubules, resulting in a mitotic spindle with shorter microtubules like in Figure 1D.
Since microtubules are longer than they are wide, with a high aspect ratio and high stiffness, they are like scaled-up versions of liquid crystal molecules. In soft matter physics, atoms and molecules have been approximated using minimal interactions to deduce the physical mechanisms of phase transitions, including nucleation and the melting of crystals11. Similarly, microtubules are mesoscale objects that are scaled-up versions of liquid crystal molecules, giving insights into the physics of liquid crystal dynamics, including the nucleation and growth of the nematic phases from isotropic ones. Further, as discussed above, the meiotic spindle displays properties like those of a liquid crystal tactoid, a nematic state that nucleates and grows from the isotropic state of liquid crystal molecules3,4,5. For tactoids, nucleation and growth are like that of other crystals (i.e., requiring a relatively high concentration of mesogens [the molecules that form liquid crystals]). The unique "spindle" shape of the tactoid comes from the local alignment of the liquid crystal mesogens that align into the nematic phase (Figure 1E). They cannot form a rounded crystal because the molecules are highly asymmetric. Given the nature of the microtubules, it is perhaps not surprising that the mitotic spindle-machinery made from a high local concentration of microtubules is also of the same shape, whether it is called a tactoid or spindle. Tactoids can be bipolar, with poles at the tapered ends (Figure 1Ei), or homogeneous, with poles effectively at infinity (Figure 1Eii).
Given the importance of spindle formation, efforts have been underway toward self-organized spindle formation in vitro by demonstrating microtubule condensation into bundles via ionic species12,13, crowding agents that create depletion interactions14,15, and specific microtubule crosslinking proteins13,16,17,18,19,21. Surprisingly, although these agents all work to increase the local concentration of microtubules, they often result in long microtubule bundles but not tactoids. One reason why these bundles are long could be that the microtubules comprising them are also long. Recent work using shorter microtubules also reported longer bundles that are not tapered at the end15; in this case, the bundles are held together with motor proteins that cause extension of the bundles and, thereby, make them longer. Short microtubules with non-extensile crosslinkers are needed for tapered, spindle-like assemblies, as described here.
Recently, we have developed a technique to enable the creation of microtubule tactoids using the antiparallel crosslinker, MAP65, in the presence of nucleating stable microtubules22. The microtubules needed to be short, yet few known regulators of microtubule length can cap microtubules against dynamic instability or end-to-end annealing. Instead, GMPCPP was used to nucleate and stabilize the filaments after growth. This allowed for creating a high density of short microtubules that could self-organize into tactoids. These tactoids were homogeneous when viewed under birefringence. In addition to short microtubules, a specific antiparallel crosslinker, MAP65, was employed to form the tactoids (Figure 2). MAP65 is a plant microtubule-associated protein in the PRC1/Ase1 family of mitotic crosslinkers23. MAP65 exists as a dimer, with a strong affinity to bind to itself as well as the microtubules24. Unlike the meiotic spindle and tactoids observed with actin filaments25,26,27, which are bipolar and have the liquid-like properties of liquid crystals, microtubule tactoids have been observed to be solid-like22,28.
Here, protocols are presented for creating the microtubule tactoids and characterizing the shape of the assemblies and the mobility of the constituents using fluorescence-based techniques.
Protocol
NOTE: Unless otherwise stated, parts of the experiment can be performed on a lab bench while wearing appropriate protective equipment (gloves).
1. Coverslip silanization
NOTE: Coverslips must be silanized to be used with the polymer brush coating employed in these experiments. This is a hydrophobic silanization treatment that allows a block copolymer with a hydrophobic central block to bind and create a polymer brush. The following steps should be performed in a fume hood to prevent exposure to toxic vapors while wearing gloves. Dimethyldichlorolsilane is highly toxic and must be handled with utmost care.
- Rinse the coverslips with ddH2O, 70% ethanol, and ddH2O in order. Dry them with lint-free laboratory wipes between each rinse. This removes dust and water-soluble or organic particles from the surface before treatment.
- Place the coverslips in a metal coverslip-holding rack and transfer the rack to a UV-Ozone (UVO) machine. Irradiate the coverslips with UVO for 20 min to remove any background fluorescence. A plasma chamber can be used instead of UVO.
- Using tweezers, transfer the coverslips from the metal rack used for UVO treatment to a different metal rack used for silanization. Do not use the same racks for both, as it will cause high levels of oxidation when UVO is applied. Pre-clean the racks with water and ethanol so that no residual chemicals remain from previous uses.
- Immerse the rack with the coverslips in a container with 100% acetone for 1 h. Rinse the container 3x with tap water and then 3x with ddH2O to remove all acetone.
- Immerse the rack with the coverslips in 100% ethanol for 10 min. Rinse the container 3x with tap water and then 3x with ddH2O to remove all ethanol.
- Immerse the rack with the coverslips 3x in ddH2O for 5 min each.
- Immerse the rack with the coverslips in 0.1 M KOH (50 mL of 1 M KOH in 450 mL of ddH2O) for 15 min. Rinse the container 3x with tap water and then 3x with ddH2O to remove all KOH.
- Immerse the rack with coverslips 3x in ddH2O for 5 min each.
- Air-dry the rack with the coverslips overnight in a fume hood or laminar flow hood.
- After completely drying the rack and the coverslips, immerse them for 5 min in 2% dimethyldichlorosilane (DDS) taken in a different container that is used specifically for silane. Do not let anything that is not dry come into contact with the silane.
- Immerse the rack and coverslips 2x in a container with 100% ethanol for 5 min. Rinse the container 3x with tap water and then 3x with ddH2O.
- Immerse the rack and coverslips 3x in ddH2O for 5 min each.
- Air-dry the rack with the coverslips overnight in a fume hood or laminar flow hood.
- After this final drying step, transfer the coverslips back into coverslip boxes using tweezers. These coverslips can be used in the next 1-2 months. Old coverslips will begin to lose their coating and should be discarded.
2. Tubulin preparation
NOTE: The purchased tubulin comes as a lyophilized powder that is either unlabeled or labeled with fluorophores. Lyophilized tubulin is stored in a −80 °C freezer. The following procedure is used to mix unlabeled tubulin with labeled tubulin in a ratio that is good for visualization.
- Remove from the −80 °C freezer one aliquot of unlabeled tubulin containing 1 mg of lyophilized tubulin powder and keep it on ice. Add 200 µL of cold PEM-80 to the tube to bring the tubulin concentration to 5 mg/mL. Keep it on ice for 10 min to dissolve all the lyophilate.
- Remove from the −80 °C freezer one aliquot of rhodamine-labeled tubulin containing 20 µg of lyophilized tubulin powder and keep it on ice. Add 4 µL of cold PEM-80 to the tube to bring the tubulin concentration to 5 mg/mL. Keep it on ice for 10 min to fully dissolve the lyophilate.
- Once dissolved, add 100 µL of unlabeled resuspended tubulin solution to the 4 µL solution of rhodamine-labeled tubulin. Pipette 6x-7x very slowly to mix. If aggregates are visible, centrifuge the solubilized tubulin for 10 min at 90,000 x g to remove aggregates by discarding the pellet and retaining the supernatant. This tubulin mix will result in ~4% labeled tubulin.
- Drop-freeze the remaining 100 µL of unlabeled tubulin into liquid nitrogen (LN2) and store it at −80 °C to be used for additional tubulin mixes.
- Take the labeled tubulin mix and aliquot into seven tubes with 15 µL each. Each aliquot can be used for a single experimental chamber. Drop-freeze the remaining aliquots and store them at −80 °C for future experiments.
3. MAP65 purification
NOTE: MAP65 is not commercially available and, thus, needs to be purified for this work. The protocol has been elaborated previously in several publications23,29.
- Transform the MAP65 plasmid and GFP-MAP65 plasmid into BL21 bacteria strain for protein expression.
- Grow BL21 bacteria to an optical density of 0.6-1 at 600 nm. Induce protein production using the lac operator and grow the bacteria overnight.
- Pellet the cultures and lyse the bacteria.
- Collect the lysate after centrifugation and incubate it with beads that have a nickel ion available to bind the 6x-histidine tag.
- Elute the protein using imidazole and desalt it.
- Drop-freeze the protein with liquid nitrogen and store it at −80 °C for use within 1 year.
4. Assembly of flow chambers
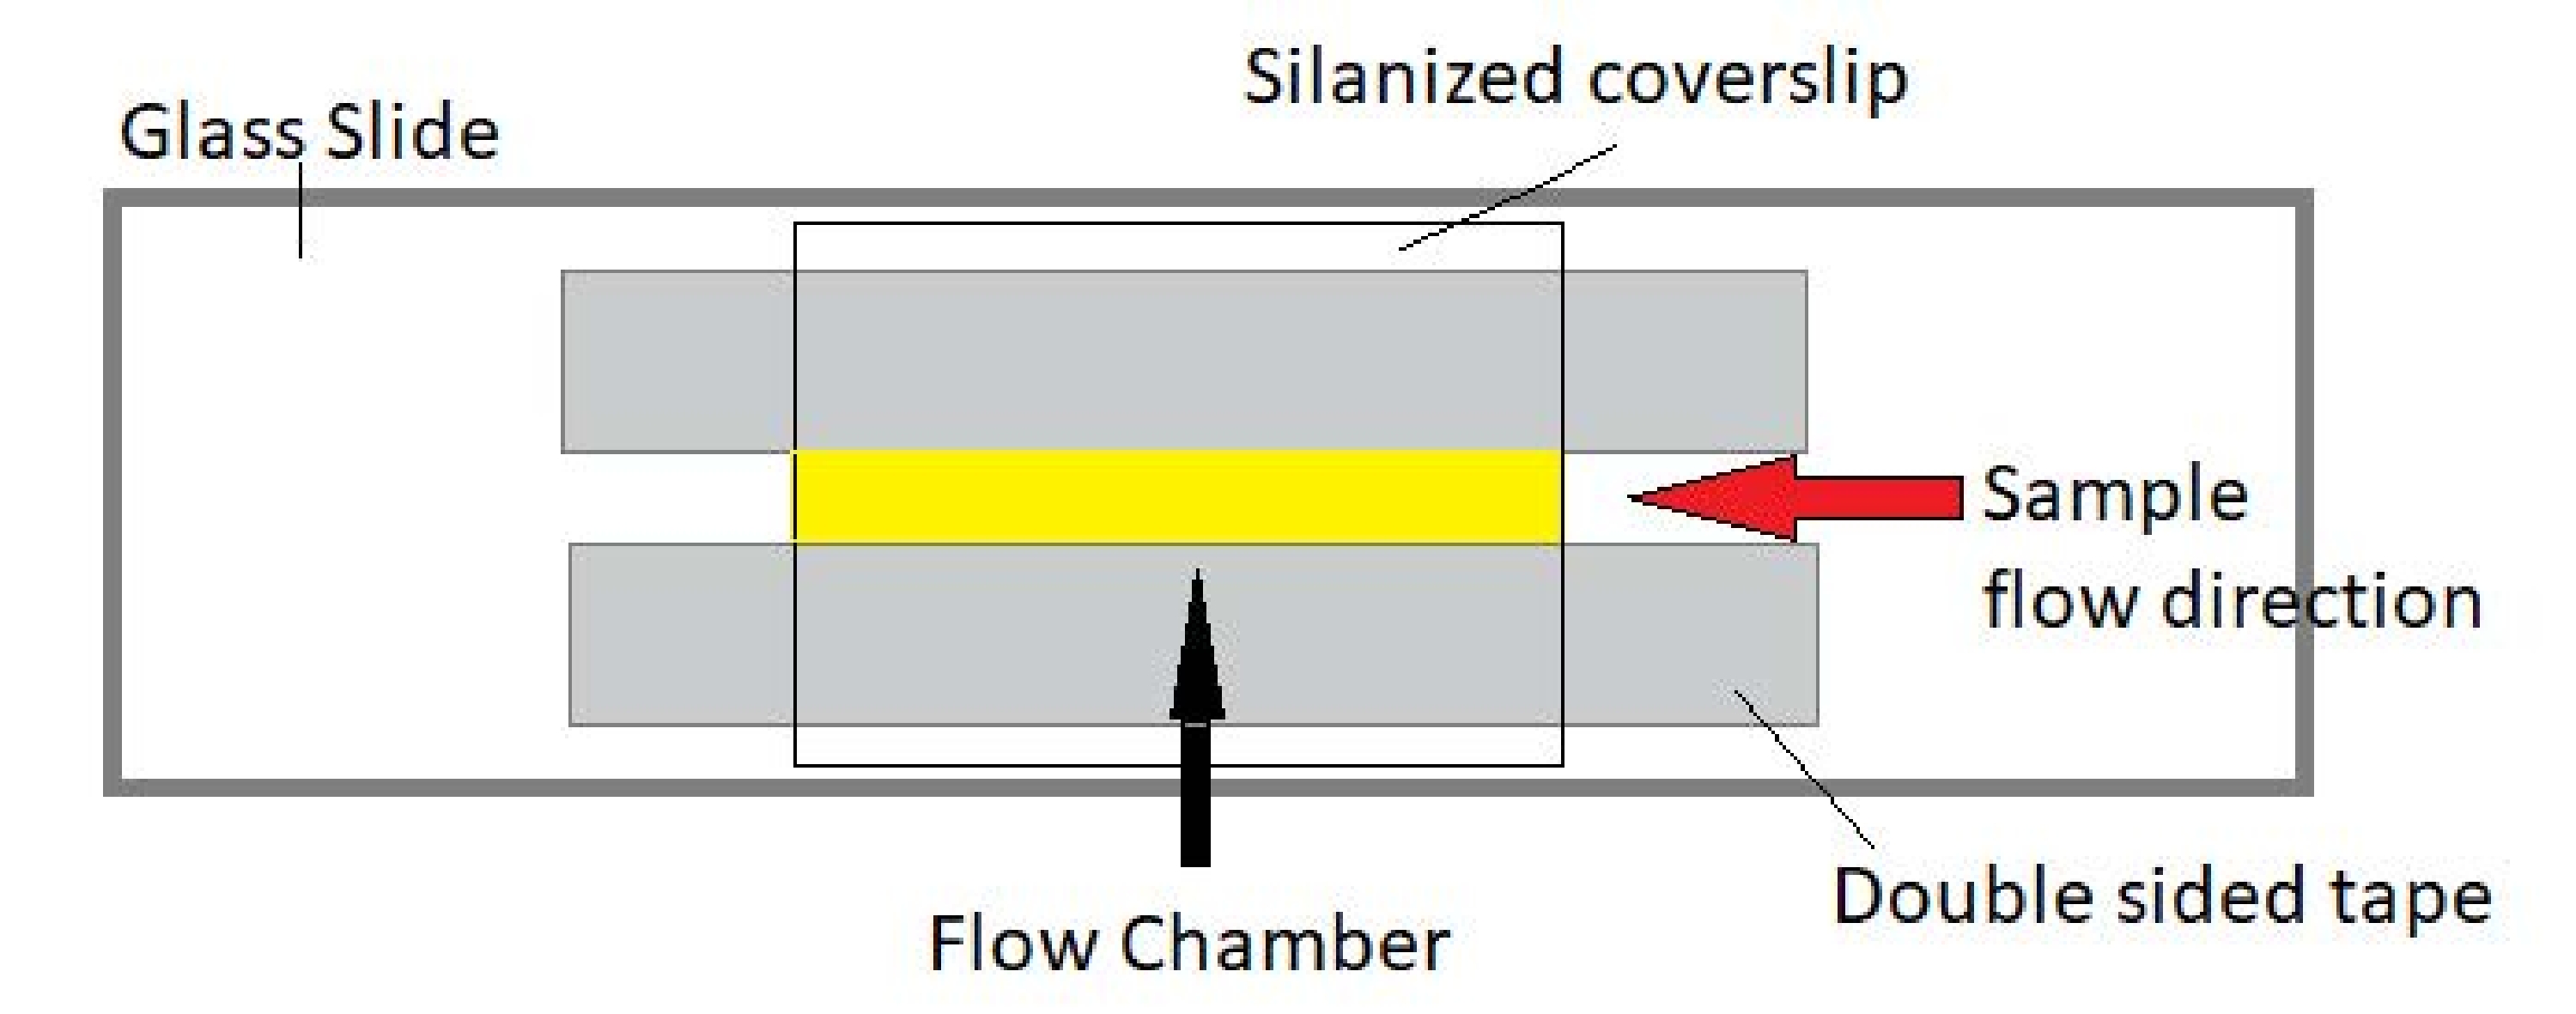
NOTE: Experiments are performed in flow chambers made from a glass slide and silanized cover glass (Figure 3).
- Take a glass slide and clean it using ddH2O, ethanol, and ddH2O in order. Dry with a lint-free laboratory wipe between each rinse.
- Use a piece of double-sided tape to create a flow path. Using gloved hands, cut the tape to ~25-30 mm in length. Split the tape lengthwise to create two thinner strips. Place the two tape strips onto the slide with about 5-8 mm between them.
NOTE: As the thickness of the tape is standardized to about 80-100 µm, the width of the path between the pieces of tape will determine the volume in the chamber. - Place the silanized coverslips on top of the flow path. Seal the slide and coverslip to the double-sided tape strips by gently pressing on the tape region with the back of a pen. Make sure to get a good seal over the entire area; the tape should turn from translucent to clear when the seal is made well.
- Remove the extra tape on the edges, leaving only 1 mm from the flow chamber entrance by cutting the tape with a razor blade.
- Label the chamber with information on the experimental parameters, as needed.
5. Tactoid experiments
NOTE : Once all the reagents and supplies are generated, they can be used to nucleate and polymerize microtubule tactoids in the flow chamber.
- Collect all the reagents to be used. Thaw them on ice and store them on ice while working. Make several flow chambers for the experiments.
- Use one flow chamber for each experiment. Coat the flow chamber surfaces with a polymer brush by flowing in 20 µL of 5% non-ionic block co-polymer surfactant (Table of Materials) dissolved in PEM-80, with small drops at both ends of the chamber to prevent the formation of air bubbles inside. Keep this in a humid chamber (i.e., Petri dish with a wet lint-free laboratory wipe) until ready to use (at least 5-7 min).
- In a sterile tube, mix the following to create the Tubulin-MAP mix: 9.5 µL of PEM-80; 4 µL of 10 mM GMPCPP; 4 µL of 5% Pluronic-F127; 1 µL of 1M DTT; 1 µL of glucose; 2 µL of polyethylene glycol (PEG); 12 µL of 5 mg/mL tubulin mix (13.6 µM final concentration) from Step 2.5.; and 5.5 µL of working stock of MAP65 where 10% is GFP-MAP65 for visualization. Keep on ice while mixing.
NOTE: It is recommended to use a positive displacement pipette for handling the viscous PEG solution. Regular pipettes can be used after cutting the tip to make the opening larger; however, this method is less accurate. - Mix 5x-6x by pipetting.
- Just before adding to the chamber, add 1 µL of a pre-mixed solution of glucose oxidase (0.5 mg/mL) and catalase (0.15 mg/mL) (Deoxy) into the Tubulin-MAP mix and mix 7x-8x. Divide the total volume of the solution (40 µL) into two portions to be used in separate chambers.
- Flow the Tubulin-MAP mix into chambers. As the chambers already have non-ionic block co-polymer surfactant in them, more liquid cannot be added without removing the old liquid. To do this, use a piece of filter paper or a lint-free laboratory wipe at the other end of the chamber to remove liquid via capillary action.
- Once the sample is fully inside the chamber, seal the two ends of the chamber using 5-min epoxy and keep it at 37 °C for ~30 min to nucleate and grow microtubule tactoids.
6. Fluorescence microscopy
- Use a fluorescence microscope for imaging the tactoids.
NOTE: Total internal reflection fluorescence microscopy or spinning disc confocal microscopy are good to remove background fluorescence from free tubulin, but tactoids are also visible by regular epi-fluorescence and even transmitted light microscopy once they are formed, making this procedure accessible without specialized equipment. - Use a numerical aperture (NA) objective of 1.2 NA or higher with a magnification of 60x or higher to collect enough light in fluorescence. These objectives often require immersion in either ddH2O or oil.
- Record images with CMOS or CCD camera. Use an effective pixel size on the camera of 108 nm.
NOTE: The pixel size depends on the camera and the magnification used, which in this case was 60x or 100x with a high numerical aperture (1.2 or 1.49 NA). Additional image expanders can be used before the camera to achieve the needed pixel size. - Keep the sample at 37 °C using an environmental chamber set to this temperature. Alternatively, employ other stage heaters including hot-air stage heaters and objective temperature-controlled collars with circulating warm water.
- Use excitation sources that are correct for the fluorescence needed. For rhodamine tubulin, use a 561 nm laser with at least 1 mW of power at the sample, and for GFP-MAP65, use a 488 nm laser with at least 1 mW of power at the sample.
NOTE: If using wide-field epi-fluorescence microscopy, use a rhodamine filter cube with excitation: 540 ± 12.5 nm, dichroic: 545 nm ± 12.5 nm cut-off, and emission: 575 nm long pass, and a GFP filter cube with excitation: 480 ± 15 nm, dichroic: 505 nm ± 15 nm cut-off, and emission: 515 nm long pass. - Take at least 10 images of different areas to image over 100 tactoids. Take images in both the red and green channels and save them as 16-bit tiff images for analysis. Make sure that the illumination power and the exposure times are such that the intensity scale for the camera is not saturated.
7. Fluorescence recovery after photobleaching (FRAP)
NOTE: To study the mobility of the internal constituents of the tactoids, FRAP was used. FRAP works by photobleaching a selected part of rhodamine-labeled tubulin and GFP-labeled MAP65 tactoid and then observing the recovery of the fluorescence with time in that region. The rate of recovery depends on the turnover of the species being photobleached. This turnover rate can depend on diffusion and binding reactions. For MAP65 binding to the tactoids, binding exchange rates can be estimated. FRAP is performed using an additional 405 nm laser system that can scan the laser in any shape. There are many possibilities for performing FRAP, including using the transmitted lamp and aperture to photobleach a local area14.
- Select an isolated tactoid in the chamber to create a region of interest (ROI) covering parts of the tactoids and the surrounding solution.
- Use a microscope with an additional 405 nm laser for FRAP to photobleach both the tubulin and MAP65 simultaneously. Alternatively, a bright lamp can be used through the field stop of the iris14. Adjust the specific intensity of the photobleaching systems empirically to avoid damaging the proteins during bleaching.
- Record the tactoid as a time series movie for 30-60 s before photobleaching to get information on the intensity prior to the bleach. Record both the red and green channels.
- Photobleach the tactoid by exposing the ROI with either the lasers or the lamp for as long as needed to photobleach without damaging the tactoid. Determine the intensity and time empirically.
- Continue to record the movie in both color channels for 5-10 min post photobleaching or until the recovery seems to have reached equilibrium.
- Visually inspect the GFP-MAP65 channel for recovery.
8. Data analysis
NOTE: Quantitative analysis of the images of tactoids was performed to learn about the effects of environmental changes imposed via different crowding agents, ionic conditions, and the addition of other factors.
- Tactoid shape characterization
- Quantify the length and width of the tactoids from the red and green images taken with confocal microscopy.
- Open the images using FIJI/ImageJ.
- If raw data is taken in 16-bit, adjust the brightness and contrast if necessary. Select Image > Adjust > Brightness and Contrast to adjust the image to be able to see the tactoid clearly. Adjust the brightness and contrast without applying the setting so as not to accidentally alter the intensity data.
- Once the tactoids are clearly visible, select good tactoids to measure (Figure 4Bi). Ensure that the tactoids are clearly visible with no overlap with any other tactoid or aggregates and are not curved or bent to be able to use straight-line measurement tools.
- Next, check that the correct pixel size is set for the images. The microscope images come with metadata about the pixel size. When using a different camera that does not have metadata or external image expansion systems that can change the expected effective pixel size, adjust the pixel size manually. In FIJI/ImageJ, go to the Analyze > Set Scale to set the correct pixel conversion.
- Using the Straight Line tool from the toolbar in FIJI/ImageJ, click on one end of the tactoid and drag the cursor to the other end of the tactoid (Figure 4Bii). Once the line ROI is selected, select Analyze > Measure to measure the length. If the length is not measured by default, make sure to set the measurement to include length in the Analyze > Set Measurements dialog box.
NOTE: Typically, when measuring using the Straight Line tool, it will give the length and angle of the line drawn. As an example, Figure 4Bii shows a straight line drawn to the side of the tactoid to make the latter visible but make the measurement directly on the tactoid. - After making the measurement, use the Text tool in the toolbar to label the tactoid. Create a text box, add a number label, and select Edit > Draw to fix the label into the image. Save the image as a separate ROI file.
NOTE: Labeling and saving this file allows the investigator to know which measurement corresponds to which tactoid from the raw data. Make sure to measure each tactoid once. - After the tactoids for the entire image are measured, save the data in the Results window to a comma- or tab-delimited text file (using File > Save As) and open the data in a spreadsheet program to parse the data into numbers. Collect all the data together (raw image data, ROI image, and text file of results) into a folder with an appropriate naming convention to keep everything organized.
NOTE: Although tactoid length measurements are performed by hand, given that the tactoid widths are narrow, it is better to employ a different method for measuring tactoid width (see below) to reduce measurement error. - Using ImageJ/FIJI, draw a line region using the Straight Line tool. Draw the line as a perpendicular bisector to the tactoid long axis (Figure 4Bii).
- Select Analyze > Plot Profile to create the intensity profile of the linear bisector (Figure 4Biii). A plot will appear. To retrieve and save the data from the plot, select the List button on the lower left; this generates the text file list of the intensity data along the length of the line drawn. Save the text file as a .csv or .txt file.
- Open the text file in a fitting program such as MatLab, Python (sciPy), or other programs. Fit the intensity data with a Gaussian function of the form:
 , where I(x) is the grayscale value along the length, x; B is the background level; A is the amplitude of the Gaussian; µ is the mean or center of the Gaussian; and σ is the standard deviation of the Gaussian.
 - Report 2σ as the width of the tactoid. Estimate the intensity of the microtubules in the tactoid by calculating the area under the Gaussian (not including the background).
NOTE: If the images are within the linear intensity range of the camera and are taken with the same exposure time and excitation intensity, integrated intensities can be compared to estimate the relative number of microtubules in the tactoid.
- FRAP analysis
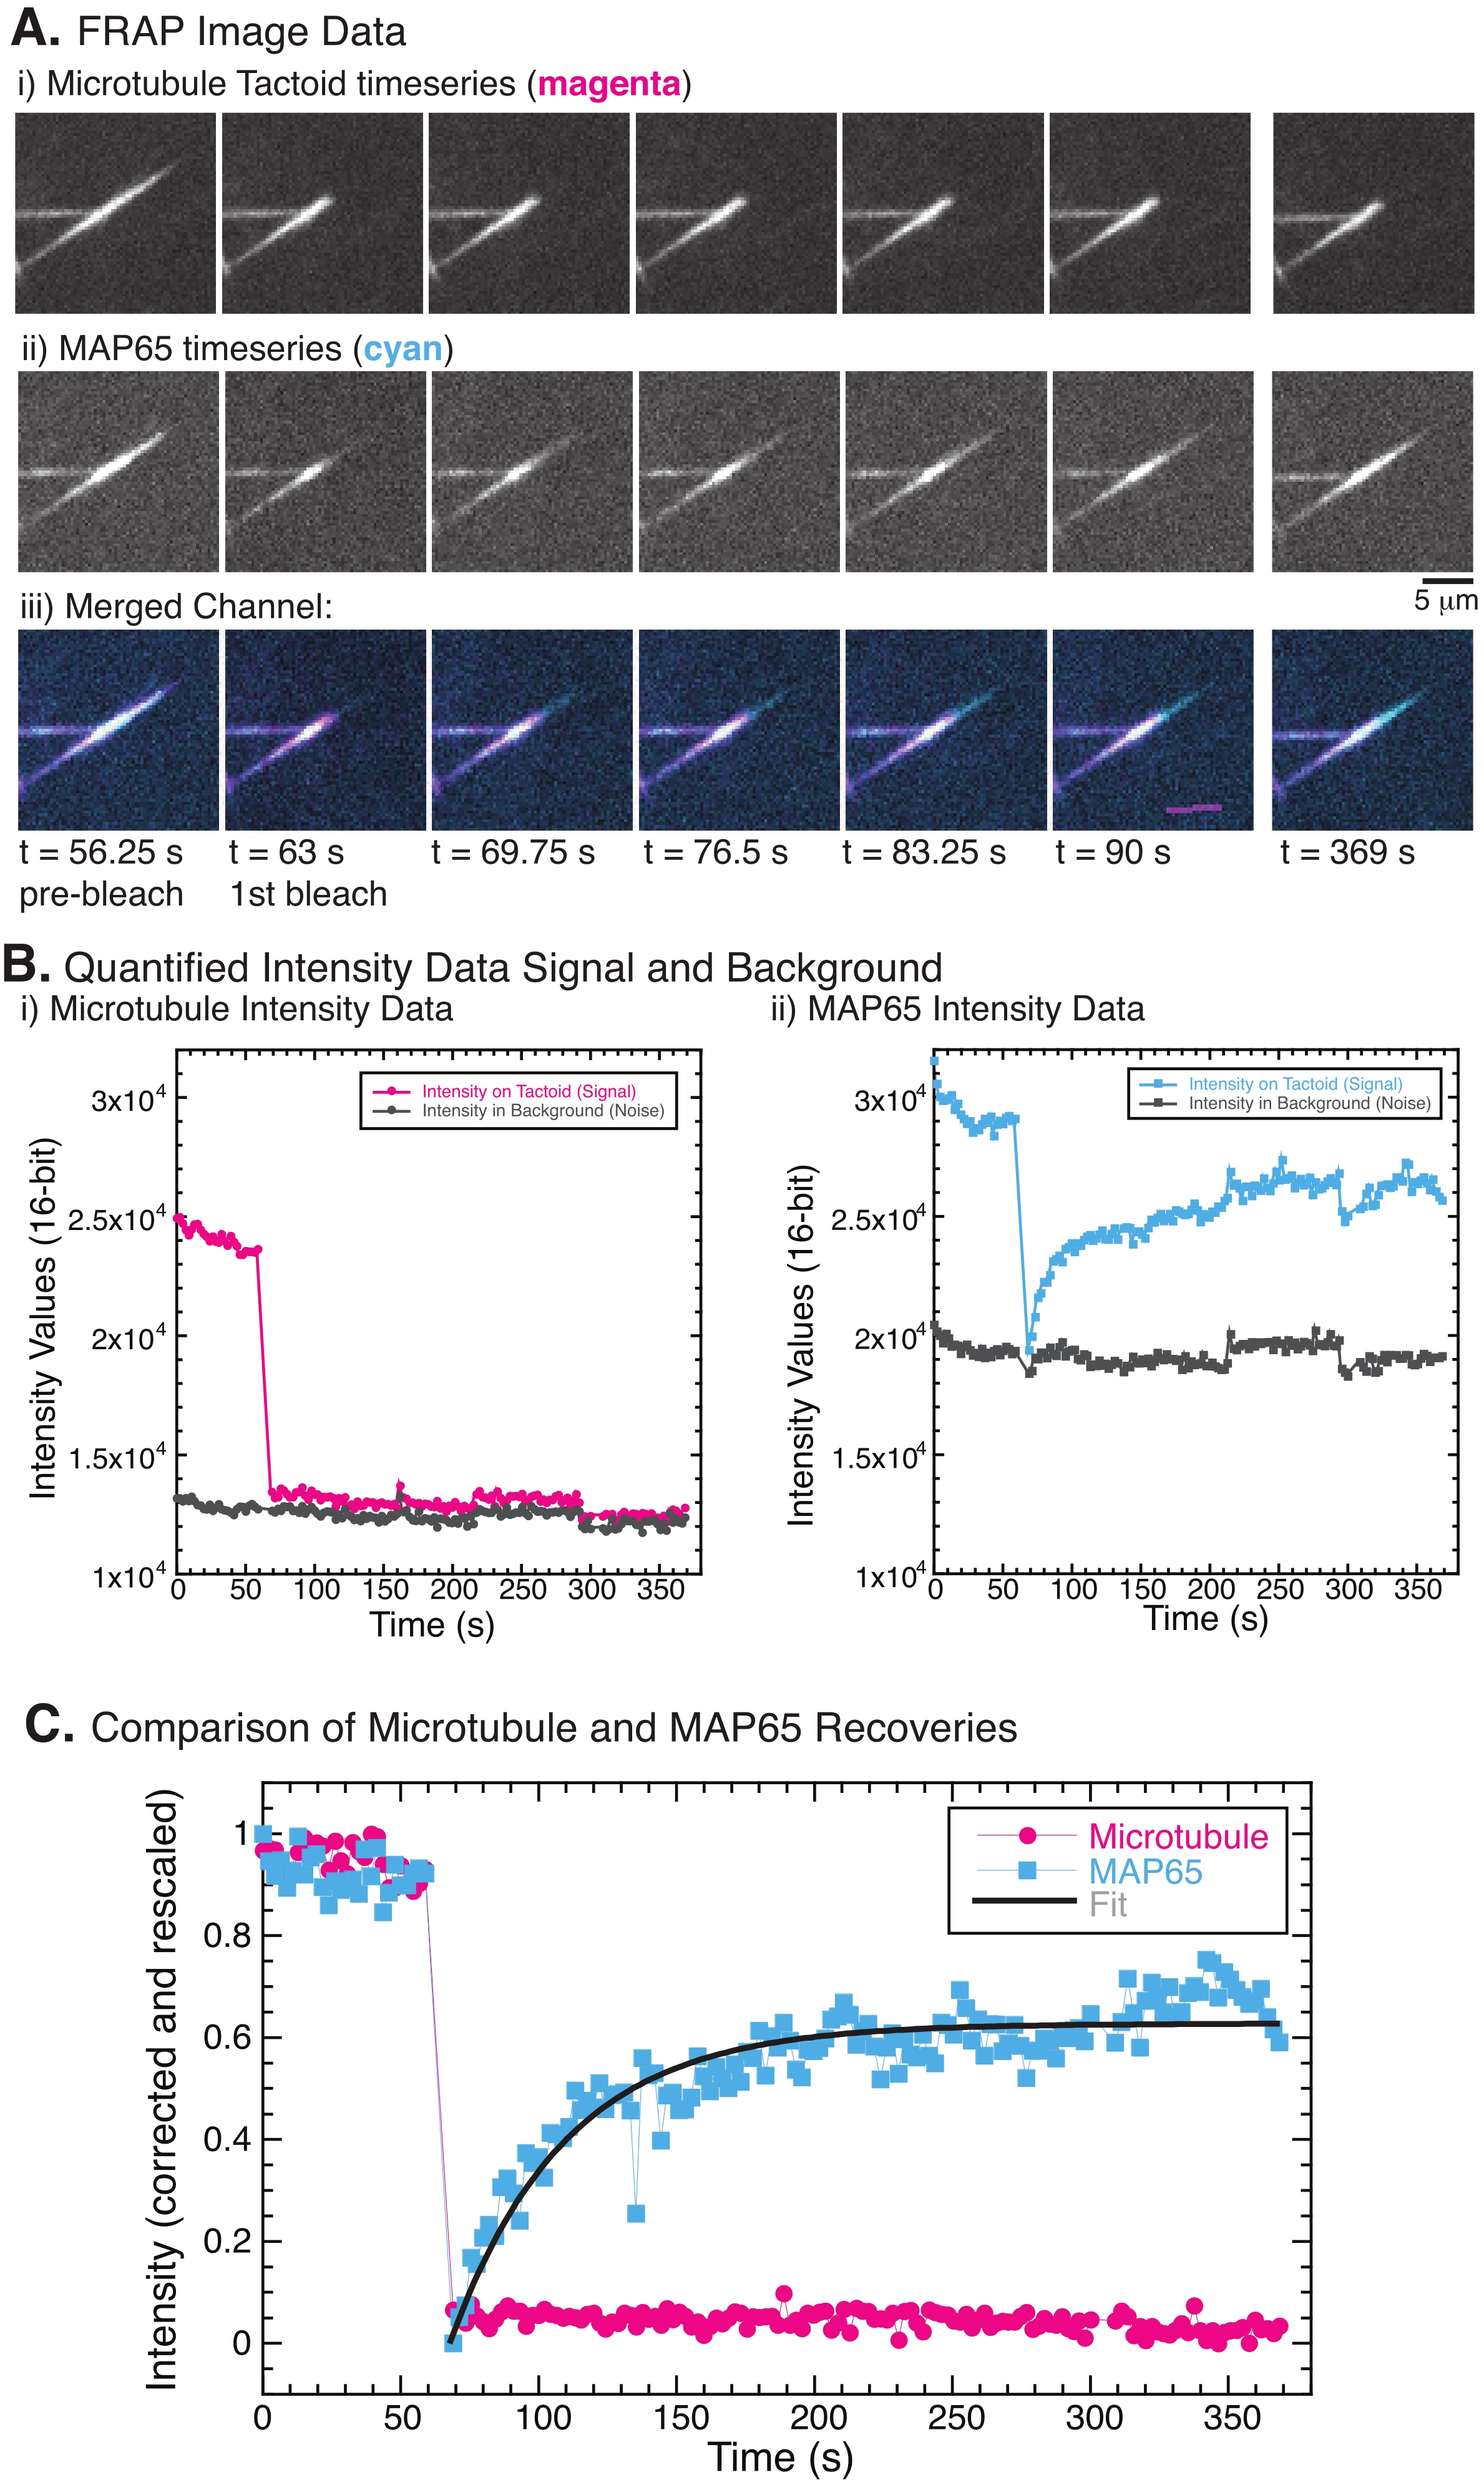
NOTE: Experiments to test the mobility of the microtubules and the MAP65 used FRAP to record the specific photobleaching and recovery of intensity due to molecular motion (Figure 5A). The data were quantified from the image time series data using ImageJ/FIJI.- Use ImageJ/FIJI to open the movie data.
- Register the stacks (time series data) over time to remove drift. Use the StackReg plugin along with the ancillary TurboReg plugin; for instructions on using the plugins, refer to the weblinks given in the Table of Materials. Select translation to shift the position of the frames and thus register the images.
- Once the images are registered to remove drift, rotate the image so that the tactoid is either vertical or horizontal in the frame by selecting Image > Transform > Rotate. Select the angle to rotate and use Preview to determine if the tactoid is rotated enough. When the preview shows that the tactoid is either vertical or horizontal, select OK to rotate all the images in the movie.
- Use the Rectangle selection tool in the toolbar to create a rectangular section over the photobleached region of the tactoid. Record the integrated intensity of the ROI area for each frame using Image > Stacks > Measure Stack. Set the measurement type to Integrated Density using Analyze > Set Measurements. Save the analyzed intensity data shown in the Results window as a text file in .csv or .txt format by selecting File > Save As.
NOTE: Figure 5B shows an example of the raw 16-bit intensity data measured for the microtubule and GFP-MAP65 channels in the bleach region. - As the overall intensity of the images will fade over time globally due to photobleaching caused by imaging, this global photobleaching must be corrected. To do so, use the same ROI size (Step 8.2.4.), and move it to a region in the background of the image where no microtubules or MAP65 are visible. Measure the integrated intensity of the stack as described in Step 8.2.4. Save the results as a second text file.
NOTE: Figure 5B shows an example of the raw 16-bit intensity data measured for the microtubule and GFP-MAP65 channels in the background region. - To correct the background fading, divide the signal intensity on the tactoid by the background intensity for the same time point. Calculate Icorrected (t) as:
 , where IS (t) (the signal) is the measurement made on the bleached region and IBG (t) (the noise) is the measurement made on the background region (Figure 5C). This calculates the signal-to-noise ratio for each frame and subtracts the noise as well.
 - Then, rescale the data to range between zero and one using
 , where Imin and Imax denote, respectively, the global minimum and maximum of the Icorrected data over the entire time (Figure 5C).
 - Fit this data to a decaying exponential of the form:
 , where A is the amplitude of the recovery and τ is the timescale of the recovery (Figure 5C).
Results
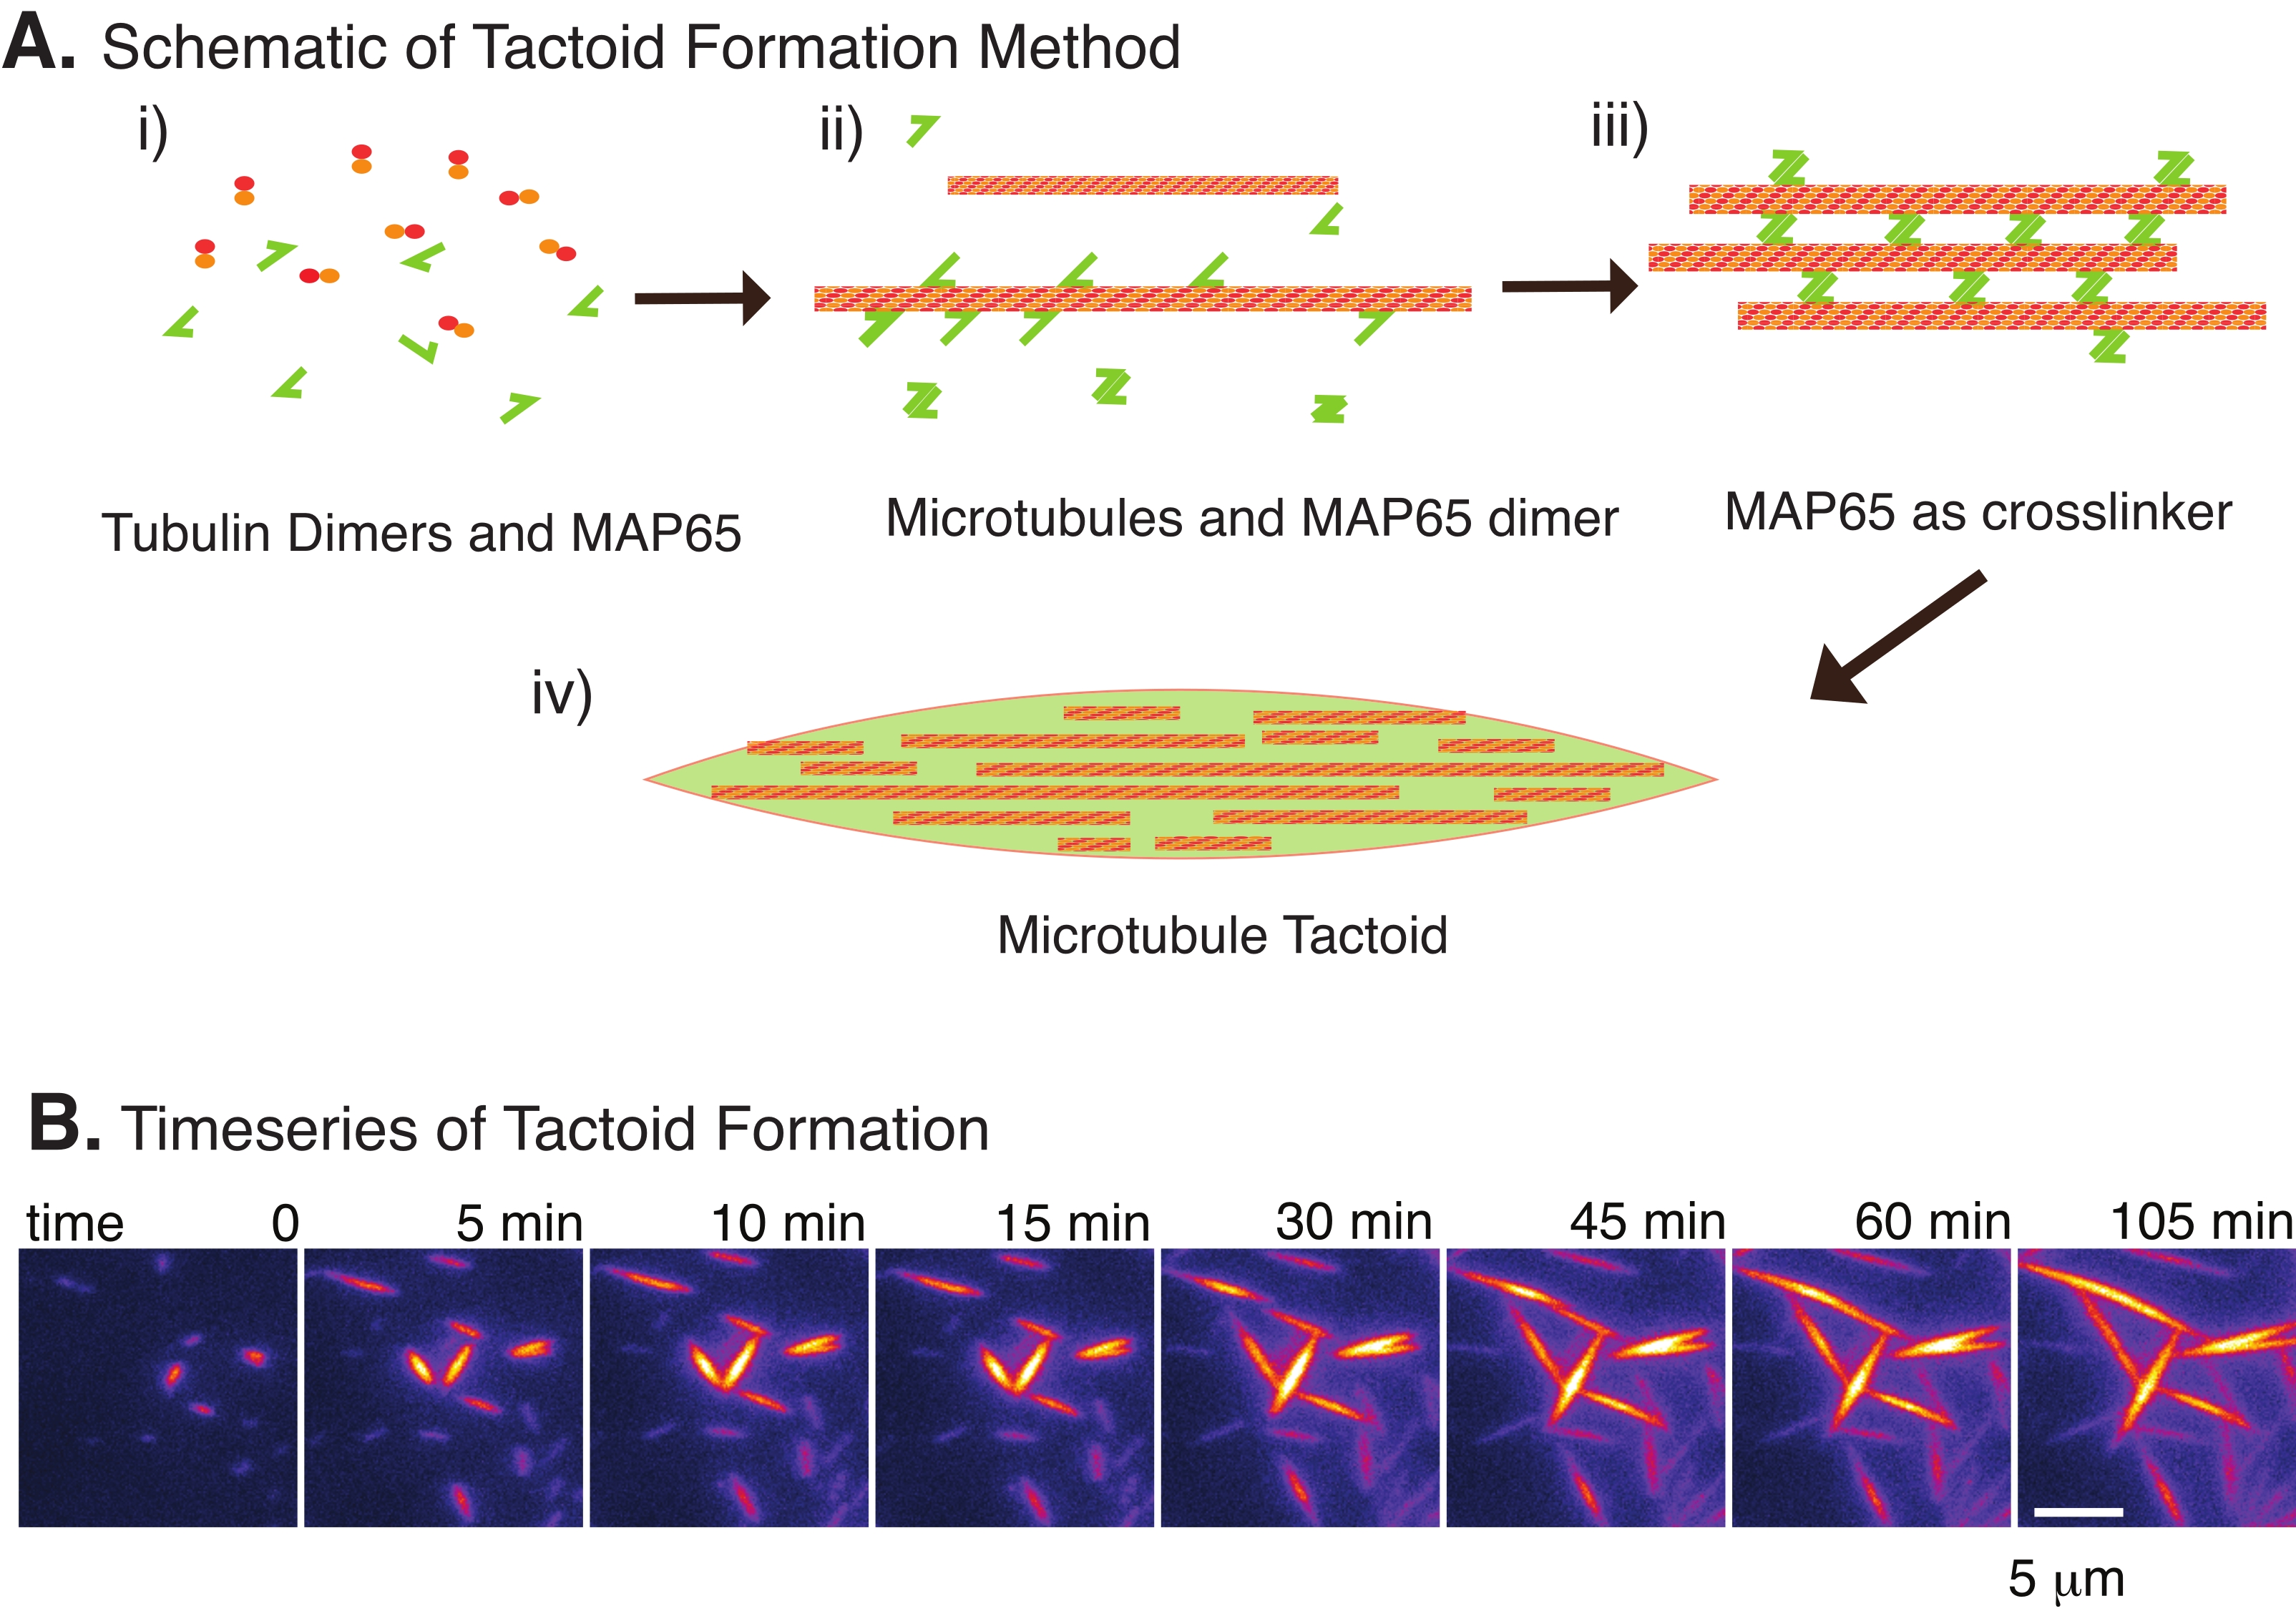
With only a small number of components, tubulin dimers, and microtubule crosslinkers, microtubule tactoids can form (Figure 2A). Although this protocol describes incubation to nucleate and grow microtubules in an incubator, the nucleation and growth can be observed directly under the microscope (which are complete within 30 min) (Figure 2B). The concentration of tubulin is kept constant at 13.6 µm and MAP65-MT binding at 10%.
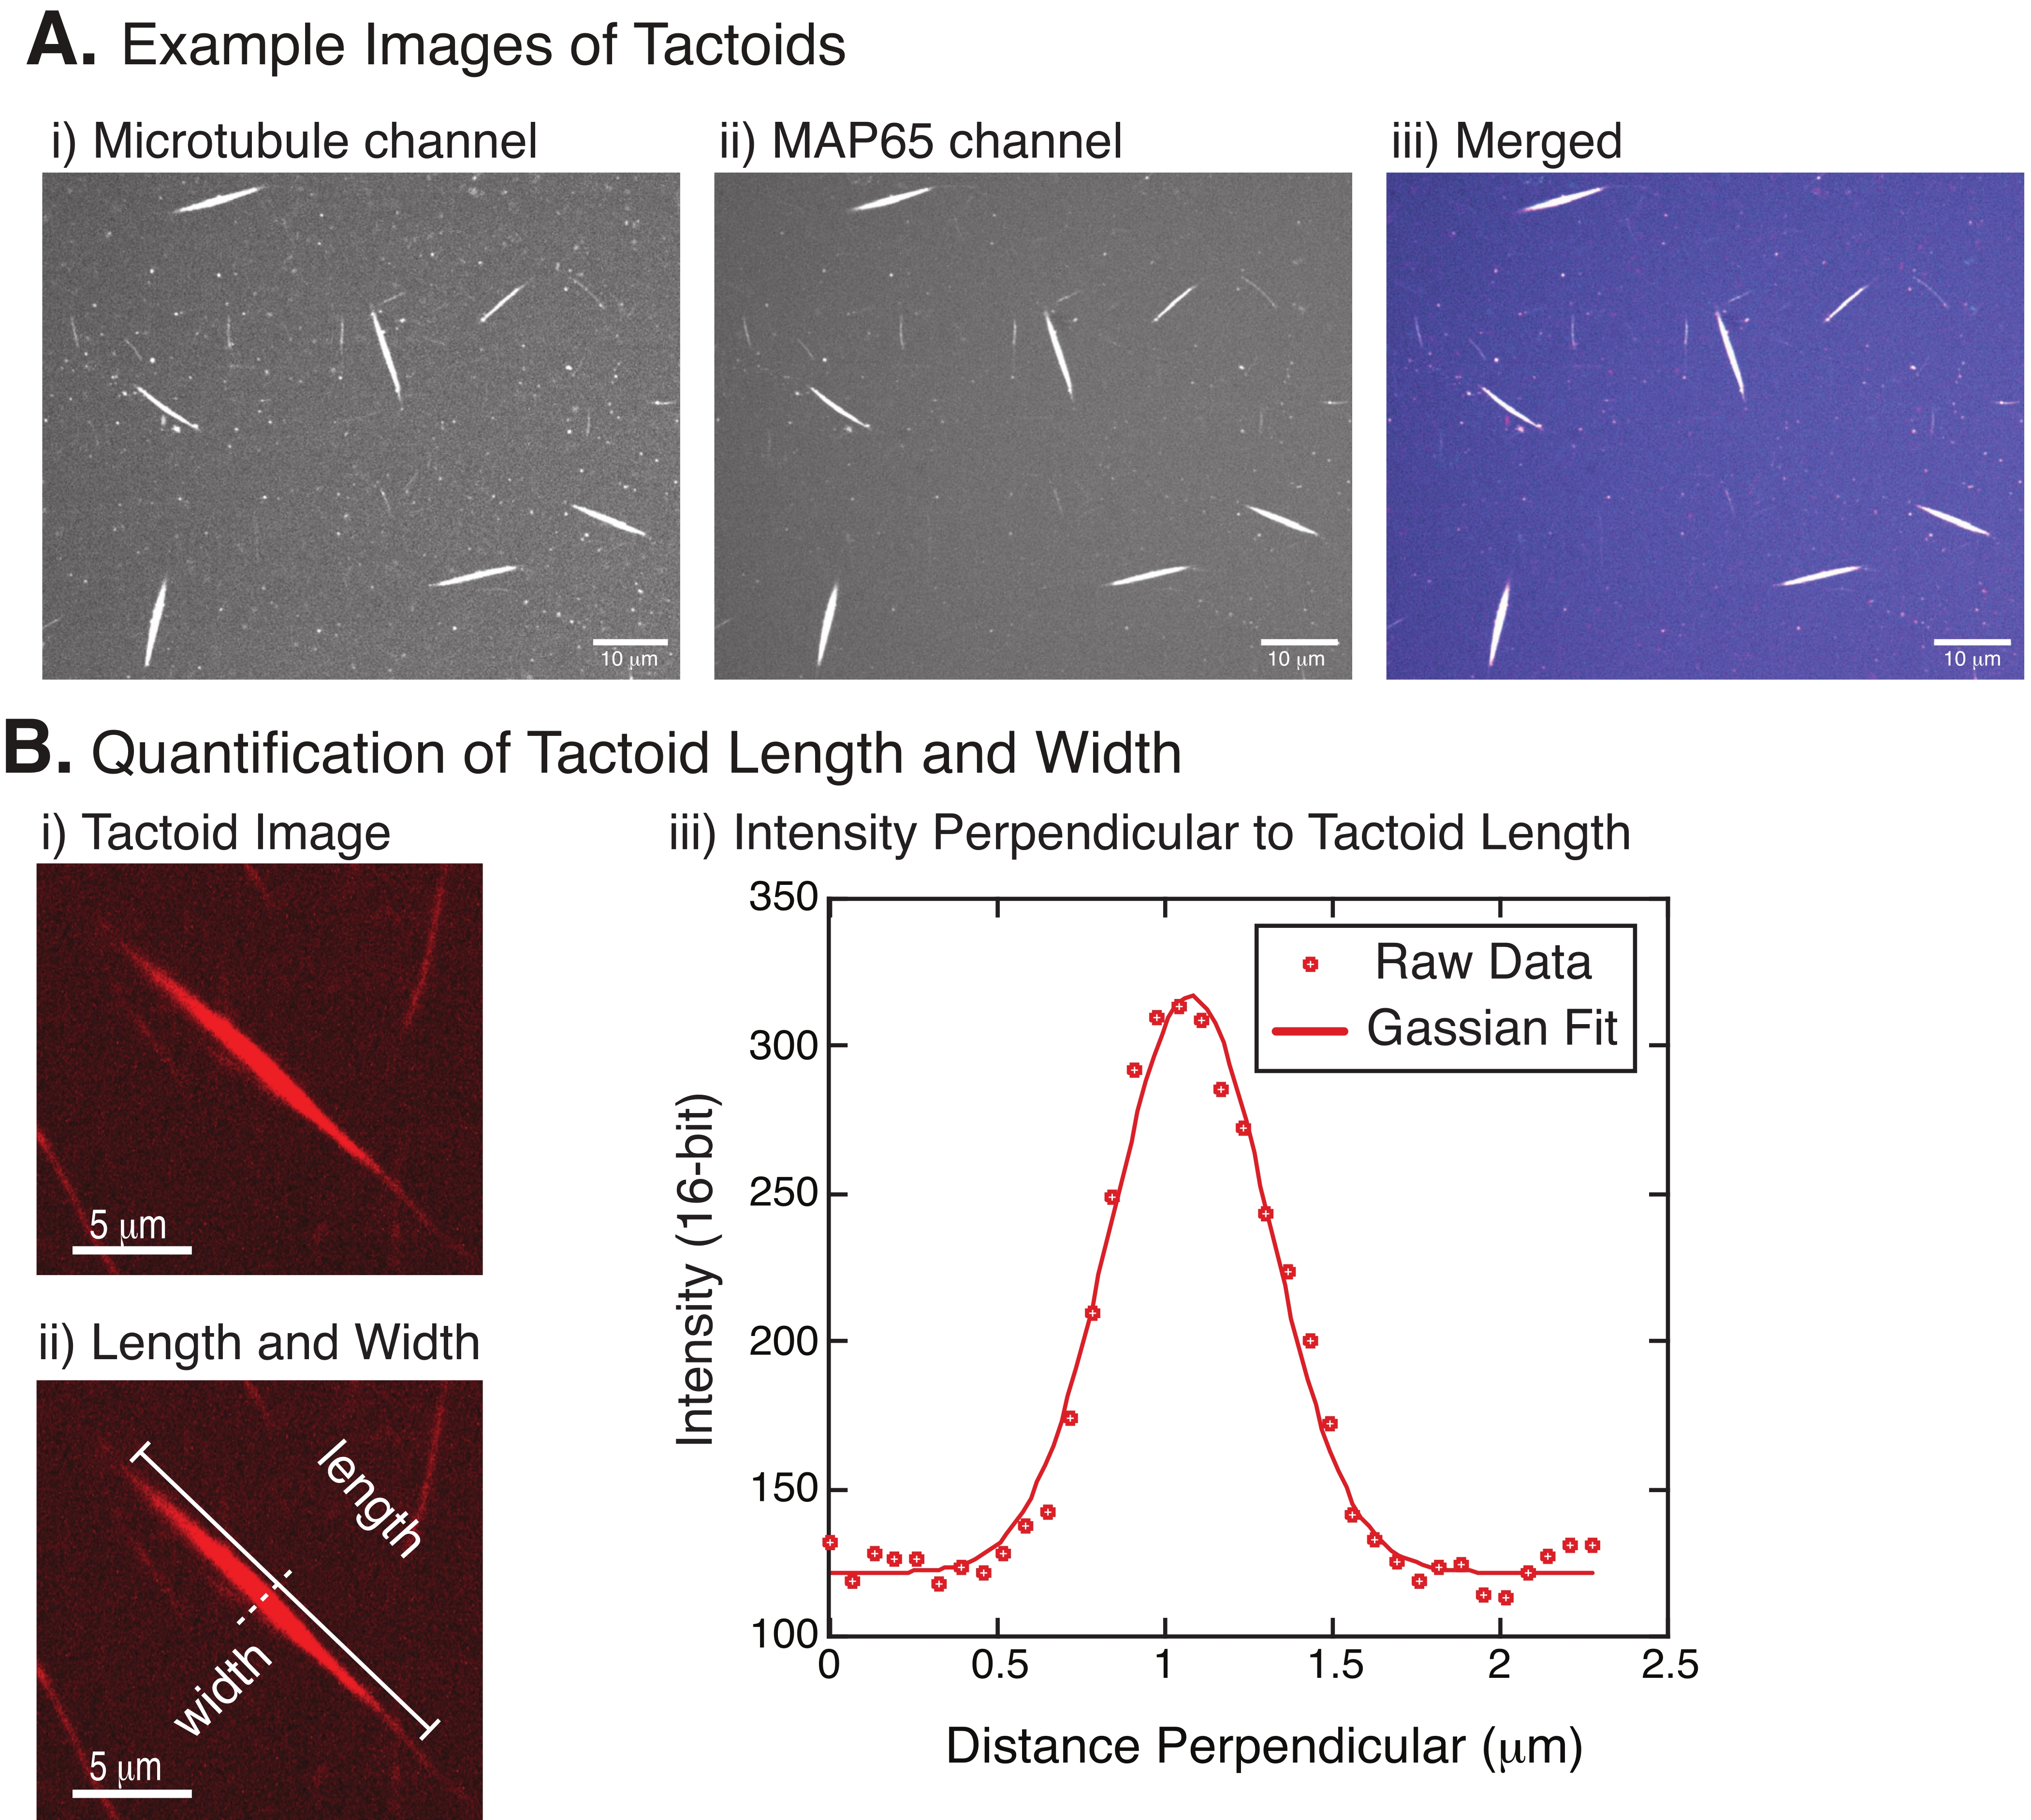
Figure 4 represents successful data. The tactoids should be visible with both a 561 nm laser in the tubulin channel and 488 nm in the MAP65 channel, which perfectly overlap with each other (Figure 4A). One mystery of the system has been that the width of the tactoids does not seem to vary under a variety of experimental changes, including changing the microtubule lengths, the MAP65 concentration, and the crowding agents (Figure 4B)22,28. The length is much more variable and depends on both the microtubule lengths and the MAP65 concentration (Figure 4B)22,28.
When performing FRAP, it has been observed that the MAP65 signal recovers, but the microtubule signal does not recover (Figure 5). The recovery in FRAP is due to the mobility and movement of the labeled and photobleached objects. In the case of the MAP65, the darkened molecules dissociate and move away from the microtubule and new ones move into the region (Figure 5). The MAP65 binding is in equilibrium, so the rate of binding and unbinding is equal (measured in molecules per second). For the microtubules, no recovery was seen implying that the microtubules are not capable of leaving the tactoid (Figure 5A, Bi, C). Further, no spreading of the darkened region was seen, suggesting that the microtubules are locally immobile and not a fluid within the tactoid shape.

Figure 1: Different models of spindle formation. A mitotic spindle is a machine made of microtubules and their associated proteins and enzymes that aligns and separates the chromosomes into the two new daughter cells during cell division. (A) Image of an early Middle Ages drop spindle replica with fine yarn from The Netherlands. This figure has been modified from a Wikimedia image by Peter van der Sluijs30. (B) Three-dimensional reconstruction of microtubules at different stages of wild-type meiosis II. Microtubules are shown in green, and chromosomes are shown in gray. Scale bar = 1 µm. This figure has been modified from Lantzsch et al.31. (C) Microscopy image of the microtubules in a mitotic spindle of a dividing Sf9 cell. The spindle poles and the microtubules of the spindle are labeled with a green fluorescent protein. Scale bar = 5 µm. This figure has been modified from Advani et al.32. (D) Different models of how mitotic and meiotic spindle microtubules are organized. (i) Previously observed for meiotic spindles created from Xenopus egg extracts, the microtubules (green) were deduced to be short and dynamic throughout the spindle. This is similar to a bipolar tactoid organization inside a liquid crystal. (ii) The canonical model for microtubule organization inside a mitotic spindle has two types of microtubules: interpolar or polar microtubules (dark green) that crosslink at the midzone around the chromosomes and kinetochore microtubules (light green) that are bundled and stretched from the pole to the kinetochore to push and pull the chromosomes. In all images, chromosomes are shown in transparent blue, and spindle poles are represented in dark green. (E) Schematics of mesogens (green lines) in a liquid crystal tactoid for (i) bipolar and (ii) homogeneous tactoids. Bipolar tactoids have two poles at the end of the tactoid, and the mesogens re-orient to point to those poles. Homogeneous tactoids have poles at infinity, and the mesogens do not change orientation along the length of the tactoid. Please click here to view a larger version of this figure.

Figure 2: Microtubule condensation. (A) Microtubules can be bundled and crosslinked by a variety of methods including ionic species, depletion forces caused by crowding agents, and specific microtubule crosslinkers, such as MAP65. (i) Tubulin dimers and MAP65 proteins are mixed to nucleate and grow microtubules. (ii) Microtubules nucleate and grow from the tubulin, and MAP65 immediately binds to microtubules, another MAP65 monomer, or both and causes bundling. (iii) Microtubules in the crosslinked bundles nucleate and grow. (iv) The final configuration is a microtubule tactoid similar to a spindle. (B) Time series of microtubule tactoids nucleating and growing over 105 min. Scale bar = 5 µm. Figure adapted from Edozie et al.22. Please click here to view a larger version of this figure.

Figure 3: Flow chamber assembly. The flow chamber is made using a glass slide, silanized cover glass, and permanent double-sided tape. The yellow highlighted region is the flow path where the sample is flowed and observed. The volume of the flow chamber is ~20 µL. Epoxy was used to seal the ends of the chamber to keep the sample from evaporating during long-term imaging over several hours. Please click here to view a larger version of this figure.

Figure 4: Tactoid images and length and width analysis. (A) Example data of tactoids formed as described and imaged using spinning disc confocal showing (i) microtubule channel imaging rhodamine-labeled tubulin using a 561 nm laser, (ii) GFP-MAP65 channel imaging the GFP using a 488 nm laser, and (iii) merged overlay image from the microtubule channel (magenta) and GFP-MAP65 channel (cyan). Overlap regions are displayed as white and demonstrate that the microtubules and MAP65 colocalize exactly. Scale bar = 10 µm for all images in (A). (B) Quantification of tactoid length and width. (i) Image of a tactoid to be analyzed without labels. Scale bar = 5 µm. (ii) Same image as in (i), where the length (solid line with line caps) and width (dashed line) measurements are denoted. Scale bar = 5 µm. (iii) The width was measured by taking the intensity profile across the tactoid at the perpendicular bisector (dashed line) denoted in (ii). The intensity profile was fit to a Gaussian function to reveal the amplitude and width of the tactoid. Please click here to view a larger version of this figure.

Figure 5: Representative FRAP data and analysis. (A) Microscopy time series data of (i) microtubule tactoid and (ii) GFP-MAP65, and (iii) overlay image of both channels with microtubules in magenta and GFP-MAP65 in cyan that were photobleached at time 63 s and observed for an additional 5 min. (B) Quantified intensity of the (i) microtubule channel in the bleached region (magenta circles) and the background (dark grey circles) and (ii) GFP-MAP65 channel in the bleached region (cyan squares) and the background (dark grey squares). (C) The data were corrected for the background noise and rescaled for the microtubule channel (magenta circles) and the GFP-MAP65 channel (cyan squares). The microtubules do not recover, but the GFP-MAP65 does and can be fit (dark grey line) to a rising exponential decay to find the amplitude and the timescale of recovery. Please click here to view a larger version of this figure.
Discussion
The methods described here have been used in several papers to create microtubule tactoids (Figure 2)22,28. These experiments are biologically relevant to help uncover the organizational principles that control the shape and stability of the mitotic or meiotic spindle in most cell types. In addition, microtubules are model liquid crystal mesogens that can help in learning more about how liquid crystals nucleate and grow nematic phases from isotropic phases.
The procedure outlined here has several advantages for exploring microtubule self-organization. First, it is highly reproducible, having been performed in the lab by many students, including high school students, with little foreknowledge or training before starting in the lab. The tactoids are birefringent22, allowing them to be viewed in transmitted light in addition to fluorescence microscopy, making this method accessible to many labs and this experimental procedure adaptable to educational purposes, in addition to high-end research. Finally, this process opens avenues to continue to understand and probe biological systems in a stripped-down, reductionist approach, allowing one to understand how each additional condition, protein, or additive can alter the self-organization of tactoids and, perhaps, ultimately, the spindle. Targets for better biomimicry include activity, fluidity, and filament polarity sorting.
There can be several factors affecting the experiment giving unexpected results. For example, if the tactoids do not form (Figure 2) but fan-like patterns are observed, the MAP65 is likely not present or not binding to the microtubules22,28. This should be obvious in the MAP65 fluorescence channel as well because the GFP-MAP65 will not be bound to the microtubules.
If the tactoids do not form and the background appears as speckles on the glass, this could be due to the surface coating. Once performed, the silanization lasts only 1 month on coverslips. When it wears off, the tubulin will be able to bind to the exposed surface non-specifically. This binding will occur in odd patterns.
If the tactoids do not form and the tubulin is observed in aggregates of various shapes and sizes, this could be due to poor-quality tubulin. Tubulin can be centrifuged to remove initial aggregates that can drive this off-pathway aggregation instead of microtubule polymerization. If the surface is binding to the tubulin, it can also deplete the tubulin in the solution. Low concentrations of tubulin, below the critical concentration for polymerizing microtubules, can result in aggregates.
In FRAP experiments, if the MAP65 channel does not show any recovery (Figure 5), it is possible that the photobleaching was photodamaging the microtubules. Photodamage causes the localized destruction of the filaments. This can be checked by examination in the transmitted channel. Microtubule tactoids are visible in the transmitted channel through a high index of refraction mismatch with the surrounding water. Light-induced photodamage will appear as a burn mark or loss of contrast in transmitted light imaging at the location of the ROI subjected to photobleaching. If this occurs, the laser or light power must be reduced to inhibit the photodamage of the proteins.
There were several challenges encountered in this procedure and approach. One issue is that the length measures are currently performed by hand by clicking on the image. This method, while straightforward, can result in high uncertainty. The width measurement that uses the cross-section and fitting to a Gaussian is a better method for quantifying the size. A similar method could be employed for the length. A second issue is that, sometimes, the tactoids, because they are so long and thin, can bend. This makes quantifying the length more difficult. The contour length can be quantified using a segmented line, but there is added uncertainty each time a segment is added.
From a scientific perspective, this approach has some other challenges for its use as a model for liquid crystals or spindles. The first challenge has been the long, thin shape of the tactoids that microtubules create (Figure 3 and Figure 4). As noted in prior publications22, microtubule tactoids are homogeneous tactoids, not bipolar. This means that the microtubules that make up the shape do not reorient to point toward the tips of the structure. Instead, all the microtubules are parallel to the long axis and the "poles" are located at infinity. This is very different from the tactoids observed for molecular liquid crystals or even for actin or DNA that can also act as liquid crystal mesogens. In these other systems, the tactoids are bipolar and, when viewed in crossed polarizers, they show the telltale signs of reorientation of the rods.
A second major challenge in this system is that the microtubules are immobile inside the tactoid. This is clear from FRAP experiments and analysis as the recovery of the microtubules is very low. Their solid-like nature makes microtubule tactoids less valuable as large-scale liquid crystal analogs. The nematic phase of a liquid crystal should have both liquid (fluid) and crystal (organized) properties. Although the shape seems right for the spindle, the immobility makes the system less exciting as a model mitotic spindle. On the other hand, this issue provides opportunities to investigate how one can modify the experiments to create more fluidity in the system.
These scientific challenges offer exciting opportunities that will allow new knowledge about the system. To make the microtubule tactoids more bipolar, one could use shorter microtubules. There is an added challenge, however, since microtubules do not have many well-characterized capping proteins to control the length as actin does. The use of nucleation and growth requires the use of very high concentrations of tubulin and GMPCPP to make short microtubules. The high tubulin concentration results in a larger number of filaments in the system, which makes it more difficult to separate tactoids from one another. The addition of new microtubule cappers, such as DARPin33, may help with this situation. The second issue of the microtubules being immobile could be mitigated by the addition of motor proteins, such as kinesin-534, which are tetramers of motors used in mitosis. Alternatively, artificial dimers of dimeric kinesin-1 could be used15.
Another way to add more fluidity would be to allow the microtubules to perform their dynamic instability, the growing and shrinking of microtubules. Currently, microtubules that are seeded with stable GMPCPP filaments and then undergo dynamic instability are far longer than desired to form a spindle or tactoid, which would result in very long organizations like fans or bundles. So, adding microtubule dynamic instability would need to be done carefully to preserve the tactoid shape. The addition of associated proteins and enzymes that can control the length may mitigate this issue. For instance, depolymerizing kinesins, such as kinesin-1335, or severing enzymes, like katanin36, would likely be needed. These experiments are complex and difficult, although they would be very insightful no matter what the results reveal. Whichever direction future experiments take, the platform developed here for creating microtubule tactoids can expose new information on the physical basis of microtubule organization.
Disclosures
The authors declare that they have no competing financial interests.
Acknowledgements
The authors would like to thank all the summer 2021 Ross Lab members, especially K. Alice Lindsay, for their help. This work was supported by a grant from NSF BIO-2134215 that supported S. Sahu, N. Goodbee, H.B. Lee, and J.L. Ross. A grant from the KECK Foundation (Rae Anderson, USD, lead PI) partially supported R. Branch and P. Chauhan
Materials
| Name | Company | Catalog Number | Comments |
| 2% Dichlorodimethylsilane | GE Healthcare | 118945 | A hydrophobic silane surface treatment. This can be resused upto three times and kept at room temperature for one year. |
| 5-minute epoxy | Bob Smith Industries | For sealing experimental chambers | |
| Acetone | Fisher | 32900HPLC | 100% |
| BL21 cells | Bio Labs | C2527I | Competent bacterial cells used to express MAP65 |
| Catalase | Sigma | C30-500MG | Part of the oxygen scavenging system. A 300 mg/ml stock is made in ddH2O and stored in 10 μl aliquots in -20°C for upto one year. |
| Coverslips (22 mm x 22 mm or 22 mm x 30 mm) | Fisher | 12544-AP | For experimental chambers |
| Dithiothreitol | Sigma | 43815-5G | A small molecule that is used to break disulfide bonds and scavenge oxygen. A 1 M stock is made from powder (Sigma) in ddH2O. The solution is aliquoted and stored at -20C for upto one year. The aliquots are used 7-8 times then discarded. |
| EGTA | Sigma | E3889-10G | Tubulin buffer base ingredient |
| Eppendorf 0.5 ml tubes | Eppendorf | 05 402 18 | For holding experimental solutions |
| Ethanol | Fisher | 111000200 | 200 proof |
| Filter paper | Whatman | 1004-110 | For cleaning and for pulling solutions through experimental chambers |
| Fluorescence microscope with high NA objectives | Nikon | Ti-E, W2 Confocal | For imaging experiments |
| Freezer -20°C | Fisherbrand | 13986148 | For storing reagents |
| Freezer -80°C | Thermo scientific | 328223H01-C | For storing proteins. |
| Glass containers for silanization | Michaels | For preparing experimental chambers - treating cover glasses | |
| Glass slides | Fisher | 12544-4 | For experimental chambers |
| Glucose | Sigma | G7528-250G | Part of the oxygen scavenging system. A 300 mg/ml stock is made in ddH2O and stored in 10 μl aliquots in -20°C. |
| Glucose oxidase | Sigma | G2133-250KU | Part of the oxygen scavenging system. This is stored at 4°C for upto one year. |
| GMPCPP | Jenna Bioscience | NU-4055 | Slowly hydrolyzable analog of GTP used to polymerize and stabilize the microtubules by reducing the dynamic instability and spontaneous critical concentration for microtubule nucleation to get a consistent length. We purchase a 10 mM stock from Jena Biosciences and store it at -20°C for upto one year. |
| Heating element for microscope | Okolab stage top incubator | For imaging experiments | |
| Imidizole | Sigma | I2399 | Used to elute MAP65 protein from Nickel beads to purify MAP65 |
| Kimwipes | Fisher | 34155 | For cleaning and for pulling solutions through experimental chambers. |
| KOH | Sigma | P250-500 | 1 M in ddH2O, made fresh to prevent acidification over time. |
| Liquid Nitrogen | Airgas | NI 230LT22 | To drop freeze aliquots. This can also be used for storage (not recommended) |
| MAP65 protein | Ram Dixit | A microtubule-associated protein (MAP) with a molecular weight of 65 kD that is an antiparallel microtubule crosslinker. We have purified an unlabeled and GFP-labeled version of MAP65-1 from Arabidopsis thaliana. We mix the GFP-MAP65 with the unlabeled MAP65 such that 10% of the protein is labeled. The working stock is a 10.8 μM solution. This working solution is stored at 4°C and remade fresh every week. The protocol for purifying the MAP65 and GFP-MAP65 is given in our prior methods chapter (26). | |
| MgSO4 | Sigma | MKCJ940 | Tubulin buffer ingredient |
| NTA-Nickel beads | Qiagen | 30210 | Beads required to purify 6xHis tagged MAP65 proteins |
| Optomicroscan | Nikon | 405 nm laser system which can focus the laser in any desired shape of region of interest | |
| PEM80 | Neutral tubulin polymerizing base buffer for solution made from 80 mM K-PIPES, pH 6.8, 1 mM MgSO4, 1 mM EGTA, stored at 4°C for upto one year. | ||
| Permanent double-sided tape | 3M - Scotch | 34-8724-5691-7 | For experimental chambers |
| Petri dish | Fisher | FB0875713 | For humid chamber |
| PIPES | Sigma | P7643-100G | Tubulin buffer base ingredient |
| Pluronic-F127 | Sigma | P2443-250G | A block-copolymer with two hydrophilic polyethylene oxide (PEO) blocks on the ends and a hydrophobic center block of polyphenylene oxide (PPO) hydrophobic surface coating we use to prevent protein binding to the surface. Pluronic-F127 is purchased as a powder (Sigma) and dissolved to a 5% (w/v) solution in ddH2O overnight. Once dissolved, the solution can be stored at room temperature for upto one year. |
| Polyethylene Glycol | Affymetrix Inc | 19966 500 GM | A crowding agent used to create depletion forces to bring tactoids to the surface and help to organize microtubules. We create a 5% (w/v) solution of 100 kDa PEG in PEM80. The solution is stored in 4°C for upto one year and placed on the rocker before use. It is viscous, so we recommend using a positive displacement pipette to work with it. |
| Positive displacement pipette | Eppendorf | For pipetting viscous liquids | |
| Racks for coverslips | Electron Microscopy Sciences | 72240 | For preparing experimental chambers - treating cover glasses |
| Refrigerator 4°C | Fisherbrand | For storing reagents | |
| Tubulin Labeled | Cytoskeleton | TL590M | lyophilized rhodamine-labeled tubulin from pig brain is purchased (Cytoskeleton) and stored in -80°C until hydrated in PEM80 and used for upto one year. |
| Tubulin protein | Cytoskeleton | T240 | lyophilized tubulin 99% pure unlabeled from pig brain is purchased (Cytoskeleton) and stored in -80°C until hydrated in PEM80 and used for upto one year. |
| UV-Ozone | Jelight | Model 342 | For preparing experimental chambers - treating cover glasses |
| Stackreg | Biomedical Imaging Group | http://bigwww.epfl.ch/thevenaz/stackreg/ | plugin for registering time series data to remove drift |
| Turboreg | Biomedical Imaging Group | http://bigwww.epfl.ch/thevenaz/turboreg/ | plugin for registering time series data to remove drift |
References
- Bodakuntla, S., Jijumon, A. S., Villablanca, C., Gonzalez-Billault, C., Janke, C. Microtubule-associated proteins: structuring the cytoskeleton. Trends in Cell Biology. 29 (10), 804-819 (2019).
- Severson, A. F., von Dassow, G., Bowerman, B. Oocyte meiotic spindle assembly and function. Current Topics in Developmental Biology. 116, 65-98 (2016).
- Brugués, J., Needleman, D. Physical basis of spindle self-organization. Proceedings of the National Academy of Sciences of the United States of America. 111 (52), 18496-18500 (2014).
- Brugués, J., Nuzzo, V., Mazur, E., Needleman, D. J. Nucleation and transport organize microtubules in metaphase spindles. Cell. 149 (3), 554-564 (2012).
- Gatlin, J. C., et al. Spindle fusion requires dynein-mediated sliding of oppositely oriented microtubules. Current Biology. 19 (4), 287-296 (2009).
- Goshima, G., Mayer, M., Zhang, N., Stuurman, N., Vale, R. D. Augmin: A protein complex required for centrosome-independent microtubule generation within the spindle. Journal of Cell Biology. 181 (3), 421-429 (2008).
- Inoue, S., Sato, H. Cell motility by labile association of the nature of mitotic spindle fibers and their role in chromosome movement molecules. Journal of General Physiology. 50 (6), 259-292 (1967).
- Allenspach, A. L., Roth, L. E. Structural variations during mitosis in the chick embryo. Journal of Cell Biology. 33 (1), 179-196 (1967).
- Theg, D. E. Cytoplasmic microtubules in different animal cells. Journal of Cell Biology. 23 (2), 265-275 (1964).
- Mcdonald, K., Pickett-Heaps, J. D., Mcintosh, J. R., Tippit, D. H. On the mechanism of anaphase spindle elongation in Diatoma vulgare. Journal of Cell Biology. 9, 377-388 (1977).
- Chaikin, P. M., Lubensky, T. C. . Principles of Condensed Matter Physics. , (1995).
- Hamon, L., Savarin, P., Curmi, P. A., Pastré, D. Rapid assembly and collective behavior of microtubule bundles in the presence of polyamines. Biophysical Journal. 101 (1), 205 (2011).
- Needleman, D. J., et al. Higher-order assembly of microtubules by counterions: From hexagonal bundles to living necklaces. Proceedings of the National Academy of Sciences. 101 (46), 16099-16103 (2004).
- Ross, J. L., Fygenson, D. K. Mobility of taxol in microtubule bundles. Biophysical Journal. 84, 3959-3967 (2003).
- Sanchez, T., Welch, D., Nicastro, D., Dogic, Z. Cilia-like beating of active microtubule bundles. Science. 333 (6041), 456-459 (2011).
- Brandt, R., Lee, G. Functional organization of microtubule-associated protein tau. Identification of regions which affect microtubule growth, nucleation, and bundle formation in vitro. Journal of Biological Chemistry. 268 (5), 3414-3419 (1993).
- Hirokawa, N. Microtubule organization and dynamics dependent on microtubule-associated proteins. Current Opinion in Cell Biology. 6 (1), 74-81 (1994).
- Kanai, Y., et al. Expression of multiple tau isoforms and microtubule bundle formation in fibroblasts transfected with a single tau cDNA. The Journal of Cell Biology. 109 (3), 1173 (1989).
- MacRae, T. H. Microtubule organization by cross-linking and bundling proteins. Biochimica et Biophysica Acta (BBA). Protein Structure and Molecular Enzymology. 1160 (2), 145-155 (1992).
- She, Z. Y., Wei, Y. L., Lin, Y., Li, Y. L., Lu, M. H. Mechanisms of the Ase1/PRC1/MAP65 family in central spindle assembly. Biological Reviews. 94 (6), 2033-2048 (2019).
- Walczak, C. E., Shaw, S. L. A MAP for Bundling Microtubules. Cell. 142 (3), 364-367 (2010).
- Edozie, B., et al. Self-organization of spindle-like microtubule structures. Soft Matter. 15 (24), 4797-4807 (2019).
- Tulin, A., McClerklin, S., Huang, Y., Dixit, R. Single-molecule analysis of the microtubule cross-linking protein MAP65-1 reveals a molecular mechanism for contact-angle-dependent microtubule bundling. Biophysical Journal. 102 (4), 802-809 (2012).
- Chan, J., Jensen, C. G., Jensen, L. C. W., Bush, M., Lloyd, C. W. The 65-kDa carrot microtubule-associated protein forms regularly arranged filamentous cross-bridges between microtubules. Proceedings of the National Academy of Sciences of the United States of America. 96 (26), 14931-14936 (1999).
- Scheff, D. R., et al. Tuning shape and internal structure of protein droplets via biopolymer filaments. Soft Matter. 16 (24), 5659-5668 (2020).
- Weirich, K. L., et al. Liquid behavior of cross-linked actin bundles. Proceedings of the National Academy of Sciences of the United States of America. 114 (9), 2131-2136 (2017).
- Weirich, K. L., Dasbiswas, K., Witten, T. A., Vaikuntanathan, S., Gardel, M. L. Self-organizing motors divide active liquid droplets. Proceedings of the National Academy of Sciences of the United States of America. 166 (23), 11125-11130 (2019).
- Sahu, S., Herbst, L., Quinn, R., Ross, J. L. Crowder and surface effects on self-organization of microtubules. Physical Review E. 103 (6), 062408 (2021).
- Stanhope, K. T., Ross, J. L. Microtubules, MAPs, and motor patterns. Methods in Cell Biology. 128, 23-38 (2015).
- Early Middle Ages drop single.jpg. Wikimedia Commons Available from: https://commons.wikimedia.org/wiki/File:Early_middle_ages_drop_spingle.jpg (2022)
- Lantzsch, I., et al. Microtubule reorganization during female meiosis in c. Elegans. eLife. 10, 58903 (2021).
- Advani, S., Maresca, T. J., Ross, J. L. Creation and testing of a new, local microtubule-disruption tool based on the microtubule-severing enzyme, katanin p60. Cytoskeleton. 75 (12), 531-544 (2018).
- Pecqueur, L., et al. A designed ankyrin repeat protein selected to bind to tubulin caps the microtubule plus end. Proceedings of the National Academy of Sciences of the United States of America. 109 (30), 12011-12016 (2012).
- Valentine, M. T., Fordyce, P. M., Krzysiak, T. C., Gilbert, S. P., Block, S. M. Individual dimers of the mitotic kinesin motor Eg5 step processively and support substantial loads in vitro. Nature Cell Biology. 8 (5), 470-476 (2006).
- Wagenbach, M., Domnitz, S., Wordeman, L., Cooper, J. A kinesin-13 mutant catalytically depolymerizes microtubules in ADP. Journal of Cell Biology. 183 (4), 617-623 (2008).
- McNally, F. J., Vale, R. D. Identification of katanin, an ATPase that severs and disassembles stable microtubules. Cell. 75 (3), 419-429 (1993).
Reprints and Permissions
Request permission to reuse the text or figures of this JoVE article
Request PermissionThis article has been published
Video Coming Soon
Copyright © 2025 MyJoVE Corporation. All rights reserved