In Vitro and In Vivo Evaluation of Photocontrolled Biologically Active Compounds - Potential Drug Candidates for Cancer Photopharmacology
* These authors contributed equally
In This Article
Summary
This protocol presents a set of experiments adopted for the evaluation of photoswitchable anticancer peptides, that can be used in the preclinical screening of such compounds. This includes cytotoxicity assessment in 2D and 3D cell cultures, the evaluation of ex vivo (model tissue) photoisomerization efficiency, and in vivo efficacy.
Abstract
Photocontrolled, biologically active compounds are an emerging class of "smart" drug candidates. They provide additional safety in systemic chemotherapy due to their precise spatiotemporal activation by directing a benign, non-ionizable light to a specific location within the patient's body. This paper presents a set of methods to evaluate the in vitro potency and ex vivo efficiency of the photoactivation of photocontrolled, biologically active compounds as well as the in vivo efficacy at early stages of drug development. The methodology is applied to anticancer cytotoxic peptides, namely, the diarylethene-containing analogs of a known antibiotic, gramicidin S. The experiments are performed using 2D (adherent cells) and 3D (spheroids) cell cultures of a cancer cell line (Lewis lung carcinoma, LLC), live tissue surrogates (pork meat mince), and an allograft cancer model (subcutaneous LLC) in immunocompetent mice. The selection of the most effective compounds and estimation of realistic phototherapeutic windows are performed via automated fluorescence microscopy. The photoactivation efficiency at varying illumination regimens is determined at different depths in a model tissue, and the optimal light dosage is applied in the final therapeutic in vivo experiment.
Introduction
Photocontrolled biologically active compounds have emerged in recent decades as a promising component of safe chemotherapies for human diseases and to specifically eradicate malignant solid tumors1. These compounds contain reversibly photoisomerizable fragments (molecular photoswitches) and can toggle between inactive and active photoisomers upon irradiation with light of different wavelengths.
Compared with their non-photocontrollable analogs, photocontrolled drugs may be safer because they can be systemically introduced into the patient's body in less active and essentially nontoxic forms, and are then activated by light only where necessary, such as in tumors, ulcers, and wounds. Although multiple exciting demonstrations of such molecular drug prototypes can be found in recent academic papers2,3,4,5,6,7, the field of clinical photopharmacology - an application of approved drug/medical device/disease combinations - does not exist. Photopharmacology is yet in the drug discovery stage, and systematic preclinical studies are unknown.
We only very recently demonstrated the in vivo safety advantage for some photocontrolled anticancer peptides, namely, the analogs of the peptide antibiotic gramicidin S8. These photocontrolled derivatives contain a diarylethene (DAE) photoswitch, which undergoes reversible photoinduced transformations between the so-called red light-generated "ring-open" and UV-generated "ring-closed" photoforms (illustrated in Figure 1 for one of the derivatives, compound LMB002).
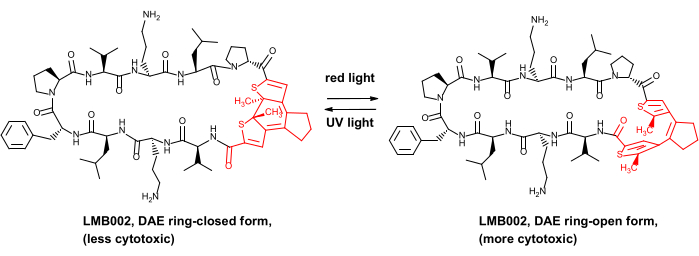
Figure 1: Photocontrolled cytotoxic peptide LMB002 and its photoisomerization. The diarylethene fragment is shown in red. Abbreviation: DAE = diarylethene. Please click here to view a larger version of this figure.
Finding hits and performing hit-to-lead optimization often require in vitro and in vivo screening of appropriate compound libraries9,10. Here, we demonstrate a methodology suitable for the systematic high-throughput screening of cytotoxicity of photocontrolled compounds. We also determine the photoisomerization efficiency, estimate the light dose in model tissues, and evaluate the in vivo efficacy of the best-performing candidates. The approach is compliant with bioethics and animal care considerations.
In this work, traditional preclinical methods are modified to avoid the noncontrolled photoisomerization of tested compounds. The overall goal of applying these modified methods herein is to develop a general strategy that is straightforward and fast and yields statistically significant data to reliably compare in vitro activities and rationalize the in vivo efficacy testing of photoswitchable compounds for lead identification and further development.
The strategy consists of three consecutive steps. The first step involves the determination of IC50 (apparent 50% cell viability) in serial dilutions for the active and inactive photoforms of selected photocontrolled biologically active compounds using two-dimensional (2D, monolayer) and three-dimensional (3D, spheroid) cell cultures and confocal high-throughput automated fluorescence microscopy. Phototherapeutic windows are compared with respect to the IC50 difference between the two photoforms, and the best-performing candidates are selected. There is no specific advantage in toxicity assessment by automated microscopy and other cytotoxicity screening platforms (assays)11; more complex cell-based tumor models12 could be easily implemented at this stage.
For the compounds selected in step 1, the second step is to realistically estimate their photoswitching efficiency inside the tissues as a function of depth from the irradiated tissue surface by quantifying the photoswitching efficiency of the less active photoforms in a tissue surrogate using UV-detected high-performance liquid chromatography (HPLC) of irradiated sample extracts. In vivo, photoswitching efficiency could be studied, but we propose to use a simple tissue surrogate - minced pork meat. We have tested the validity of this approach. We measured the conversion of our photoswitchable compounds in vivo on a mice cancer model and observed approximately the same photoconversion at a depth measured in previous experiments with mice8. Any suitable alternative artificial tissue13, 3D bioprinted tissue/organ14, biopsy materials, or another exempt animal material could be used. However, this setup is a good compromise as it is economical, fast, and ethical.
The third step is the determination of in vivo anticancer efficacy in a murine cancer model. The compounds demonstrating superior characteristics in the in vitro experiments and efficiently photoswitching at a depth of at least 1-1.5 cm in the model tissues are selected for this experiment.
This protocol can be applied to compounds possessing different types of photoswitches, provided their photoforms (or their photostationary states, PSS) are stable for a reasonable time (a few days or longer). For illustration, a previously described DAE-derived LMB002 is used15. The LMB002 photoforms are thermally stable and can be stored at −20 °C for at least a year without substantial degradation. Lewis lung carcinoma (LLC) cells are chosen for this in vitro and in vivo demonstration, but no restrictions are imposed on the cell type. LLC cells are adherent, readily culturable in 3D, and used to generate tumoroids (as described in the reference16). In vivo LLC cells are used to model metastatic processes and can readily generate solid tumors in immunocompetent mice after subcutaneous injection. This in vivo methodology can be universally applied to other cancer models17,18. The detailed implementation of this strategy is described below.
Protocol
Animal care and experimental procedures were performed following the local and international regulations for the conduct of research projects involving laboratory animals (The Law of Ukraine "On the Protection of Animals from Cruelty," European Convention for the protection of vertebrate animals used for experimental and other scientific purposes (European convention, Strasburg, 1986), Directive 2010/63/EU on the protection of animals used for scientific purposes). This study is approved by the Bioethics Commission of Bienta company. C57BL/6NCrl mice (adult females weighing approximately 20 g each) were used in these experiments. Specific materials, reagents, and equipment are listed in the Table of Materials.
1. IC50 evaluation for LMB002 ("ring-closed" and "ring-open" forms) using 2D and 3D LLC cell cultures
- Preparation of buffers and stock solutions of the compounds
NOTE: Prepare buffers using standard procedures. Alternatively, use commercially available solutions.- Prepare 10x phosphate-buffered saline (PBS) by adding 14.2 g of Na2HPO4, 2.4 g of KH2PO4, 80 g of NaCl, and 2 g of KCl to 1 L of distilled water. Autoclave prepared 10x PBS and dilute it to 1x solution by adding 100 mL of 10x solution to 900 mL of distilled water. Then, store the solution at 4 °C.
- Prepare Dulbecco's PBS (DPBS) by adding 4.78 g of DPBS powder to 1 L of distilled water. Stir the solution until all the solid dissolves, check the pH using a pH meter, and adjust it by adding 1 M NaOH or 1 M HCl (pH 7.3-7.4). After reaching the desirable pH level, filter the medium through a 0.22 µm vacuum filter in a sterile cabinet. Store at 4 °C.
- Prepare 1 M 4-(2-hydroxyethyl)-1-piperazineethanesulfonic acid (HEPES) buffer solution by adding 238.3 g of HEPES to 1 L of distilled water. Adjust the pH of the solution with 1 M NaOH until pH 7.5. Filter through a 0.22 µm vacuum filter in a sterile cabinet. Store at 4 °C.
- Prepare 1x trypsin-EDTA (EDTA = ethylenediaminetetraacetic acid) solution by diluting 10x solution. To do so, add 5 mL of 10x Trypsin-EDTA to 45 mL 1x PBS solution in a 50 mL sterile tube. Store at 4 °C.
- Prepare Dulbecco's Modified Eagle Medium (DMEM) basic by adding 13.4 g of DMEM high glucose powder and 3.7 g of Na2CO3 to 1 L of distilled water in a measuring cylinder with a magnetic stirring rod placed on a stirring plate. Stir the solution until all the solid dissolves, check the pH using a pH meter, and adjust it by adding 1 M NaOH or 1 M HCl (pH 7.3-7.4). After reaching the desirable pH, filter the medium through a 0.22 µm vacuum filter in a sterile cabinet and store at 4 °C.
- Prepare DMEM complete medium by adding 100 mL of fetal bovine serum (FBS), 10 mL of penicillin-streptomycin solution, 10 mL of L-glutamine solution, and 10 mL of 1 M HEPES buffer to 900 mL of DMEM basic. Store at 4 °C.
- Prepare stock solutions for the test compounds.
- For each compound, weigh two batches of 5.12 mg (e.g., LMB002) in the ring-closed photoform into two 1.5 mL microcentrifuge tubes (one with clear, and other black nontransparent walls). Weigh 2.28 mg of positive control (e.g., gramicidin S) in an extra-clear wall tube. Add 100 µL of pure DMSO to each sample and vortex for 30 s.
- Photoisomerize the stock solution (LMB002) in the clear wall tube from the "ring-closed" to the "ring-open" form by irradiating the solution with 660 nm laser (light power density 0.6 W/cm2) with vortexing to ensure thorough mixing. Continue until the color visibly changes from dark purple to light brown. Protect from light using aluminum foil.
- 2D cell culture experiment-seeding the cells (day 1)
- Transfer 10 mL of the DMEM complete medium from the T-75 flask with an LLC cell culture to a 15 mL sterile tube. Aspirate the leftover medium with a vacuum pump.
- Wash the cell culture with 5 mL of 1x DPBS and aspirate the solution with a vacuum pump.
- Cover the cells with 3 mL of 1x trypsin-EDTA solution and incubate the flask for 2-3 min at 37 °C in a 5% CO2 atmosphere.
- Stop the trypsin action by adding 6 mL of the DMEM medium (previously transferred to a sterile tube) to the cell culture flask containing 1x trypsin-EDTA solution and pipetting the suspension several times to wash the cells off the cell culture flask walls.
- Transfer the suspension to a 15 mL tube and centrifuge at 200 × g for 4 min. After centrifugation, aspirate the supernatant with a vacuum pump. Avoid touching the cell pellet at the bottom of the tube.
- Resuspend the cells by adding 2 mL of fresh DMEM complete medium and pipetting several times.
- Count the cells by sampling about 15 µL of the suspension into a 0.5 mL tube, adding 15 µL of 0.4% trypan blue, and transferring the obtained mixture into a cell counting chamber.
- After counting, prepare 25 mL of the cell suspension per time point. Seed 5,000-10,000 (8,000 on an average) LLC cells/well in 200 µL of DMEM in the central 60 wells of a 96-well plate with clear bottom and black nontransparent walls. Fill the remaining 36 wells with pure DMEM.
- Place the plates in a cell culture incubator overnight at 37 °C and 5% CO2. Use plastic plate lids underneath to prevent the uneven heating of the bottom plate.
- 2D cell culture experiment - adding the compounds (day 2)
- Monitor the cells by light microscopy in the plates until the cells have reached 70%-80% confluency.
- Aspirate the medium from the wells with a vacuum pump in a sterile cabinet. Add 100 µL of the fresh prewarmed DMEM medium and place the plates in a cell culture incubator.
- Prepare serial dilutions of the test compounds and positive control in polypropylene autoclaved clear plates. Make the following solutions for individual time point measurements:
NOTE: Start with the stocks in DMSO and dilute with DMEM, but do not exceed 1% v/v of DMSO in the final highest concentration.- To obtain a 128 µM solution of gramicidin S, add 1.3 µL of 20 mM stock solution to 198.7 µL of DMEM.
- To obtain a 256 µM solution of LMB002, "ring-open" form, add 1.3 µL of 40 mM solution to 198.7 µL of DMEM.
- To obtain a 512 µM solution of LMB002, "ring-closed" form, add 2.6 µL of 40 mM stock solution to 197.4 µL of DMEM.
- Perform three additional repeats to obtain four sets of each concentration point. Prepare a double dilution series by aspirating 100 µL from each starting well, transferring to a well with 100 µL of DMEM, and mixing thoroughly.
NOTE: Working with photoswitchable compounds requires lighting adjustment to prevent back photoisomerization. Switching off the light in sterile cabinets is recommended. - Obtain the final concentrations of the compounds in wells (5-150 µM) by transferring 100 µL of the prepared solutions each time in 56 wells with 100 µL of previously added DMEM. Add 100 µL of DMEM each time in four wells to serve as a negative control.
- Cover plates with aluminum foil or plastic protective nontransparent cover to prevent uncontrolled photoswitching. Place the plates in a cell culture incubator at 37 °C (using underneath extra plastic plate lids) for the chosen incubation time (10 min, 60 min, 24 h, or 72 h).
- 2D cell culture experiment - staining and imaging (days 2-5)
- After incubation with compounds for different periods, add 50 µL of the staining solution per well to the plates that were incubated with compounds for 10 and 60 min. Incubate the plates at 37 °C for 20 min.
NOTE: Prepare stock staining solutions per time point by adding 8 µL of 20 mM Hoechst 33342 solution (final concentration is 5 µM), 32.5 µL of 1 mM propidium iodide (PI) solution (final concentration is 1 µM), and 650 µL of nonsterile FBS to 5,810 µL of nonsterile 1x PBS. Prewarm FBS and PBS in a water bath at 37 °C to prevent the cells from experiencing temperature shock. - Perform automated fluorescence imaging using a 20x objective lens.
- Repeat the same staining and imaging procedure (steps 1.4.1 -1.4.2) for the plates that were incubated with compounds for 24 (day 3) and 72 (day 5) h.
NOTE: Typical 2D plate maps are shown in Figure 2.
- After incubation with compounds for different periods, add 50 µL of the staining solution per well to the plates that were incubated with compounds for 10 and 60 min. Incubate the plates at 37 °C for 20 min.
- 3D cell culture experiment - seeding the cells (day 1)
NOTE: The steps for this section are identical to those described for the 2D experiment-preparation of the cell culture, incubation with the tested compounds, and imaging (steps 1.1-1.4.) However, in this case, the cells are prepared as compact mature spheroids in a 384-well ultra-low adhesion U-bottom plate with black, nontransparent walls. Using a plate of this size allows for two compounds to be compared in one experiment.- Repeat steps 1.2.1-1.2.9 from the 2D experiment protocol with an LLC cell culture.
- After counting the cells, prepare 25 mL of the cell suspension. Seed 1,000 cells per well in all wells in 50 µL of DMEM in a 384-well, low-binding, U-bottom plate.
- Centrifuge at 40 × g for 30 s and shake with a plate shaker at 250 rpm for 1 min to shake the cells off the walls of the wells to the bottom.
- Place the plates in an incubator at 37 °C and 5% CO2 on top of extra plastic plate lids to prevent the uneven heating of the plate bottom for 48 h.
- 3D cell culture experiment - adding the compounds (day 3)
- Monitor the cells in plates by microscopy to ensure that compact mature spheroids have formed.
- Prepare a serial dilution of studied compounds in polypropylene autoclaved clear plates. In this case, include an additional compound. Make the following solutions for individual time point measurements:
- To obtain 175 µM and 350 µM solutions of gramicidin S, add 1.8 µL of 20 mM stock solution to 198.2 µL of DMEM and add 3.6 µL of stock to 196.4 µL of DMEM correspondingly.
- To obtain 175 µM and 350 µM solutions of LMB002, "ring-open" form, add 1 µL of 40 mM stock solution to 199 µL of DMEM and add 1.8 µL of stock to 198.2 µL of DMEM correspondingly.
- To obtain 350 µΜ and 1,750 µM solutions of LMB002, "ring closed" form, add 1.8 µL of 40 mM stock solution to 198.2 µL of DMEM and add 8.8 µL of stock to 191.2 µL of DMEM correspondingly.
- Perform three additional replicates to obtain four sets of each concentration point. Acquire serial dilutions by withdrawing 20 µL from each starting well, transferring it to the well, with 180 µL of DMEM, and mixing thoroughly.
NOTE: Working with photoswitchable compounds requires lighting adjustment to prevent back photoisomerization. Switching off the lights in sterile cabinets is recommended. - Obtain the final concentrations of compounds in wells by transferring 20 µL of the prepared solutions each time in 128 wells containing 50 µL of DMEM. Add 20 µL of DMEM each time in three wells to serve as a control. Cover the plates with aluminum foil or plastic protective coverage to prevent photoswitching or evaporation.
- Place the plates in a cell culture incubator on plastic plate lids for the chosen incubation time.
- 3D cell culture experiment - staining and imaging (days 3-6)
- Prepare the staining solution per time point by adding 13 µL of 1 mM calcein AM solution (final concentration is 1 µM), 22 µL of 20 mM Hoechst 33342 solution (final concentration is 33 µM), 40 µL of 1 mM PI solution (final concentration is 3 µM), 300 µL of nonsterile FBS to 2,625 µL of nonsterile 1x PBS. Prewarm FBS and PBS in a water bath at 37 °C to prevent the cells from experiencing temperature shock.
- After incubation for different periods with the compounds, add 20 µL of the staining solution per well to the wells that were incubated with compounds for 10 min. Incubate at 37 °C for 2 h.
- Perform fluorescence confocal imaging using a 20x objective lens.
- Repeat the same staining and imaging procedure for wells that were incubated with compounds for 24 (day 4) and 72 (day 6) h.
NOTE: In this experiment, calcein AM is used as a third component of the multicolor staining solution. Images obtained from 2D and 3D experiments are analyzed using the instrument's automated image analysis software. Cells co-stained with Hoechst and propidium iodide dyes are considered necrotically dead, and their fraction as a function of the concentration is used to calculate the IC50 value.
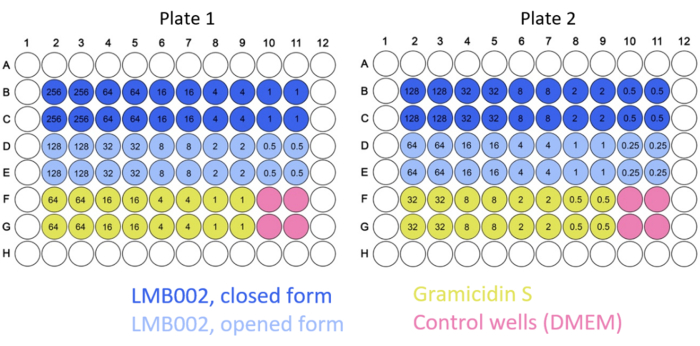
Figure 2: Example of typical plate maps for the 2D culture experiments. Color codes for the compounds and control are indicated. Concentrations of tested compounds (numbers inside the wells) are given in µM. Please click here to view a larger version of this figure.
2. Determination of the photoswitching efficiency in a tissue surrogate
- Assemble the optical train for the sample irradiation as shown in Figure 3 (consisting of an optical cable from the laser light source, a lens with variable focal length, a syringe with a nontransparent cover, and a flat cut end).
- By changing the focal length and the aperture of the lens, obtain a flat beam of light with a diameter that is 1-1.5 mm larger than the inner diameter of the used syringe but is still, as much as possible, within the aperture.
- Use a 5 mL syringe with a cut end and an inner diameter of 12.4 mm and is covered with a nontransparent plastic cover. At a laser power output of 200 mW, set the power density at the output of the optical system at ~103 mW/cm2 as measured with a photometer.
NOTE: All subsequent operations must be performed in a darkened room with the minimum possible workplace illumination. - Prepare 3 mL of LMB002 ("ring-closed" form) stock solution in PBS with a 1 mg/mL concentration.
- Prepare a model tissue sample loaded with the inactive photoform of LMB002 in a plastic container. In a typical run, 5 g of fresh minced pork meat is mechanically mixed with 277 µL of LMB002 stock solution and 260 µL of PBS to reach the final concentration of 50 mg/kg in the sample, and the ratio tissue/PBS of ~9/1 (v/v).
- Fill the syringe with the prepared sample, ensuring no air bubbles are inside, and form a flat surface at the exposure (cut) end.
NOTE: The cylinder of the sample in the syringe must occupy ~40 mm along the axis. - Irradiate the sample in the optical train as shown in Figure 3 for 9 min 44 s, corresponding to ~60 J/cm2 exposure.
- Prepare 4 mm-thick slices of the sample after the exposure by pushing it off the syringe using the piston and cutting it with a scalpel. Weigh and place the slices in separate test tubes and mark them by the mean distance (mm) from the irradiated surface.
- Prepare two control samples (optimal amount, 0.5-0.7 g) in test tubes: in one, minced meat mixed with 10% (volume) of PBS (54 µL), and in the other, the model tissue sample obtained in step 2.4 irradiated by 500 mW laser light for 10 min to ensure all LMB002 "ring-closed" molecules are converted to the "ring-open" form.
- Add acetonitrile-water mixture (70%/30% v/v, supplemented with 0.01% trifluoroacetic acid (TFA), 1.4 mL/g) to each slice and the control samples. Thoroughly mix the contents using a glass rod.
- Incubate at room temperature for at least 10 min and centrifuge the mixtures at 5220 x g for 20 min or centrifuge at 20 x g for 30 min two times to remove the insoluble material and collect the supernatant.
- Carefully collect the supernatants (~0.7 mL) and centrifuge them again at 16,000 x g for 30 min.
- Collect the supernatants (~0.5 mL each) and analyze them by reversed-phase high-performance liquid chromatography (RP HPLC) with an analytical C18 column, linear A:B gradient of 3.46% B/min, 2.0 mL/min flow rate, and 100 µL of injected volume. Record the UV-detected chromatograms at 570 nm (detection of the "ring-closed" form) and 270 nm (detection of the "ring-open" form). Use the non-irradiated (step 2.4) and irradiated control (step 2.8) samples to determine the specific retention times of both photoforms (eluent A: aqueous 0.1% TFA; eluent B: 90% acetonitrile-water, 0,1% TFA) and calibrate the method.
- Determine the actual amounts of LMB002 photoforms in the analyzed samples using the calibration curves obtained by taking and analyzing the chromatograms of LMB002 solutions of known concentrations. For calibration, prepare LMB002 "ring-closed" solutions by diluting the stock solution (step 2.3) with acetonitrile-water mixture (70%/30% v/v supplemented with 0.01% TFA) to obtain 0.36, 0.9, and 3.6 µg per 100 µL (the volume injected); the eluent gradient and flow rate are the same as in step 2.12.
- Repeat the experiment (steps 2.4-2.12) three times and plot the normalized percent of each photoform on the plot (percentage) versus the distance (from the irradiated tissue surface). Calculate the statistics (i.e., standard deviation at each concentration point).
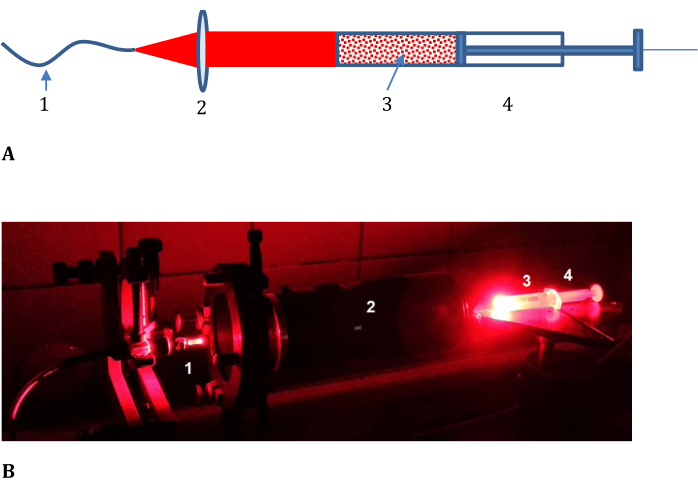
Figure 3: Experimental setup for determining the efficiency of photoconversion in model tissue. (A) Schematic and (B) photograph; 1, optical cable from the laser light source; 2, lens with variable focal length; and 3, meat mince-LMB002-phosphate-buffered saline mixture placed in 4, a syringe with a nontransparent cover and cut frontend (shown in (B) without the cover). Please click here to view a larger version of this figure.
3. In vivo anticancer efficacy determination
NOTE: The experiment schedule and endpoints are shown in Figure 4. Animal care standards in the after-treatment period should comply with the 3R rules-housing should include proper cage density and resource availability. Whenever possible, adhere to non-aversive animal handling methods such as tunnel or cupping.
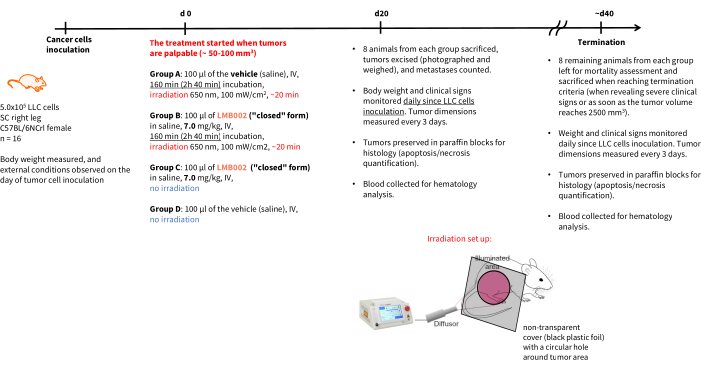
Figure 4: Schedule for the in vivo therapeutic experiment. Experimental groups' designation, therapy details, endpoints, and post mortem analysis schedules. Abbreviations: LLC = Lewis lung carcinoma; IV = intravenous; SC = subcutaneous. Please click here to view a larger version of this figure.
- Preparation of the cancer cells for subcutaneous inoculation (day 0).
- Passage the LLC cells in DMEM (4.5 g/L glucose) with 10% FBS, 100 U/mL penicillin, and 100 µg/mL streptomycin at 37 °C and 5% CO2.
- Harvest the cells using 0.05% trypsin-EDTA solution, centrifuge, and suspend in serum-free DMEM.
- Count the cells and determine their viability using a hemocytometer and trypan blue exclusion test.
- Prepare final cell suspension with concentration 10 × 106 cells/mL in DMEM and Matrigel mix (1:1). Keep the suspension on ice before injection.
- LLC cell inoculation (day 0)
- Place the adult female C57BL/6NCrl mouse (weighing ~20 g) in the induction chamber of the isoflurane anesthesia machine. Perform sedation at 5% of isoflurane and wait until the animal is fully unconscious.
- Remove the fur from the area of cell inoculation by shaving.
- Inoculate 5 × 10⁵ LLC cells in ~100 µL of DMEM: Matrigel (1:1) mixture into the right hindlimb.
NOTE: Whenever possible, adhere to the single needle use practice.
- Compound administration and photoirradiation
NOTE: In 5-8 days post-inoculation, the animals are ready for treatment when their tumors are palpable and have reached ~50-100 mm3 volume. Perform all the subsequent operations with LMB002 and mice treated by this compound under semi-dark conditions (one 4 W LED lamp at least 5 m from the workplace).- Dissolve LMB002 ("ring-closed" form) in sterile physiological saline at a concentration of 1 mg/mL for the dose of 5 mg/kg (IV) to obtain dark blue homogeneous solutions.
- Before the irradiation, randomly assemble four groups of eight animals and remove the fur from the tumor and nearby areas by shaving.
- Place a mouse in the holder for IV injections and prewarm the animal's tail in a water bath at 37 °C to make the tail vein visible.
NOTE: Consider preoperative analgesia. - Inject the compound at 5 mL/kg into the tail vein. For the two control groups, inject 100 µL of saline (intravenously) per animal (20 g body weight). Ensure the animals in the two experimental groups receive the tested compound in the inactive photoform (1 mg/mL in saline).
NOTE: Whenever possible, adhere to the single needle use practice. - Then, 2 h 45 min after the injection of the compound, place the mouse under anesthesia. Induce sedation with 3%-4% isoflurane in oxygen. Maintain anesthesia for 15 min with 0.5%-1% isoflurane in oxygen.
- Cover the mouse with a black mask possessing a hole exposing only the tumor area to the light.
- Turn on the laser diode module with a 650 nm laser and set the power of the red laser to 200 mW and the blue/UV guide laser to 2 mW.
NOTE: Use blue protective glasses when the laser device is on. - Measure the light flux from the red laser (away from the mice) with a photometer and determine the distance from the optical cable where the light flux is 100 mW/cm2. Fix the cable on a stand to ensure that the light source is at the determined distance from the tumor and the light covers the entire tumor area. Use blue/UV guide laser light during this procedure.
- Turn on the red laser to irradiate the tumor area for 20 min.
- After the irradiation, turn off the isoflurane flow, return the animal to its cage, and carefully observe its condition over the next 30 min.
NOTE: After compound administration, keep the mice in the dark for 2 days. Only the light-day cycle must be altered; all the other housing conditions should remain unchanged.
- After-treatment observations
- Observe the animals daily and measure the weight and dimensions of their tumors. Measure the tumor volume and note the progression of the necrosis.
NOTE: Animal care standards in the after-treatment period should comply with the 3R rules-housing should include proper cage density and resource availability. - Use data collected in the previous step to evaluate mortality. Determine the survival rate using the standard procedure.
NOTE: Animals should be sacrificed and counted as dead when revealing severe clinical signs (bodyweight loss of more than 15%, tumor ulceration does not heal in 7 days, and vocalization) or as soon as the tumor volume reaches 2,500 mm3.
- Observe the animals daily and measure the weight and dimensions of their tumors. Measure the tumor volume and note the progression of the necrosis.
Representative Results
In this work, 2D and 3D cell experiments were conducted to determine the IC50 for "ring-closed" and "ring-open" forms of LMB002 (see Figure 1) at different incubation times. These values were compared with those obtained for the prototype peptide, gramicidin S (used as a positive control). A typical set of images of the incubation in 2D-grown LLC culture after staining is shown in Figure 5. Co-staining with Hoechst 33342 (blue) and propidium iodide (red) resulting in different shades of purple in a bigger fraction of cells in the case of treatment with "ring-open" form in comparison to "ring-closed" indicates a noticeable difference in cytotoxicity between two forms that can easily be quantified. The demonstrated example of a successful experiment is based on the data collected using the 96-well plate format, where the peptide variants at varying concentrations were added, as shown in Figure 2. Similar data can be acquired with 384-well and high-density plates. However, since per well volumes are reduced, technical and systematic errors and, as a result, the accuracy of the IC50 determination will decrease with increasing the well density.
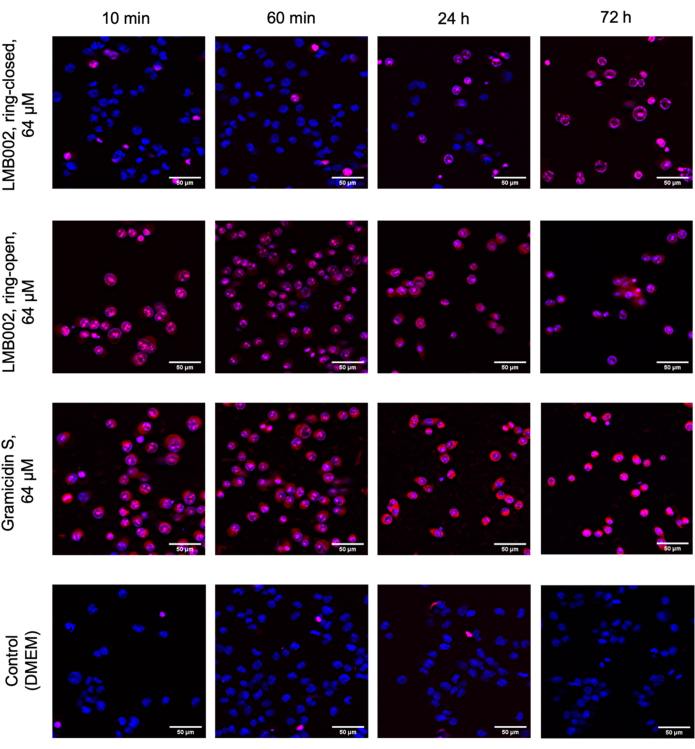
Figure 5: Representative images from the cytotoxicity assay in the monolayer-grown LLC. Cells were stained with Hoechst 33342 (blue) and propidium iodide (red). The times shown: 10 min, 60 min, 24 h, and 72 h are incubation times with compounds. Scale bars = 50 µm. Please click here to view a larger version of this figure.
The photoconversion of LMB002 by laser light irradiation in a model tissue - fresh pork mince - was determined using a sample composed of minced meat mixed with LMB002 "ring-closed" (inactive) form dissolved in PBS and measuring the conversion of this inactive form to the LMB002 "ring-open" (activated) form in the direction of radiation propagation. The sample was placed in a syringe and irradiated from one side with a flat beam of laser radiation for the exposure time of ~10 min (usually used in in vivo experiments), as shown in Figure 3. After the exposure, the sample cylinder was divided into parts by pressing the syringe piston and cutting the slices of the same height with a scalpel. The concentration of LMB002 "ring-open" in the extracts from the slices was determined using RP HPLC.
Figure 6 illustrates the dose-effect curves Figure 6A-D obtained from data analysis. To identify the percentage of dead cells with nuclear co-staining of Hoechst 33342 and PI dyes, we used a built-in classifier tool that sets numerical thresholds at selected measured parameters to split all the cell counts into several categories. For example, when the red channel (propidium iodide) signal in the control was at the threshold (approximately 110-130 units), the cells could be classified as PI-positive, considered as dead, or PI-negative, considered as unaffected by the compounds. For LMB002, sigmoidal dependences of the percentage of propidium iodide-positive cells on the compound concentration can be seen. From these data, the IC50 values can be determined.
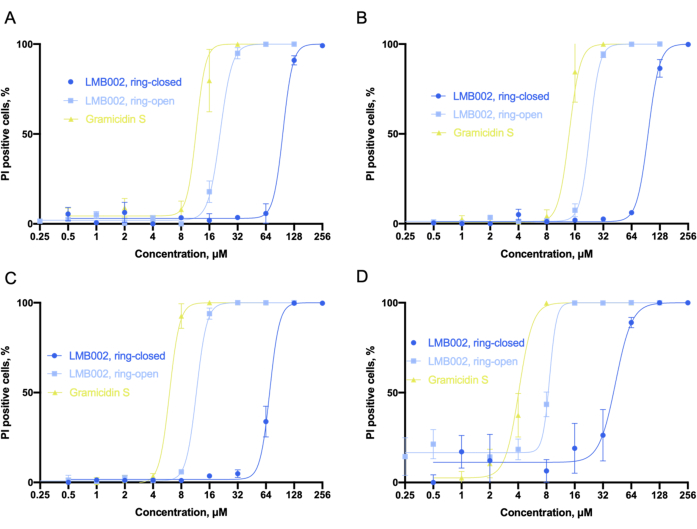
Figure 6: Analysis of cytotoxicity in 2D culture. Sigmoid fits as were obtained in the LLC culture for (A) 10 min, (B) 60 min, (C) 24 h, and (D) 72 h-time intervals taken for incubation with compounds. Fitting allows for the accurate determination of IC50 values (not shown). Error bars are SEM. Abbreviations: LLC = Lewis lung carcinoma; PI = propidium iodide. Please click here to view a larger version of this figure.
Considering the obtained IC50 values, we can conclude that the toxicity of all three compounds increased with the incubation time. Our experiment revealed that "ring-open" form of LMB002 is about one dilution step less toxic than the prototype peptide, gramicidin S. Whereas the "ring-closed" form demonstrates three to four dilution steps lower toxicity, which increases with incubation time. The difference between the two dilution steps is not affected by the increase in incubation time and can be used numerically as an experimentally determined phototherapeutic window6 for comparison with other compounds in a potential library screening. The IC50 value for gramicidin S was set as the reference point to correct experimental errors or differential outputs in biological replicates.
The 3D cell experiments produced the same type of raw data - the single cell-resolved one-per-well spheroid images. The inclusion of calcein as a third staining dye enables the quantification of the fraction of metabolically active cells (observed in the green channel). By using 384-well plates, increasing the number of technical replicates, excluding redundant co-incubation time points, and changing the dilution fold, we were able to directly compare several compounds in a single test run (using single plate) as illustrated in the plate map in Figure 7.
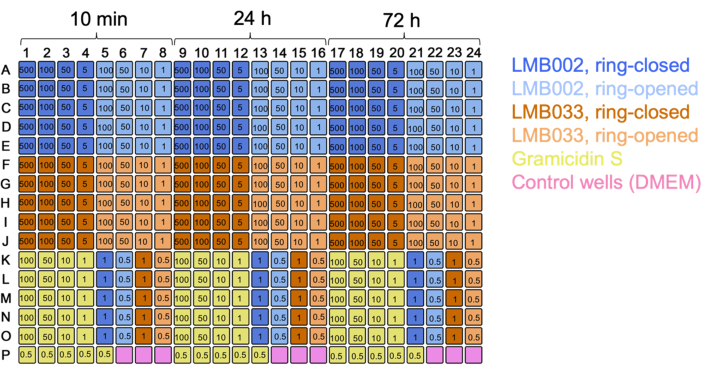
Figure 7: Plate map for the 3D culture experiment with two compounds. Color codes for the compounds and control are indicated. Numbers in wells are concentrations in µM. 10 min, 24 h, and 72 h are incubation times. Please click here to view a larger version of this figure.
Figure 8 displays the images of selected technical replicates of LLC spheroids grown at a density of 1 spheroid/well in the presence of tested compounds and control spheroids captured after staining.
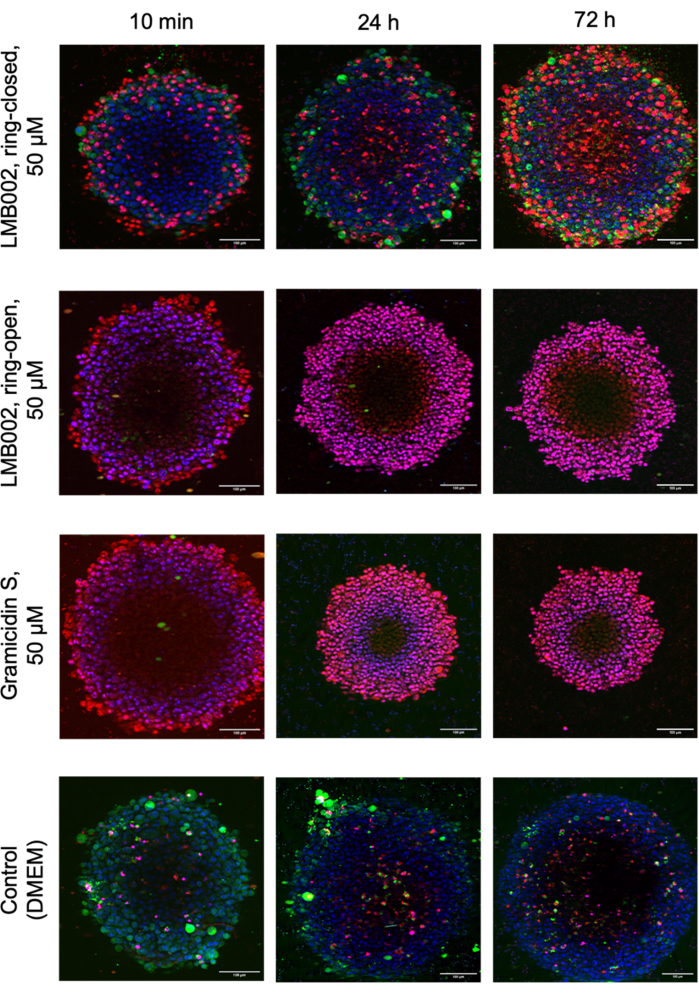
Figure 8: Representative images from 3D culture cytotoxicity assay. Images show 48-h-old LLC spheroids stained with Hoechst 33342 (blue), calcein AM (green), and propidium iodide (red) after 10 min, 24 h, and 72 h co-incubation with both LMB002 photoforms and gramicidin S. Scale bars = 100 µm. Please click here to view a larger version of this figure.
Using the instrument software, the dose-effect curves, like those in the 2D experiment, were obtained from the z-stacked piles of images (Figure 9A). In addition, compact and nondeformed spheroids in the 3D cultures could be characterized by the whole-spheroid diameter (Figure 9B). It was also noted that the overall spheroid diameter varies with compound concentration.
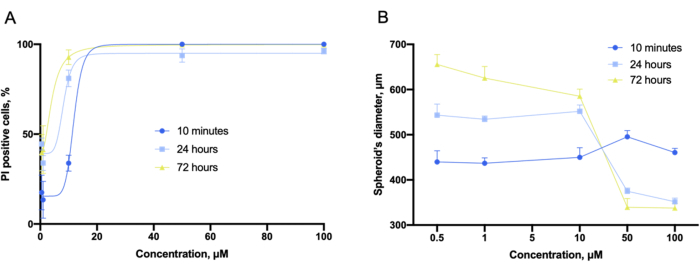
Figure 9: Cytotoxicity evaluation with 3D cultures. (A) Concentration-dependent cytotoxicity fitting curves and (B) concentration-dependent spheroid's diameter plots obtained in the 3D cultures of LLC co-incubated with gramicidin S for 10 min, 24 h, and 72 h and captured before staining. Error bars are SEM. Please click here to view a larger version of this figure.
The experiment for Step 2 allows for the determination of LMB002 concentrations in both photoforms by using UV-detected high-performance liquid chromatography. The efficiency of photoconversion in model tissues was easily assessed and quantified using this setup (Figure 3). The data were obtained from the quantitative analysis of the chromatograms of the sample extracts. In these test experiments, LMB002 chromatograms were detected spectroscopically at 270 nm and 570 nm. At 270 nm, many additional signals were observed and attributed to the compounds co-extracted from the model tissue (verified from the control extract without the compound). Both photoforms were sufficiently different in retention times and absorbance. However, the LMB002 "ring-open" signal was baseline-separated from these background signals (see a representative chromatogram in Figure 10A). Therefore, this signal can be integrated without problems. At 570 nm, the chromatograms contained only LMB002 "ring-closed" form signal (Figure 10B). Here, we performed concentration determination using RP HPLC. Nevertheless, even higher accuracy and lower detection limits could be achieved using LC/MS as the analytical method.
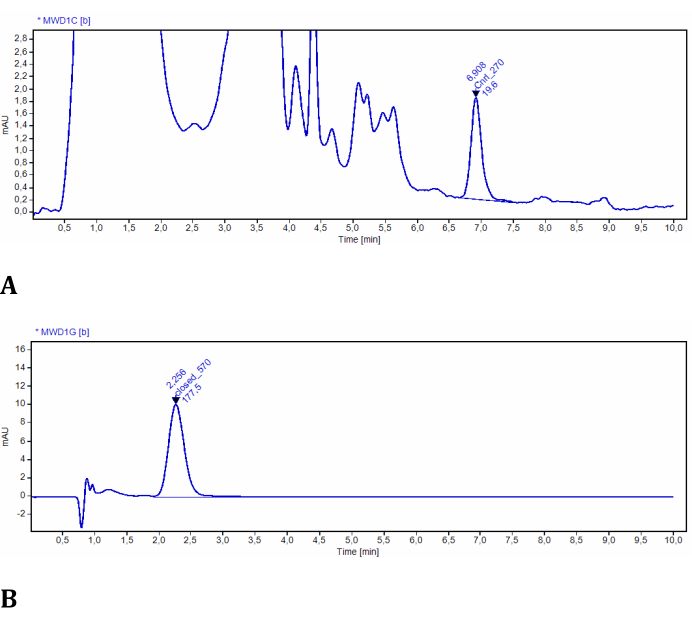
Figure 10: Representative chromatograms of LMB002 extracted from model tissues. (A) Sample at 2 mm from the irradiated surface, recorded at 270 nm (LMB002 "ring-open" form is integrated); (B) sample at 38 mm from the irradiated surface, recorded at 570 nm (the peak of LMB002 "ring-closed" is integrated). Retention time values (indicated) additionally confirmed the compound's identity. Please click here to view a larger version of this figure.
The data obtained after integrating the corresponding signals of all the collected samples were used to build the concentration-depth graphs, as shown in Figure 11. On the basis of these graphs, the efficiency of photoconversion at different depths of the model tissue was easily assessed. It confirms that our red light source induces the "ring-closed" LMB002 photoconversion at a depth of up to 1 c, in the tissue surrogate, minced meat (at approximately 103 mW/cm2).
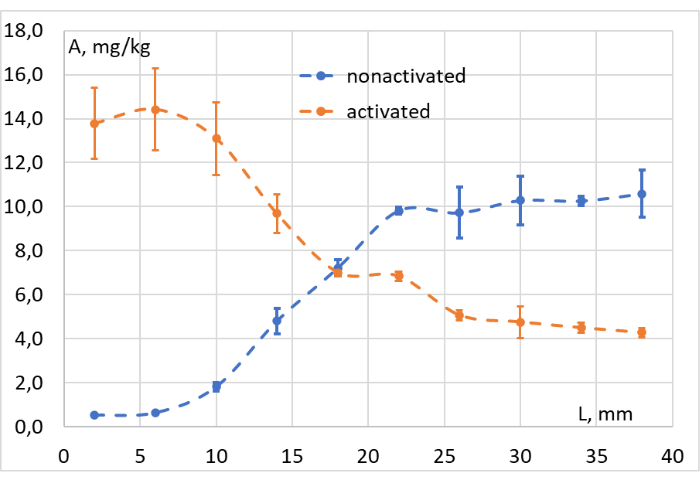
Figure 11: Photoconversion efficiency evaluation. Concentration (A, mg/kg) of LMB002 "ring-closed" (non-activated, blue dots) and "ring-open" forms (activated, orange dots) at different distances from the irradiated surface of the model tissue (L, mm). Please click here to view a larger version of this figure.
The results of the in vivo experiment - Step 3 of our methodology performed according to the schedule presented in Figure 4 - were represented by graphs showing tumor growth as a function of time (Figure 12) and Kaplan-Meier survival curves (Figure 13).
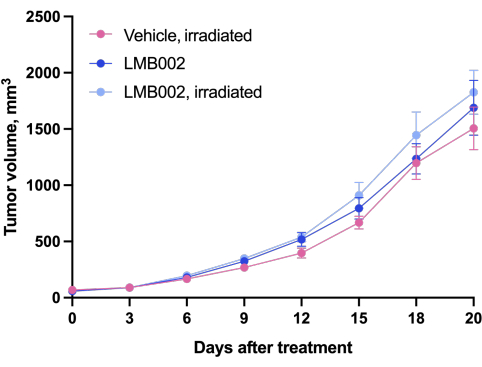
Figure 12: Tumor growth dynamics in animals. Animals treated with LMB002 compared to the vehicle-treated animals (subcutaneous LLC allograft model in C57BL/6NCrl mice, compound dose 7 mg/kg, IV, 2 h 40 min incubation, then irradiation at 650 nm, 100 mW/cm2, 20 min). Please click here to view a larger version of this figure.
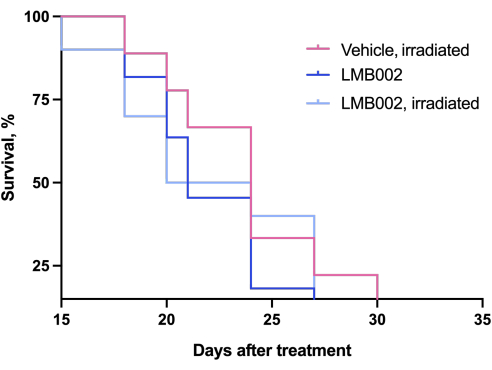
Figure 13: Mortality curves for animals. Animals treated with LMB002 compared to the vehicle-treated animals (subcutaneous LLC allograft model in C57BL/6NCrl mice, compound dose 7 mg/kg, IV, 2 h 40 min incubation, then irradiation at 650 nm, 100 mW/cm2, 20 min). Please click here to view a larger version of this figure.
Discussion
Photocontrolled compounds are unprecedented in drug development; however, no methods have been established for their preclinical and clinical evaluation. The closest monotherapy analog, photodynamic therapy (PDT), is the treatment modality for clinical use adopted by many countries against cancer and is in the development for other indications19,20. Similar to photopharmacology, PDT is also based on the use of light to activate the bioactive substance (singlet oxygen). Therefore, some experimental methods used for preclinical and clinical studies in PDT can be adopted for photopharmacology. For example, light sources, light delivery approaches, and medical devices are well-developed and approved for PDT; they can be directly used for the evaluation of photocontrolled drugs. However, PDT and photopharmacology have many distinctions from one another4, which justifies the need to establish specific methods for the latter.
First, the non-activated substance in PDT (oxygen) is always present in living tissues at nontoxic concentrations. By contrast, non-activated photocontrolled biologically active compounds can have residual activity and unwanted toxicity. Therefore, ideal photopharmacology drugs should have minimized biological activity in their administered form and must be highly active in their light-generated form, the "phototherapeutic window"21 must be as large as possible. Finding the hit and performing hit-to-lead optimization requires the identification of suitable compounds and the screening of relatively large libraries, already at early stages of drug development. Here, we proposed an automated high-throughput confocal fluorescent microscopy to identify efficient photoswitching compounds.
The chosen method of cytotoxicity evaluation allows easy implementation of the most critical requirement - maintenance of the PSS or stability of the visible-light-sensitive photoisomer. This is because, upon its implementation, the light exposure is minimized. Hence, if selecting alternative methods, automated ones should be preferred. This approach is reliable and informative. The use of 3D cell cultures (spheroids) at this stage provides a holistic understanding of the cell's response to the treatment in a more realistic tissue-like microenvironment. In addition, valuable insights into the action mechanism of the compounds can be obtained using microscopy as the direct method. The confocal fluorescent microscopy with proper staining protocol allows for the visual assessment of the morphology of the cells and spheroids; important details on the cell death and changes inside the cells can also be detected.
Second, light application requires a careful choice of light dosage. In PDT, light overdose is extremely harmful to tissues22. Photopharmacological therapy can be advantageous under excessive light irradiation. The upper limit of the activated substance is defined by the administered dose of the non-activated substance and its pharmacokinetics. However, light dosage is still an issue in photopharmacology. Care should be taken to ensure that the irradiating power density and exposure time are not less than the requirement for the therapy. In principle, the generation of the activated substance can be monitored in vivo. However, for bioethics reasons, we proposed an experiment with a model tissue (fresh minced meat) mixed with the non-activated compound15. This experiment is simple and can be modified to use different light sources. It can also be adapted for the photophysical estimation of light dosage and the measurement of thermal influences. Here again, by using model tissues, the light exposure is possible to minimize, compared, for example, to the more accurate photoswitching efficiency determination in the in vivo conditions, an alternative that may always be interesting to consider.
Finally, the compounds that demonstrate superior characteristics in the in vitro toxicity screens and are efficiently photoswitching at least 1-1.5 cm deep in the model tissue can be selected for costly, laborious, and lengthy in vivo studies. In this protocol, we used the same cell line (LLC) as in the in vitro assessment to generate the allograft cancer model. The tumor growth dynamics, mortality, and metastasis count are the parameters most suitable for assessing anticancer efficacy. Compared with conventional chemotherapy, an additional factor is applied in the photopharmacological treatment - the light. Therefore, two control animal groups are needed: one that receives only the vehicle and the other that receives the vehicle and irradiation. This setup enables the evaluation of the impact of light on the measured parameters. In our experiment, the animals of the two experimental groups received the non-activated compound, and the tumors of the mice in one group were irradiated. The irradiation regime was identical for the control and treatment groups. Comparison with benchmark chemotherapy is not necessary at this stage because the main purpose of the experiment is to demonstrate the combined effect of light and compound application. The best-performing compounds exhibiting this effect can then be selected for further study on their in vivo toxicity and comparison with benchmarks for making important go-no-go decisions on their development. Technically, the in vivo experiment that we describe can be easily adapted to pharmacokinetic or pharmacodynamics studies, for example, of a compound that is already selected as the drug lead.
Acknowledgements
The authors acknowledge EU funding by the H2020-MSCA-RISE program through PELICO (#690973) and ALISE (#101007256) projects. This work was supported by the DFG-GRK 2039 (SA, TS and ASU), the NACIP program of the Helmholtz Society (SA and ASU), and the VIP+ of the BMBF (OB and ASU). We acknowledge Dr. Serhii Koniev, Karlsruhe Institute of Technology, who has synthesized compound LMB002, purified it and kindly provided the compound for the study. The authors also thankful to Chupryna Maksym who filmed and compiled the video in Ukraine, and to all brave defenders of Ukraine that made the experimental work, writing, and filming this publication possible.
Materials
| Name | Company | Catalog Number | Comments |
| Agilent 1100 Series capillary LC system | ALSI-Chrom (Agilent distributor) | - | |
| ATCC CRL-1642, LL/2 (LLC1) Lewis lung carcinoma cell line | ECACC | 90020104 | |
| C57BL/6NCrl mice, female, inbred | Charles River | Strain code: 027 | |
| CelCulture, CO2 incubator | Esco Micro | CCL-170B | |
| Corning Matrigel Basement membrane matrix | Merck | CLS354234 | |
| Corning, 384- well spheroid microplates | Merck | CLS3830 | |
| Fetal bovine serum | Merck | F7524 | |
| Gibco, DPBS | Thermo Fisher Scientific | 21600044 | |
| Gramicidin S | Lumobiotics | Custom synthesis | |
| HyClone, DMEM/high glucose | Cytiva | SH30003.04 | |
| IN Cell Analyzer 6500HS, imaging system | Cytiva | 29240358 | |
| Invitrogen, Calcein AM | Thermo Fisher Scientific | C1430 | |
| Isoflurane anesthesia machine | ASA | S/N ASA 1305 | |
| L-glutamine, 200 mM solution | Merck | G7513 | |
| LIKA-surgeon, diode surgery laser | Fotonika plus | - | |
| LMB002 | Lumobiotics | Custom synthesis | |
| Penicillin–Streptomycin, solution stabilized | Merck | P4333 | |
| PhenoPlate, 96-well plates | PerkinElmer | 6055302 | |
| Photometer PCE-LED 20 | PCE Instruments | PCE-LED 20 | |
| Thermo Scientific, Hoechst 33342 | Thermo Fisher Scientific | 62249 | |
| Thermo Scientific, Propidium iodide | Thermo Fisher Scientific | J66764-MC | |
| Trypan blue, 0.4% solution | Merck | T8154 | |
| Trypsin–EDTA, 10 x solution | Merck | T4174 | |
| UltraCruz Cell culture flasks with vented caps, 75 cm2 | Santa Cruz Biotechnology | sc-200263 | |
| UltraCruz, bottle top filters, PES, 0.22 μm | Santa Cruz Biotechnology | sc-360882 | |
| Vydac 218TP, C18 HPLC column (4.6 mm × 250 mm, 5 µm) | Altmann Analytik (Avantor distributor) | GR5103827 |
References
- Fuchter, M. J. On the promise of photopharmacology using photoswitches: a medicinal chemist's perspective. Journal of Medicinal Chemistry. 63 (20), 11436-11447 (2020).
- Volarić, J., Szymanski, W., Simeth, N. A., Feringa, B. L. Molecular photoswitches in aqueous environments. Chemical Society Reviews. 50, 12377-12449 (2021).
- Paoletti, P., Ellis-Davies, G. C. R., Mourot, A. Optical control of neuronal ion channels and receptors. Nature Reviews Neuroscience. 20, 514-532 (2019).
- Hüll, K., Morstein, J., Trauner, D. In Vivo Photopharmacology. Chemical Reviews. 118 (21), 10710-10747 (2018).
- Ma, X., et al. In vivo photopharmacology with a caged mu opioid receptor agonist drives rapid changes in behavior. Nature Methods. 20, 682-685 (2023).
- Sarabando, S. N., Palmeira, A., Sousa, M. E., Faustino, M. A. F., Monteiro, C. J. P. Photomodulation Approaches to Overcome Antimicrobial Resistance. Pharmaceuticals. 16 (5), 682 (2023).
- Kolarski, D., Szymanski, W., Feringa, B. L., Hirota, T., Hatori, M., Panda, S. Chronophotopharmacology: Methodology for high spatiotemporal control over the circadian rhythm with light. Neuromethods. 186, (2022).
- Babii, O., et al. Peptide drugs for photopharmacology: how much of a safety advantage can be gained by photocontrol. Future Drug Discovery. 2 (1), FDD28 (2020).
- Davis, A. M., Keeling, D. J., Steele, J., Tomkinson, N. P., Tinker, A. C. Components of successful lead generation. Current Topics in Medicinal Chemistry. 5 (4), 421-439 (2005).
- Balani, S. K., Miwa, G. T., Gan, L., Wu, J., Lee, F. W. Strategy of utilizing in vitro and in vivo adme tools for lead optimization and drug candidate selection. Current Topics in Medicinal Chemistry. 5 (11), 1033-1038 (2005).
- Kleijn, A., et al. A Systematic comparison identifies an ATP-based viability assay as most suitable read-out for drug screening in glioma stem-like cells. Stem Cells International. 2016, (2016).
- Rodrigues, J., Heinrich, M. A., Teixeira, L. M., Prakash, J. 3D in vitro model revolution: unveiling tumor-stroma interactions. Trends in Cancer. 7 (3), 249-264 (2021).
- Sittinger, M., et al. Tissue engineering and autologous transplant formation: practical approaches with resorbable biomaterials and new cell culture techniques. Biomaterials. 17 (3), 237-242 (1996).
- Matai, I., Kaur, G., Seyedsalehi, A., McClinton, A., Laurencin, C. T. Progress in 3D bioprinting technology for tissue/organ regenerative engineering. Biomaterials. 226, 119536 (2020).
- Babii, O., et al. Direct photocontrol of peptidomimetics: an alternative to oxygen-dependent photodynamic cancer therapy. Angewandte Chemie International Edition. 55 (18), 5493-5496 (2016).
- De Ridder, K., et al. Novel 3D lung tumor spheroids for oncoimmunological assays. Advanced NanoBiomed Research. 2 (4), 2100124 (2022).
- Pauli, C., et al. Personalized in vitro and in vivo cancer models to guide precision medicine. Cancer Discovery. 7 (5), 462-477 (2017).
- Van Straten, D., Mashayekhi, V., De Bruijn, H. S., Oliveira, S., Robinson, D. J. Oncologic photodynamic therapy: basic principles, current clinical status and future directions. Cancers. 9 (2), 19 (2017).
- Li, X., Kwon, N., Guo, T., Liu, Z., Yoon, J. Innovative strategies for hypoxic-tumor photodynamic therapy. Angewandte Chemie International Edition. 57 (36), 11522-11531 (2018).
- Hull, K., Morstein, J., Trauner, D. In vivo photopharmacology. Chemical Reviews. 118 (21), 10710-10747 (2018).
- Babii, O., et al. Structure-activity relationships of photoswitchable diarylethene-based β-hairpin peptides as membranolytic antimicrobial and anticancer agents. Journal of Medicinal Chemistry. 61 (23), 10793-10813 (2018).
- Heckl, C., Aumiller, M., Rühm, A., Sroka, R., Stepp, H. Fluorescence and treatment light monitoring for interstitial photodynamic therapy. Photochemistry and Photobiology. 96 (2), 388-396 (2020).
This article has been published
Video Coming Soon
ABOUT JoVE
Copyright © 2024 MyJoVE Corporation. All rights reserved