In Vivo Whole-Brain Imaging of Zebrafish Larvae Using Three-Dimensional Fluorescence Microscopy
In This Article
Summary
Presented here is a protocol for in vivo whole-brain imaging of larval zebrafish using three-dimensional fluorescence microscopy. The experimental procedure includes sample preparation, image acquisition, and visualization.
Abstract
As a vertebrate model animal, larval zebrafish are widely used in neuroscience and provide a unique opportunity to monitor whole-brain activity at the cellular resolution. Here, we provide an optimized protocol for performing whole-brain imaging of larval zebrafish using three-dimensional fluorescence microscopy, including sample preparation and immobilization, sample embedding, image acquisition, and visualization after imaging. The current protocol enables in vivo imaging of the structure and neuronal activity of a larval zebrafish brain at a cellular resolution for over 1 h using confocal microscopy and custom-designed fluorescence microscopy. The critical steps in the protocol are also discussed, including sample mounting and positioning, preventing bubble formation and dust in the agarose gel, and avoiding motion in images caused by incomplete solidification of the agarose gel and paralyzation of the fish. The protocol has been validated and confirmed in multiple settings. This protocol can be easily adapted for imaging other organs of a larval zebrafish.
Introduction
Zebrafish (Danio rerio) has been widely adopted as a model vertebrate animal in neuroscience, owing to its optical transparency at the larval stage, its fast development, its low maintenance cost, and the availability of diverse genetic tools1,2,3,4. In particular, the optical transparency of larvae combined with genetically encoded fluorescent reporters of biological events5,6,7,8,9 provides a unique opportunity to image both neuronal activity and structure at the whole-brain level10,11,12,13,14. However, even with a microscope that supports cellular resolution, the acquired images do not necessarily retain the information at the single-cell level; the optical image quality may be degraded due to the aberration introduced by the agarose gel used for sample mounting, the fish may be mounted at an angle, thus the regions of interest are not fully contained within the field of view of the microscope, and the fish may move during the recording, causing motion artifacts in the images or impeding accurate signal extraction from the images.
Thus, an effective and reproducible protocol is needed to acquire high-quality image data with minimal noise and motion. Unfortunately, publicly available protocols for imaging a whole brain of larval zebrafish in vivo15,16,17,18,19 only briefly describe the procedure, leaving substantial parts of the details, such as agarose solidification, precise mounting techniques, and sample positioning using forceps, up to each experimentalist. In addition, inconsistencies in agarose concentration and immobilization methods10,11,14,15,16,17,18,19 can lead to challenges arising from fish movement during the imaging process.
Here, a detailed protocol for whole-brain imaging of larval zebrafish using three-dimensional fluorescence microscopy is provided. Figure 1 provides a graphical overview of the protocol: sample preparation and immobilization, sample embedding, image acquisition, and visualization after imaging. The structural and functional imaging of the larval zebrafish brain in vivo is demonstrated using a commercial confocal microscope and a custom-designed fluorescence microscope. This protocol can be tailored by practitioners for brain imaging with certain sensory stimuli or behavior contexts depending on the experimental needs and design.
Protocol
All zebrafish experiments were approved by the Institutional Animal Care and Use Committee (IACUC) of KAIST (KA2021-125). A total of 12 adult zebrafish with pan-neuronal expression of the calcium indicator GCaMP7a [Tg(huc:GAL4);Tg(UAS:GCaMP7a)] on a casper [mitfa(w2/w2);mpv17(a9/a9)] background were used for breeding. This group consisted of eight females and four males, with ages varying from 3 to 12 months. Imaging experiments were performed on larval zebrafish at 3-4 days post fertilization (d.p.f.), a stage during which their sex cannot be determined.
1. Zebrafish sample preparation
- Collect embryos after breeding adult fish of a desired transgenic line, such as Tg(huc:GAL4);Tg(UAS:GCaMP7a)20,21,22, in a Petri dish filled with egg water (see Table of Materials). Place the embryos in an incubator at 28 °C and raise them to 3-4 d.p.f. larvae23,24,25.
- If the zebrafish background is not albino, to inhibit a formation of pigmentation, transfer the embryos at 24 h post fertilization (h.p.f.) into the Petri dish filled with egg water containing 200 µM of 1-phenyl 2-thiourea (PTU; see Table of Materials)25,26. Every 24 h, transfer the fish into a new dish with fresh egg water containing 200 µM of PTU.
NOTE: The zebrafish are maintained under standard conditions at 28 °C and a 14:10 h light:dark cycle. The PTU treatment is known to affect the behavior and thyroid function of larval zebrafish27,28. Therefore, it is important to use the PTU with caution and to carefully control for potential confounding factors in any experiments.
- If the zebrafish background is not albino, to inhibit a formation of pigmentation, transfer the embryos at 24 h post fertilization (h.p.f.) into the Petri dish filled with egg water containing 200 µM of 1-phenyl 2-thiourea (PTU; see Table of Materials)25,26. Every 24 h, transfer the fish into a new dish with fresh egg water containing 200 µM of PTU.
- To find the sample expressing fluorescent proteins of interest (e.g., pan-neuronal GCaMP7a), screen the sample under an epi-fluorescence microscope and select a sample with a bright expression.
- Prepare the selected 3-4 d.p.f. zebrafish sample in the Petri dish filled with egg water (Figure 2A).
NOTE: To record spontaneous neuronal activity, it is recommended to use samples aged between 80-100 h.p.f., as the level of spontaneous activity is low before 80 h.p.f. and pigmentation development, even with a casper background, may degrade image quality after 100 h.p.f. - Prepare a 0.25 mg/mL pancuronium bromide solution14,19,29,30,31 by adding 1 mL of a 2.5 mg/mL stock solution (see Table of Materials) to 10 mL of the egg water. Aliquot the pancuronium bromide solution into 1.5 mL microcentrifuge tubes.
- Transfer the pre-screened sample into the Petri dish using a transfer pipette.
NOTE: Try to carry over a minimum volume of egg water with the sample. - Transfer 0.1 mL of the pancuronium bromide solution into the Petri dish for paralyzation.
NOTE: Pancuronium bromide has a potential dampening effect on neural activity in larval zebrafish32. It is essential to consider the concentration and duration of exposure to pancuronium bromide carefully.
2. 2% (wt/vol) agarose gel preparation
- Turn on a heat block and set the target temperature to 37 °C. Wait for the unit to heat up and equilibrate at the set temperature.
- Dissolve 0.2 g of low-melting point agarose powder (see Table of Materials) in 10 mL of egg water.
- Heat the agarose solution in a microwave and mix it by shaking and vortexing until the agarose is completely dissolved.
- Aliquot the agarose gel into 1.5 mL microcentrifuge tubes and store the microcentrifuge tubes on the heat block (Figure 2B).
NOTE: Check if the bubbles in the agarose gel have disappeared.
3. Sample mounting and positioning
- Check the sample under a stereomicroscope to verify that larvae movement has stopped and to evaluate the sample's health visually by checking its heartbeat (Figure 2C). If the heartbeat is too slow, discard the sample.
NOTE: If the heartbeat of the fish being imaged is too slow (e.g., below 60 beats per minute), it may not be possible to perform long-term imaging. To assess the wellness of the fish, the heart rate can be visually checked by comparing it to other fish in the same Petri dish. This will help ensure that the fish being imaged is healthy and stable enough for the imaging procedure. - Using the transfer pipette, place a single larval zebrafish into the agarose gel in the 1.5 mL microcentrifuge tube (Figure 2D).
NOTE: Ensure to discard the pipette after transferring the sample. - Pour the agarose gel into the Petri dish to make a 1-2 mm coat. Transfer the sample in the microcentrifuge tubes to the Petri dish using the transfer pipette, so that the larva is placed in the center of the dish.
NOTE: If there is dust and bubbles in the agarose gel, remove them using the transfer pipette. - Use forceps to position the sample in the desired orientation so that the head and tail are flat (Figure 2E).
- Rotate the sample using forceps so that both eyes are level (Figure 2F).
NOTE: Aligning procedures (position and rotation) should be completed before the agarose gel starts to solidify. - After the alignment, wait until the agarose gel has solidified (Figure 2G,H).
NOTE: The waiting time for the agarose gel to solidify can range from 5-10 min, depending on the volume and size of the gel. - After solidification of the agarose gel, fill the Petri dish with egg water and place the Petri dish with the embedded sample on the microscope stage (Figure 2I).
4. Image acquisition
- Turn on the microscope system (e.g., lasers, confocal controllers, microscope, and computer; see Table of Materials) and verify that the whole system is working.
- Select a low-magnification objective lens and locate the sample at the center of the field of view.
- Select a water-immersion or water-dipping objective lens with proper magnification (e.g., 16x 0.8 numerical aperture (NA) water-dipping lens; see Table of Materials). Make fine adjustments to the field of view.
- Set the imaging parameters (e.g., image size, laser power, exposure time, number of frames) using image acquisition software.
NOTE: Set the imaging parameters to achieve the best possible results for specific needs (see the setup for image acquisition in the representative results section). If the image is saturated, reduce the laser power. - Find the brain of the sample by moving the stage and determine its thickness using live view mode in the software by changing the focal planes manually up and down. Set the lower and upper limits of the volume.
NOTE: Ensure that the entire brain is contained in the field of view along both the lateral and axial directions. - Set a z-step size considering the axial resolution of the microscope.
NOTE: The optimal z-step size for imaging the larval zebrafish brain depends on the imaging modality and the resolution of the microscope. As an example, a z-step size of 5 µm was used considering the thickness of the light sheet and the average diameter of the cell bodies10. - Proceed with the image acquisition for the set field of view.
- For volumetric structural imaging, acquire a 3-D image (x,y,z) of the entire brain by changing the focal planes and obtaining 2-D images of each z-plane sequentially.
- For functional imaging of a single z-plane, acquire time-series images (x,y,t) of the neuronal activity of the brain at a certain depth.
- For volumetric functional imaging, acquire a 4-D image (x,y,z,t) of the neuronal activity in the entire brain by obtaining 3-D images sequentially.
NOTE: Set the number of frames considering the available memory size of the computer. An acquisition time of less than 1 h is recommended due to the duration of the effect of pancuronium bromide.
- After acquiring images, save the results and record the imaging parameters (e.g., pixel size, z-step size, frame rate, laser power) for image analysis.
- Export the images in an appropriate format for data rendering and image analysis.
NOTE: Exporting images in tagged image file (TIF) format format is recommended. TIF supports lossless image compression and is compatible with most image processing software and programming languages. Additionally, the TIF format supports the inclusion of metadata, such as acquisition parameters, image resolution, and other relevant information that can aid in data interpretation and reproducibility.
5. Setup for visualizations using napari
NOTE: napari is an open-source multi-dimensional image viewer in a Python environment with graphics processing unit (GPU)-based rendering33. The napari-animation plugin provides a programmatic creation of movies. Using Fiji, an open-source image processing program, is recommended for general purpose image processing, such as filtering and geometric transformation (see Table of Materials). The source code used for the visualization using napari is available on GitHub (https://github.com/NICALab/Zebrafish-brain-visualization).
- Install napari and napari-animation using either pip or conda. After installation, create a new jupyter notebook file.
NOTE: Running with jupyter notebook, which is an interactive tool for Python, is recommended over the Python script. - Import napari and napari-animation.
6. Visualizing structures using napari
- To visualize images and create movies of the rendered zebrafish brain, load the 3-D image (x,y,z) and open the napari window. Connect the napari-animation plugin (Figure 3A).
- Set parameters such as voxel size, colormap, and contrast limits in the layer controls.
- Adjust the viewer settings (e.g., perspective, angles) in the canvas.
- To capture the rendered image, press the capture button in the animation wizard.
- To generate movies of the rendered volume, modify the viewer settings and add key frames (Figure 3B).
- After adding key frames, set the number of frames (steps) between key frames in the animation wizard. Save the rendered animation.
7. Image processing and visualizing neuronal activity using napari
NOTE : To visualize the time-series images of neuronal activity as overlaid images of a static background and activity, a decomposition algorithm must be applied to the raw images. Use a MATLAB implementation of a decomposition algorithm called BEAR24. The MATLAB version of BEAR is available on GitHub (https://github.com/NICALab/BEAR).
- To decompose the static background and neuronal activity, apply BEAR to the raw time-series images (x,y,t or x,y,z,t). After the decomposition, save the images of the background and neuronal activity as TIF files (Figure 3C).
- Load the background and neuronal activity images and open the napari window. Connect the napari-animation plugin.
- Use a gray colormap for background images and a hot colormap for neuronal activity images (Figure 3C).
- Set parameters such as opacity and contrast limits in the layer controls.
- To generate movies of neuronal activity, modify the viewer settings and add key frames to render the animation.
- After adding key frames, set the number of frames (steps) between key frames in the animation wizard. Save the rendered animation.
Results
The structure and neuronal activity of the larval zebrafish brains expressing calcium indicator pan-neuronal GCaMP7a (Tg(huc:GAL4);Tg(UAS:GCaMP7a))20,21,22with a casper (mitfa(w2/w2);mpv17(a9/a9))34 background was imaged at 3-4 d.p.f. by following the described protocol.
For volumetric structural imaging, the specimen was imaged using a commercial point-scanning confocal microscopy system equipped with a 16x 0.8 NA water dipping objective lens. A 488 nm excitation laser was used for both structural and functional imaging. The frame rate, image resolution, pixel size, and axial step size were 0.25 Hz, 2048 x 2048, 0.34 µm, and 1.225 µm, respectively. The image acquisition took approximately 1 h and 20 min. The volumetric field of view of the acquired image covered the brain regions of the forebrain, midbrain, and hindbrain (Figure 4A). Neuronal cell bodies of the medulla oblongata, cerebellar plate, optic tectum, habenula, and dorsal telencephalon in the whole brain of 4 d.p.f. larval zebrafish were clearly visible in the confocal microscopy images (Figure 4B). The 3-D rendering of the confocal microscopy images was performed using napari27 by following the aforementioned protocol (Figure 4C and Video 1).
For functional imaging in 2-D, the specimen was imaged using the same confocal microscopy system, equipped with a 16x 0.8 NA water dipping objective lens. The frame rate, image resolution, and pixel size were 2 Hz, 512 x 256, and 1.5 µm, respectively. The neuronal cell bodies were clearly visible in both the background and the superimposed neuronal activity (Figure 5A,B).
For 3-D functional imaging, a custom-designed 3-D microscopy system18 was used, which was capable of in vivo imaging the neuronal activity of a whole larval zebrafish brain with a field of view of 1,040 µm × 400 µm × 235 µm and lateral and axial resolutions of 1.7 µm and 5.4 µm, respectively. The imaging rate was up to 4.2 volumes per second. Similar to rendering the structural imaging data, napari was used for 3-D rendering of the whole-brain calcium imaging data (Figure 5C and Video 2).
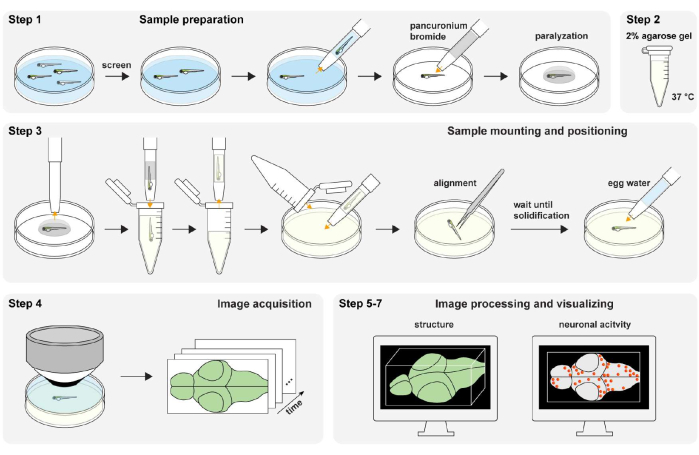
Figure 1: Overview of the experimental procedure. Zebrafish sample preparation and paralyzation (step 1). The 2% (wt/vol) agarose gel preparation (step 2). Sample mounting and positioning (step 3). Image acquisition (step 4). Image processing and visualizing structure and neuronal activity (step 5-7). Please click here to view a larger version of this figure.
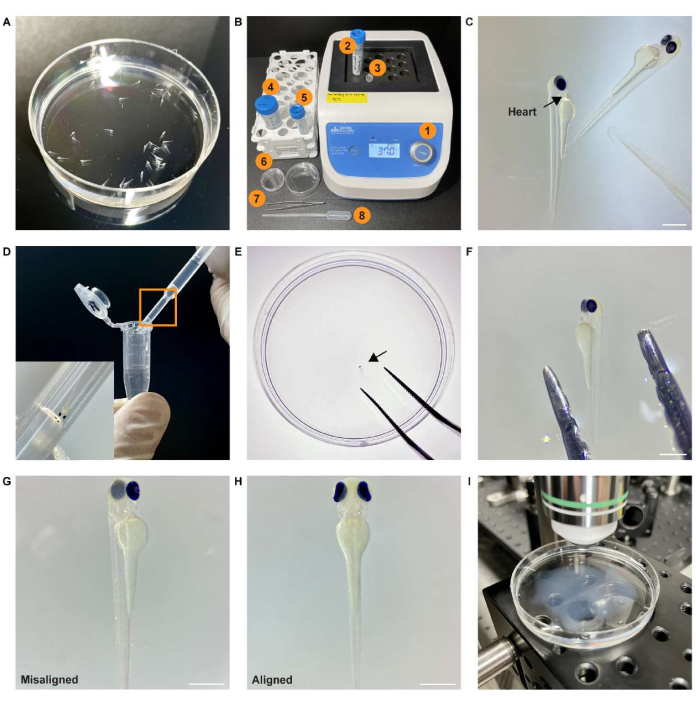
Figure 2: Experimental procedure for preparing whole-brain imaging. (A) Screened zebrafish sample expressing pan-neuronal GCaMP7a in a Petri dish filled with egg water. (B) Equipment and material required for sample mounting and positioning. (1) Heat block at 37 °C; (2) 2% (wt/vol) agarose gel; (3) 1.5 mL microcentrifuge tube; (4) egg water; (5) 0.25 mg/mL pancuronium bromide solution; (6) Petri dish; (7) forceps; (8) transfer pipette. (C) Stereomicroscope image of the paralyzed sample. The black arrow points to the heart of the sample. (D) The sample in the 1.5 mL microcentrifuge tube is transferred using a pipette. The inset shows an enlarged view of the boxed area. (E) The sample (black arrow) is placed in the center of the Petri dish using forceps. (F) The sample is aligned using forceps. (G) An example of a misaligned embedded sample. (H) An example of an aligned embedded sample. (I) The specimen is placed on a microscope stage under the objective lens for image acquisition. Scale bar: 500 µm. Please click here to view a larger version of this figure.
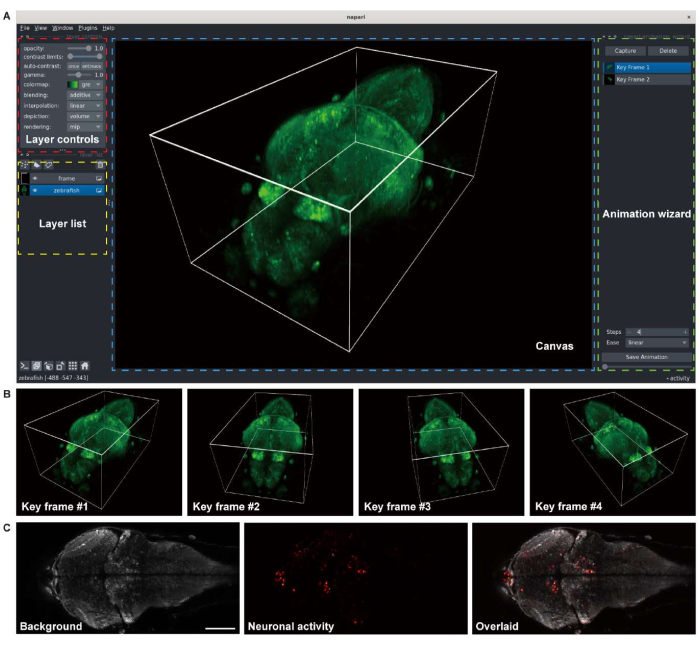
Figure 3: Visualization of larval zebrafish brain images. (A) The 3-D rendering of a confocal microscopy image of a larval zebrafish (4 d.p.f) brain expressing pan-neuronal GCaMP7a. napari, an open-source multi-dimensional image viewer in a Python environment, was used for the rendering. The napari window comprises layer controls (red box), a layer list (yellow box), a canvas (blue box), and an animation wizard (green box). (B) Key frames with multiple viewer settings are added for rendering an animation. (C) Confocal microscopy image of 2-D time-lapse imaging of the neuronal activity in the larval zebrafish brain. The image is decomposed to the background (left) and neuronal activity (middle), then overlaid (right). Scale bar: 100 µm. Please click here to view a larger version of this figure.
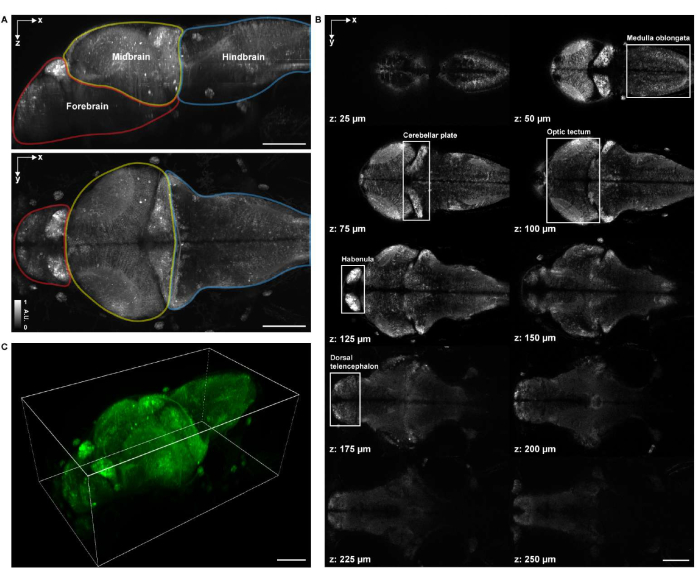
Figure 4: Imaging structure of a larval zebrafish brain. (A) Maximum intensity projection (MIP) of a confocal microscopy image of a larval zebrafish (4 d.p.f.) brain expressing pan-neuronal GCaMP7a. Top: lateral MIP. Bottom: axial MIP. Each boundary contains the forebrain (red), midbrain (yellow), and hindbrain (blue). (B) A total of 10 axial slices at multiple depths from a volumetric image of the brain (at z = 25 µm, 50 µm, 75 µm, 100 µm, 125 µm, 150 µm, 175 µm, 200 µm, 225 µm, 250 µm, counted upward from top to bottom; z = 0 µm indicates the top surface of the brain). Each white box represents the region of the brain (medulla oblongata, cerebellar plate, optic tectum, habenula, and dorsal telencephalon). (C) The whole brain rendered using napari.Scale bar: 100 µm. Please click here to view a larger version of this figure.
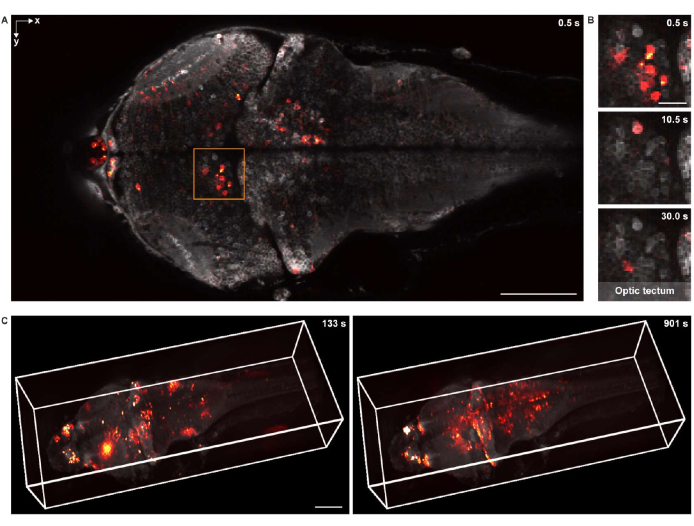
Figure 5: Imaging neuronal activity of a larval zebrafish brain. (A) Confocal microscopy image of neuronal activity in a larval zebrafish (4 d.p.f.) brain expressing pan-neuronal GCaMP7a. Scale bar: 100 µm. (B) Enlarged view of the boxed area in A showing the neuronal activity in the optic tectum at multiple time points. Scale bar: 20 µm. (C) The 3-D rendering of the whole-brain neuronal activity in the larval zebrafish brain acquired using a custom-designed microscope (left: t = 133 s; right: t = 901 s). The neuronal activity is superimposed on the static background. Scale bar: 100 µm. Please click here to view a larger version of this figure.
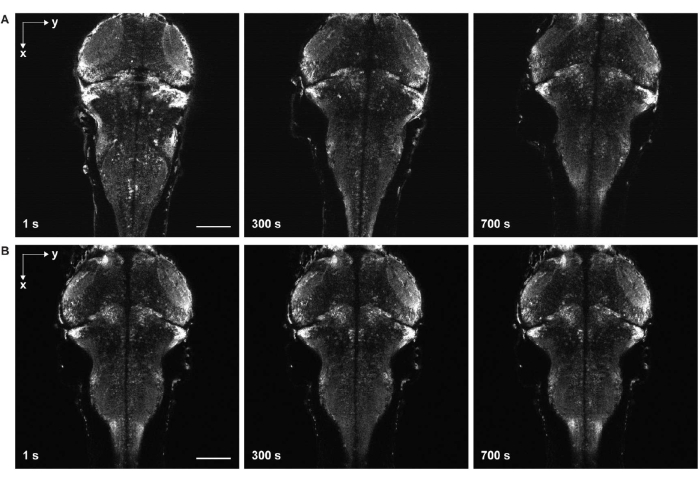
Figure 6: Time-lapse imaging with and without sample drift. (A) Time-lapse imaging of the larval zebrafish brain expressing pan-neuronal GCaMP7a with sample drift. Egg water was added to the sample before solidification of the agarose gel (step 3.6-3.7). The fish moved in the lateral and axial directions. (B) Time-lapse imaging of a larval zebrafish brain without sample drift. Egg water was added to the sample after solidification of the agarose gel (step 3.6-3.7). Scale bar: 100 µm. Please click here to view a larger version of this figure.
Video 1: 3-D rendering of the whole-brain structure of a larval zebrafish (4 d.p.f.) brain expressing pan-neuronal GCaMP7a. Please click here to download this Video.
Video 2: 3-D rendering of whole-brain neuronal activity in a larval zebrafish (4 d.p.f.) brain expressing pan-neuronal GCaMP7a. Please click here to download this Video.
Discussion
The current protocol enables in vivo whole-brain imaging of larval zebrafish over an extended period (e.g., longer than 1 h) and visualizations of the acquired structural and functional imaging data.
The most critical steps are sample mounting and positioning. During sample embedding, it is crucial to prevent bubble formation and avoid dust in the agarose gel. If the gel contains air bubbles and dust, the image quality may be severely degraded. While positioning the sample using forceps, it is important to ensure that the sample is level both horizontally and vertically. Otherwise, the regions of interest may not be contained within the field of view of the microscope. In addition, this positioning should be done within a short time window before solidification of the agarose gel to avoid causing damage to its surface, as such damage compromises the image quality.
Another major challenge is to avoid motion in images that come from incomplete solidification of the agarose gel (Figure 6) and paralyzation of the zebrafish. When egg water is added to the sample before complete solidification of the agorse gel, fish move slowly both laterally and axially, manifesting as sample drift in the time-series images (Figure 6A). If the dose of paralytics is insufficient or the duration of effect ends, the sample may attempt to move, which appears as rapid twitching in the time-lapse images.
Despite the importance of the aforementioned steps for acquiring high-quality images without motion artifacts, publicly available protocols15,16,17,18,19 provide only a brief overview of the experimental procedure, lacking these details. For instance, the acquired images without immobilization protocols11 suffer from substantial motion artifacts that make the downstream image analysis challenging. By integrating essential components, such as agarose gel solidification and sample paralyzation, our protocol significantly enhances the consistency in the quality of acquired images while minimizing motion artifacts.
In summary, an optimized and reproducible experimental procedure for in vivo imaging of the larval zebrafish brain is described. The validity and reproducibility of this protocol for in vivo imaging of brain activity and structure have been confirmed in multiple settings14,18,29,30,31. The present workflow focused on the whole-brain imaging of larval zebrafish, but it can be easily applied to imaging other organs of larval zebrafish35,36.
Disclosures
The authors declare no conflicts of interest.
Acknowledgements
The zebrafish lines used for calcium imaging were provided by the Zebrafish Center for Disease Modeling (ZCDM), Korea. This research was supported by National Research Foundation of Korea (2020R1C1C1009869, NRF2021R1A4A102159411, RS-2023-00209473).
Materials
| Name | Company | Catalog Number | Comments |
| 1.5 mL microcentrifuge tube | SciLab | SL.Tub3513 | To aliquot agarose gel and pancuronium bromide solution |
| 15 mL Falcon tubes | Falcon | 352096 | To prepare agarose gel and pancuronium bromide solution |
| 16× 0.8NA water dipping objective lens | Nikon | CFI75 LWD 16×W | Objective lens for whole-brain imaging |
| 1-phenyl 2-thiourea (PTU) | Sigma-Aldrich | P7629-10G | 200 μM of 1-phenyl 2-thiourea (PTU) |
| 50 mL Falcon tubes | Falcon | 352070 | To prepare egg water |
| Disposable transfer pipette | SciLab | SL.Pip3032 | To transfer zebrafish larvae |
| Egg water | N/A | N/A | 0.6 g sea salt in 10 L deionized water |
| Forceps | Karl Hammacher GmbH | HSO 010-10 | Forceps used for sample positioning |
| Low melting point agarose | Thermo Scientific | R0801 | 2% (wt/vol) agarose gel |
| Napari | Napari | N/A | To visualize microscopy images in 3-D |
| NIS-Elements C | Nikon | N/A | Imaging software for confocal microscope |
| Pancuronium bromide | Sigma-Aldrich | P1918-10MG | 0.25 mg/mL of pancuronium bromide solution |
| Petri dish, 35 mm | SPL Life Sciences | 11035 | Petri dish used for sample embedding |
| Petri dish, 55 mm | SPL Life Sciences | 11050 | To prepare zebrafish larvae after screening |
| Point-scanning confocal microscopy system (C2 Plus) | Nikon | N/A | Confocal microscope for whole-brain imaging |
| Sea salt | Sigma-Aldrich | S9883-500G | Sea salt used for preparing egg water |
References
- Choi, T. -. Y., Choi, T. -. I., Lee, Y. -. R., Choe, S. -. K., Kim, C. -. H. Zebrafish as an animal model for biomedical research. Experimental & Molecular Medicine. 53 (3), 310-317 (2021).
- Ahrens, M. B., et al. Brain-wide neuronal dynamics during motor adaptation in zebrafish. Nature. 485 (7399), 471-477 (2012).
- Panier, T., et al. Fast functional imaging of multiple brain regions in intact zebrafish larvae using selective plane illumination microscopy. Frontiers in Neural Circuits. 7, 65 (2013).
- Bianco, I. H., Kampff, A. R., Engert, F. Prey capture behavior evoked by simple visual stimuli in larval zebrafish. Frontiers in Systems Neuroscience. 5, 101 (2011).
- Akerboom, J., et al. Optimization of a GCaMP calcium indicator for neural activity imaging. Journal of Neuroscience. 32 (40), 13819-13840 (2012).
- Chen, T. -. W., et al. Ultrasensitive fluorescent proteins for imaging neuronal activity. Nature. 499 (7458), 295-300 (2013).
- Piatkevich, K. D., et al. A robotic multidimensional directed evolution approach applied to fluorescent voltage reporters. Nature Chemical Biology. 14 (4), 352-360 (2018).
- Tian, L., et al. Imaging neural activity in worms, flies and mice with improved GCaMP calcium indicators. Nature Methods. 6 (12), 875-881 (2009).
- Looger, L., et al. Fast and sensitive GCaMP calcium indicators for imaging neural populations. Biorxiv. , (2021).
- Ahrens, M. B., Orger, M. B., Robson, D. N., Li, J. M., Keller, P. J. Whole-brain functional imaging at cellular resolution using light-sheet microscopy. Nature Methods. 10 (5), 413-420 (2013).
- Prevedel, R., et al. Simultaneous whole-animal 3D imaging of neuronal activity using light-field microscopy. Nature Methods. 11 (7), 727-730 (2014).
- Chhetri, R. K., et al. Whole-animal functional and developmental imaging with isotropic spatial resolution. Nature Methods. 12 (12), 1171-1178 (2015).
- Ahrens, M. B., Engert, F. Large-scale imaging in small brains. Current Opinion in Neurobiology. 32, 78-86 (2015).
- Yoon, Y. -. G., et al. Sparse decomposition light-field microscopy for high speed imaging of neuronal activity. Optica. 7 (10), 1457-1468 (2020).
- Randlett, O., et al. Whole-brain activity mapping onto a zebrafish brain atlas. Nature Methods. 12 (11), 1039-1046 (2015).
- Cong, L., et al. Rapid whole brain imaging of neural activity in freely behaving larval zebrafish (Danio rerio). eLife. 6, e28158 (2017).
- Bruzzone, M., et al. Whole brain functional recordings at cellular resolution in zebrafish larvae with 3D scanning multiphoton microscopy. Scientific Reports. 11 (1), 11048 (2021).
- Cho, E. -. S., Han, S., Lee, K. -. H., Kim, C. -. H., Yoon, Y. -. G. 3DM: deep decomposition and deconvolution microscopy for rapid neural activity imaging. Optics Express. 29 (20), 32700-32711 (2021).
- Zhang, Z., et al. Imaging volumetric dynamics at high speed in mouse and zebrafish brain with confocal light field microscopy. NatureBiotechnology. 39 (1), 74-83 (2021).
- Muto, A., Ohkura, M., Abe, G., Nakai, J., Kawakami, K. Real-time visualization of neuronal activity during perception. Current Biology. 23 (4), 307-311 (2013).
- Köster, R. W., Fraser, S. E. Tracing transgene expression in living zebrafish embryos. Developmental Biology. 233 (2), 329-346 (2001).
- Park, H. C., et al. Analysis of upstream elements in the HuC promoter leads to the establishment of transgenic zebrafish with fluorescent neurons. Developmental Biology. 227 (2), 279-293 (2000).
- Avdesh, A., et al. Regular care and maintenance of a zebrafish (Danio rerio) laboratory: an introduction. Journal of Visualized Experiments. (69), e4196 (2012).
- Westerfield, M. . The zebrafish book. A guide for the laboratory use of zebrafish (Danio rerio). 4th edition. , (2000).
- Morsch, M., et al. Triggering cell stress and death using conventional UV laser confocal microscopy. Journal of Visualized Experiments. (120), e54983 (2017).
- Antinucci, P., Hindges, R. A crystal-clear zebrafish for in vivo imaging. Scientific Reports. 6, 29490 (2016).
- Parker, M. O., Brock, A. J., Millington, M. E., Brennan, C. H. Behavioral phenotyping of casper mutant and 1-pheny-2-thiourea treated adult zebrafish. Zebrafish. 10 (4), 466-471 (2013).
- Elsalini, O. A., Rohr, K. B. Phenylthiourea disrupts thyroid function in developing zebrafish. Development Genes and Evolution. 212 (12), 593-598 (2003).
- Han, S., Cho, E. -. S., Park, I., Shin, K., Yoon, Y. -. G. Efficient neural network approximation of robust PCA for automated analysis of calcium imaging data. Medical Image Computing and Computer Assisted Intervention. , 595-604 (2021).
- Shin, C., et al. Three-dimensional fluorescence microscopy through virtual refocusing using a recursive light propagation network. Medical Image Analysis. 82, 102600 (2022).
- Eom, M., et al. Statistically unbiased prediction enables accurate denoising of voltage imaging data. bioRxiv. , (2022).
- Johnston, L., et al. Electrophysiological recording in the brain of intact adult zebrafish. Journal of Visualized Experiments. (81), e51065 (2013).
- Sofroniew, N., et al. napari: a multi-dimensional image viewer for Python. Zenodo. , 3555620 (2022).
- White, R. M., et al. Transparent adult zebrafish as a tool for in vivo transplantation analysis. Cell Stem Cell. 2 (2), 183-189 (2008).
- Mickoleit, M., et al. High-resolution reconstruction of the beating zebrafish heart. Nature Methods. 11 (9), 919-922 (2014).
- Voleti, V., et al. Real-time volumetric microscopy of in vivo dynamics and large-scale samples with SCAPE 2.0. Nature Methods. 16 (10), 1054-1062 (2019).
Reprints and Permissions
Request permission to reuse the text or figures of this JoVE article
Request PermissionExplore More Articles
This article has been published
Video Coming Soon
Copyright © 2025 MyJoVE Corporation. All rights reserved