Measuring Tropospheric Ozone
Source: Laboratories of Margaret Workman and Kimberly Frye - Depaul University
Ozone is a form of elemental oxygen (O3), a molecule of three oxygen atoms bonded in a structure that is highly reactive as an oxidizing agent. Ozone occurs in both the stratosphere and the troposphere levels of the atmosphere. When in the stratosphere (located approximately 10-50 km from the earth’s surface), ozone molecules form to the ozone layer and help prevent harmful UV rays from reaching Earth’s surface. In lower altitudes of the troposphere (surface - approximately 17 km), ozone is harmful to human health and is considered an air pollutant contributing to photochemical smog (Figure 1). Ozone molecules can cause damage directly by harming respiratory tissue when inhaled or indirectly by harming plant tissues (Figure 2) and softer materials including tires on automobiles.
Outdoor tropospheric ozone is formed at ground level when nitrogen oxides (NOx) and volatile organic compounds (VOCs) from automobile emissions are exposed to sunlight. Consequently, health concerns over ozone concentrations escalate in sunny conditions or when and where automobile use is increased.
Reaction: NO2 + VOC + sunlight → O3 (+ other products)
Indoor tropospheric ozone is formed when electrical discharges from equipment using high voltages (e.g. ionic air purifiers, laser printers, photocopiers) break down the chemical bonds of the atmospheric oxygen (O2) in the air surrounding the equipment:
O2 → 2 O
The free radicals of oxygen in and around electrical discharge recombine to create ozone (O3).
2 O + 2 O2→ 2 O3

Figure 1: Golden Gate Bridge panorama
Characteristic coloration for smog in California in the beige cloud bank behind the Golden Gate Bridge. The brown coloration is due to the NOx in the photochemical smog.

Figure 2: Plants damaged by ozone. Top row is normal, bottom row has been exposed to ozone.
1. Schönbein Paper Preparation
- Place 100 mL of distilled water in a 250-mL beaker.
- Add 1¼ teaspoon of cornstarch.
- Place a stir bar in the beaker, and place the beaker on a hot/stir plate. Heat on a medium to high setting, and stir the mixture slowly until it gels near approximately 90 °C. The mixture is gelled when it thickens and becomes somewhat translucent.
- Remove the beaker from the heat source, add ¼ teaspoon of potassium iodide, and stir well.
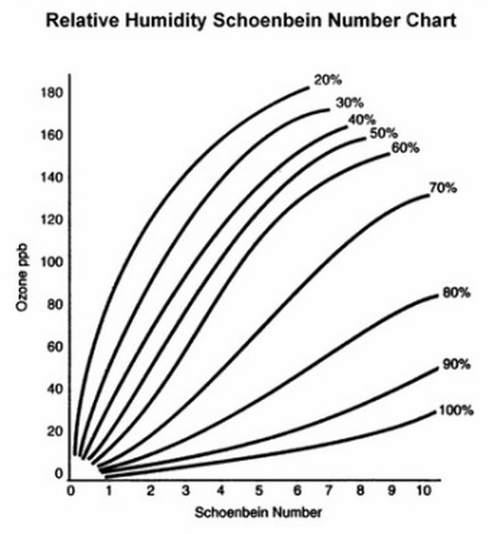
Use the Schönbein number scale (Figure 4) for quantitative analysis of ozone. The chart is used to compare with sample papers after 8 h of exposure at sample locations. Use the Relative Humidity Schönbein Number Chart to convert Schönbein scores to ozone concentration (ppb) (Figure 5).
Score increases with increasing color intensity, with the darkest violet on the right side of the scale. Results should vary based on the location of the collecti
Tropospheric ozone exposure is harmful to human health; known to cause chest pain, coughing, throat irritation, and congestion. Ozone also interferes with lung function, exacerbating symptoms of bronchitis, emphysema, and asthma, and can permanently damage lung tissue.
Outdoor locations of increased amounts of sunlight and urban areas experience higher levels of tropospheric ozone due to increased amount and density of nitrate emissions. Indoor locations where copy machines and ink printers ar
Skip to...
Videos from this collection:

Now Playing
Measuring Tropospheric Ozone
Environmental Science
26.2K Views

Tree Identification: How To Use a Dichotomous Key
Environmental Science
80.8K Views

Tree Survey: Point-Centered Quarter Sampling Method
Environmental Science
49.1K Views

Using GIS to Investigate Urban Forestry
Environmental Science
12.2K Views

Proton Exchange Membrane Fuel Cells
Environmental Science
21.9K Views

Biofuels: Producing Ethanol from Cellulosic Material
Environmental Science
52.7K Views

Testing For Genetically Modified Foods
Environmental Science
88.9K Views

Turbidity and Total Solids in Surface Water
Environmental Science
35.6K Views

Dissolved Oxygen in Surface Water
Environmental Science
55.3K Views

Nutrients in Aquatic Ecosystems
Environmental Science
38.4K Views

Determination Of NOx in Automobile Exhaust Using UV-VIS Spectroscopy
Environmental Science
29.9K Views

Lead Analysis of Soil Using Atomic Absorption Spectroscopy
Environmental Science
124.5K Views

Carbon and Nitrogen Analysis of Environmental Samples
Environmental Science
29.0K Views

Soil Nutrient Analysis: Nitrogen, Phosphorus, and Potassium
Environmental Science
214.9K Views

Analysis of Earthworm Populations in Soil
Environmental Science
16.4K Views
Copyright © 2025 MyJoVE Corporation. All rights reserved