Cell Cycle Analysis: Assessing CD4 and CD8 T Cell Proliferation After Stimulation Using CFSE Staining and Flow Cytometry
Source: Perchet Thibaut1,2,3, Meunier Sylvain1,2,3, Sophie Novault4, Rachel Golub1,2,3
1 Unit for Lymphpoiesis, Department of Immunology, Pasteur Institute, Paris, France
2 INSERM U1223, Paris, France
3 Université Paris Diderot, Sorbonne Paris Cité, Cellule Pasteur, Paris, France
4 Flow Cytometry Platfrom, Cytometry and Biomarkers UtechS, Center for Translational Science, Pasteur Institute, Paris, France
The cell cycle is a universal process of life. During the cell cycle, a cell undergoes several modifications to divide into two daughter cells. This mechanism occurs throughout an organism's life in response to its needs. Cell divisions and embryonic development produce a full organism from a single-celled zygote. During adulthood, the cell cycle is central to many critical biological processes, such as tissue repairs.
Mechanisms of cell division are tightly controlled events where the cell undergoes stepwise modifications before final division. Cells that are not yet in the cycle are described as being in the Gap 0 (G0) phase. During this stage the cell is considered quiescent. When the cell starts to cycle, four distinct phases are recognized: Gap 1 (G1), Synthesis (S), Gap 2 (G2) and Mitosis (M). G1 phase is a checkpoint for resources needed by the cell for DNA synthesis. Then, S phase occurs, and DNA replication starts, followed by the G2 interphase, another checkpoint that controls all elements necessary to for the cell to divide. Finally, the cell enters mitosis and divides into two daughter cells.
Cell division is a highly informative parameter in many different biological systems. In the field of immunology, analysis of leukocyte proliferation can indicate the mechanism of the immune response. Other domains of investigation also rely on cell cycle analysis. For instance, analysis of the cell cycle during tumor development has improved our understanding of cancer.
Many fluorescent dyes are now available for tracking cell proliferation. These dyes differ in their chemical and spectral properties. Two different classes of dyes exist: protein dyes permanently combine with protein by forming a covalent bond, and membrane dyes stably intercalate within cell membranes via strong hydrophobic associations. In vitro and in vivo studies of immune cell proliferation by flow cytometry are among the most common applications of both classes of cell tracking dyes (1, 2).
CFSE (Carboxyfluorescein succinimidyl ester) is a fluorescent dye that marks dividing cells. Initially, all the cells receive the same amount of dye; dividing cells evenly split the dye they received between their two daughter cells. Consequently, the cell cycle can be followed by the progressive decrease of dye intensity in the cells. CFSE staining is followed by conventional multi-parametric flow cytometry, a high-throughput, fluorescence-based technology that allows phenotypic and functional characterization of cells based on their degree of CFSE staining (3).
In the following experiment, we assess the proliferation of CD4+ and CD8+ T cells in-vitro, following CD3 stimulation, using CFSE staining and flow cytometry.
1. Preparation
- Before beginning, put on laboratory gloves and the appropriate protective clothing.
- Sterilize all the dissection tools, first with a detergent and then with 70% ethanol and then wipe them dry thoroughly.
- Prepare 50 mL of Hank's balanced salt solution (HBSS) containing 2% fetal calf serum (FCS).
2. Dissection
- Using a carbon dioxide delivery system, euthanize the mouse by hypoxia. Secure the euthanized mouse on a dissection plate in the supine position and perform a longitudinal laparotomy using scissors and forceps.
- Using forceps, move the intestines and stomach on the right side of the abdomen to expose the stomach and spleen. The spleen is attached to the stomach.
- Using forceps carefully detach the spleen from the stomach and place it in the Petri dish containing 5 mL of HBSS 2% FCS.
3. Immune Cell Isolation
- Place the spleen on a 40 µm cell strainer over the same Petri dish. Crush the spleen with a plunger to dissociate it.
- Transfer the dissociated spleen and the fluid into a 15 mL centrifuge tube.
- Centrifuge the tube at 370 x g for 7 min at 10°C and discard the supernatant avoiding the pellet.
- Resuspend the pellet in 2 mL of potassium acetate to lyse the erythrocytes. Wait for 2 min and then make up the volume up to 15 mL using HBSS 2% FCS.
- Centrifuge the tube again at 370 x g for 7 min at 10°C. Discard the supernatant and resuspend the pellet in 5 mL of HBSS 2% FCS.
- Count the cells using a trypan blue staining assay and adjust the final cell concentration to 107 cells/mL using an appropriate volume of HBSS 2% FCS.
4. CFSE Staining and T-cell Stimulation
- Distribute 107 isolated spleen cells/tube in 4 tubes (15 mL tubes, labeled 1 to 4)
- Add 3 mL HBSS 2%FCS to each tube.
- Add 1 µL of CSFE in each tube (final concentration- 5 µM).
- Incubate the tubes at 37°C in a 5% CO2 incubator for 10 min.
- In tubes 3 and 4, add 12 mL of HBSS 2% FCS + anti-CD3 antibody at a final concentration of 2.5 µg/mL. Tubes 3 and 4 are be stimulated using anti-CD3 antibody, to observe the effect on the cell cycle.
- In tubes 1 and 2 add 12 mL of HBSS 2% FCS. The cells in tubes 1 and 2 will not be stimulated.
- Centrifuge all the tubes at 370 x g for 7 min at 10°C. Discard the supernatants.
- Resuspend the pellets in 2 mL of HBSS 2%FCS.
- Transfer the resulting solutions into separate wells on a 6-well plate.
- Incubate the cells at 37°C, 5% CO2 for 3 days.
5. Cell Staining
- On day 3, add 2 mL HBSS 2%FCS in well 1 and 3.
- Pipet vigorously and transfer the samples into 5 mL FACS tubes.
- Continue incubating the remaining cells from wells 2-4 at 37°C, 5% CO2. They will be analyzed on day 5 to investigate the long-term effects of stimulation on the cell cycle.
- Centrifuge the tubes at 370 x g for 7 min at 10°C. Discard the supernatants.
- Add 100 µL of antibody mix (see Table 1) to each tube.
| Antibody | Fluorochrome | Dilution |
| CD3 | Pacific Blue | 1/100 |
| CD4 | BV786 | 1/1600 |
| CD8 | PE | 1/400 |
| Thy1.2 | BV605 | 1/400 |
Table 1: Antibody mix composition. Four antibody cocktail preparations using concentrated antibody-fluorescent conjugates and HBSS.
- Incubate the tubes for 20 min on ice in the dark.
- Add 1 mL of HBSS 2%FCS and centrifuge the tubes at 370 x g for 7 min at 10°C.
- Discard the supernatant and resuspend the pellets in 200 µL of HBSS 2% FCS.
- Transfer the resuspended pellets to new, labelled FACS tubes.
- Evaluate T-cell proliferation using FACS.
- On day 5, repeat the cell staining process with the cells from the remaining two wells of the 6-well plate.
6. Data Analysis
- Open the "FlowJo" software and drag the files into the "All sample" window.
- Double click on the file for unstimulated cells collected on day 3 to display a dot plot with forward scatter on the Y axis and side scatter on the X axis.
- Click on "Polygon" and create a gating strategy to select lymphoid cells, Thy1.2+ CD3+ cells and distinguish CD4+ and CD8+ cells (see Figure 1).
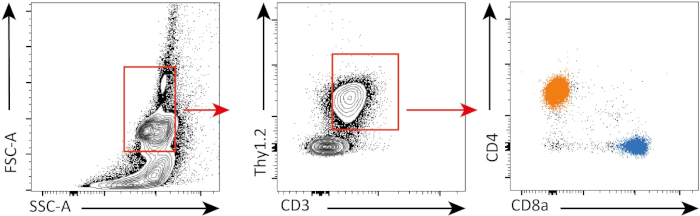
Figure 1: Gating strategy. Cells are first gated based on their morphology (left: FSC-A, SSC-A). T cells are then gated (middle: CD3, Thy1.2) and further divided on CD4+ T cells (orange) and CD8+ T cells (blue) (right: CD4, CD8). Please click here to view a larger version of this figure.
- Repeat the steps with other files.
- To determine the frequencies of dividing and non-dividing cells, first visualize the cell populations by clicking on "Layout editor."
- Drag the CD4 T cells and CD8 T cells from each of the four tubes to the "All sample window"
- Graphs representing each population will appear.
- Use histogram to visualize the results and select "CFSE" as parameter for comparison of the different tubes and the different populations.
- Non-dividing cells maintain higher levels of CFSE, whereas proliferating cells split the content of CFSE to dividing cells
- Create a gate on non-dividing cells and apply it in all tubes.
- Create a gate on dividing cells and apply it in all tubes.
- To examine the frequency of dividing CD3+ cells, click on "Table editor."
- Drag the populations of interest - dividing CD8 T-cells and dividing CD4 T-cells - into "Table."
- On the "Statistic" menu, select "frequency of T cells," then click on "Create table" to reveal the frequency in a new table.
- Click on "Create table." To reveal the frequency values, appear on a new table.
In this experiment, we followed proliferation of splenic CD4+ and CD8+ T cells in in vitro culture. After 3 days, we did not see strong proliferation in both CD4+ and CD8+ T cells with or without stimulation. This is can be seen on the top panel of Figure 2 where the peaks of CSFE are not decreasing. However, after 5 days, we started to see proliferation in both populations, which is evident from decrease in the CSFE peaks (bottom panels, Figure 2). CFSE staining, clearly demonstrates that both CD4+ and CD8+ T cells were dividing more after stimulation. In addition, CD8+ T cells seemed to be slightly more proliferative than CD4+ T cells after 5 days of stimulation.
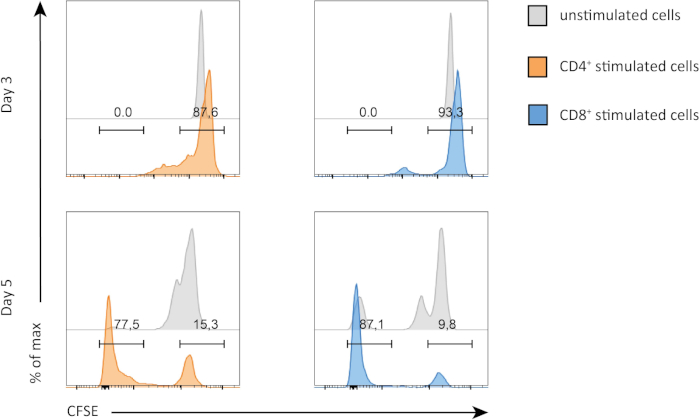
Figure 2: CD4 versus CD8 T cells proliferation. Proliferation of T cells at day 3 (top panel) and day 5 (bottom panel). Cell cycle is compared between CD4 and CD8 T cells with or without stimulation at two different days. CD4 and CD8 T cells proliferate more when stimulated. CD8 stimulated T cells proliferate more than CD4 stimulated T cells at day 5. Please click here to view a larger version of this figure.
Proliferation assays are often used in different fields such as immunology to determine the degree of activation of cells. It is also performed in oncology diagnostic to determine tumor aggressiveness in patients. CFSE staining is a useful technique to follow immune cell populations' proliferation over time. Other methods allow characterization of cell cycle. BrdU, an equivalent of CFSE is incorporated only in dividing cells. Recent Fucci mouse model even allows detection of cell cycle phases, without additional staining.
- Lyons, A. B. and Parish, C. R. Determination of lymphocyte division by flow cytometry. Journal of Immunological Methods. 171 (1): 131-37, (1994).
- Lyons, A. B. Analyzing cell division in vivo and in vitro using flow cytometric measurement of CFSE dye dilution. Journal of Immunological Methods. 243 (1-2), 147-154, (2000).
- Quah, B. J., Warren H. S., and Parish, C. R. Monitoring lymphocyte proliferation in vitro and in vivo with the intracellular fluorescent dye carboxyfluorescein diacetate succinimidyl ester. Nature Protocols. 2 (9): 2049-56, (2007).
Skip to...
Videos from this collection:

Now Playing
Cell Cycle Analysis: Assessing CD4 and CD8 T Cell Proliferation After Stimulation Using CFSE Staining and Flow Cytometry
Immunology
24.0K Views

Flow Cytometry and Fluorescence-Activated Cell Sorting (FACS): Isolation of Splenic B Lymphocytes
Immunology
92.2K Views

Magnetic Activated Cell Sorting (MACS): Isolation of Thymic T Lymphocytes
Immunology
22.6K Views

ELISA Assays: Indirect, Sandwich, and Competitive
Immunology
235.8K Views

ELISPOT Assay: Detection of IFN-γ Secreting Splenocytes
Immunology
28.2K Views

Immunohistochemistry and Immunocytochemistry: Tissue Imaging via Light Microscopy
Immunology
78.0K Views

Antibody Generation: Producing Monoclonal Antibodies Using Hybridomas
Immunology
43.1K Views

Immunofluorescence Microscopy: Immunofluorescence Staining of Paraffin-Embedded Tissue Sections
Immunology
53.3K Views

Confocal Fluorescence Microscopy: A Technique to Determine the Localization of Proteins in Mouse Fibroblasts
Immunology
42.8K Views

Immunoprecipitation-Based Techniques: Purification of Endogenous Proteins Using Agarose Beads
Immunology
87.2K Views

Adoptive Cell Transfer: Introducing Donor Mouse Splenocytes to a Host Mouse and Assessing Success via FACS
Immunology
22.0K Views

Assay for Cell Death: Chromium Release Assay of Cytotoxic Ability
Immunology
151.3K Views
Copyright © 2025 MyJoVE Corporation. All rights reserved