
Method Article
基于渐逝场光声:光学性能评估在表面
摘要
在这里,我们提出来估算材料和表面使用光声效应与全内反射相结合的光学性质的协议。这种技术渐逝场为基础的光声可以被用来创建一个光声测量系统来估计材料的厚度,松厚度和薄膜的折射率,并探讨它们的光学性质。
摘要
Here, we present a protocol to estimate material and surface optical properties using the photoacoustic effect combined with total internal reflection. Optical property evaluation of thin films and the surfaces of bulk materials is an important step in understanding new optical material systems and their applications. The method presented can estimate thickness, refractive index, and use absorptive properties of materials for detection. This metrology system uses evanescent field-based photoacoustics (EFPA), a field of research based upon the interaction of an evanescent field with the photoacoustic effect. This interaction and its resulting family of techniques allow the technique to probe optical properties within a few hundred nanometers of the sample surface. This optical near field allows for the highly accurate estimation of material properties on the same scale as the field itself such as refractive index and film thickness. With the use of EFPA and its sub techniques such as total internal reflection photoacoustic spectroscopy (TIRPAS) and optical tunneling photoacoustic spectroscopy (OTPAS), it is possible to evaluate a material at the nanoscale in a consolidated instrument without the need for many instruments and experiments that may be cost prohibitive.
引言
在1,3,4,6,7,10,13-16提供了新的见解创建的薄膜材料用于光学设备的主机的光学材料,包括上透镜抗反射涂层的理解进步,高消光比光过滤器,具有很强的吸收平板波导17。在不使用的许多表征技术,如椭圆光度法4,6,18,接触角测定,原子力显微镜7,11,19,和扫描/透射电子显微镜,其协助的迭代改进这些进步将是不可能的这些技术通过提供直接的措施或根本光学材料性质的间接估计。所述性能,如折射率,支配材料如何与入射光子,这直接影响它们的功能和它们在光学应用交互。然而,每一个这些技术中已限制与解像度化,样品制备,成本和复杂性,并且每个产生仅需要充分表征材料中的数据的一个子集。这就是说, 如图1中的一组新的技术,被称为瞬逝场基光声(EFPA)5,6,15,18,20-49,具有在纳米级的合并来估计材料性质的潜在设定的实验。 EFPA包括全内反射的光声光谱法(TIRPAS)23,25,26,33-35,43-45,光声光谱法/全内反射光声光谱屈光度(PAS / TIRPAS屈光度)18,和光隧道光声的子技术光谱(OTPAS)6,并已被用于估算散装和薄膜的折射率,膜厚,以及在棱镜/样品或衬底/样品界面以检测吸收材料。
为了了解EFPA机制,一是首先要了解的光声光谱法(PAS),它通过生色团的快速热弹扩张,光的超短(<微秒)脉冲的吸收( 图1)以下指超声压力波的产生的基本概念。在这里可以得到50-59在本文所讨论的光声效应理论和数学框架。在压力下产生的变化可以通过超声波麦克风或换能器来检测。光声效应,最初在1880年发现了亚历山大·格雷厄姆·贝尔的photophone的发明,是在20世纪70年代早期的"重新发现",因为激光和麦克风技术的进步,并最终投入实际使用,以填补因生物医学成像薄膜利基应用分析材料的无损检测。1,53-57,59-82这种效果可以用数学一维波动方程,其中描述了第E峰是一个简单的声源的压力(P)在这两个位置(x)和时间(t)变化:

与表格64简单的声源解决方案

其中p是压力,Γ=αV 第 2 / C p其中α是体积热膨胀系数,V s是声音在介质中的速度,和C p是在恒定压力下的比热容,H 0是在辐射曝光的激光束的,c是声音在激发介质的速度,x是长度,t是时间。所得声波的幅度直接依赖于该材料的光吸收系数,μA,WHICH是光穿透深度,δ,而这又是在光传播,直到它衰减到其初始光强度的1 / e的距离的量度的倒数。而等式(1)为一维平面波源的一般方程,典型吸收剂将发出在三维球形声波。以外的数学描述中,由于大的光吸收,由于天然存在的发色团的血红蛋白的光声效应54跨度许多成像模式如显微镜,断层摄影术,甚至由于具有高灵敏度的光声效应分子成像的应用程序。的光声效应的其他应用程序,甚至包括各种薄膜性能15,16,20,21,24,26-32,36-39,41,42,56,83,84的估计。然而,PAS确实有一定的局限性:(1)其广泛的光学穿透深度消除在表面探测近场光属性的能力(2)它捕捉发出的声波能量的效率低下,由于大部分能量球面传播远离探测器(3)样本必须包含在所考虑的波长政权发色团。
当与渐逝场为基础的技术相结合,然而,许多这些限制可以改善。如由斯涅尔定律,其效果也允许光纤波导引导计算和电信应用光大的距离(公里)中所述,当光束发生全内反射(TIR)发生渐逝场。在实际应用中,渐逝场是在各种表征和成像技术的使用,包括衰减全反射光谱(ATR)。成像具有高对比度取得由于光的禁闭到第一几百纳米之内到感兴趣样品。渐逝场需要一个exponentiall的形式正在使用延伸到外部介质的光学穿透深度通常是波长的量级ÿ衰减场(通常〜500nm或更小),如图方程式3和4。

其中I是在从棱镜/样品界面的某 个位置中的Z%的光强度,I 0是在%在界面的初始光强度,z是在纳米的距离,和δp是光学穿透深度如等式所示4.根据这样的小的光学穿透深度,渐逝场是能够与环境非常接近的两种材料的界面,并远低于光学和声学衍射极限相互作用。的材料或颗粒在该范围内的光学特性可能扰乱字段或以其它方式改变其产生,该相互作用可以通过多种方法3进行检测,5,6,10,15,17,18,21,23,25-27,29-47,84-95。
当渐逝技术与PAS相结合,所产生的光声波形可以用于表征与倏逝场的相互作用的材料或颗粒,产生渐逝场基于光声(EFPA)的技术家族, 如图1,本家族包括,但不限于,全内反射的光声光谱法(TIRPAS),光隧道光声光谱法(OTPAS),和表面等离子体共振的光声光谱法(SPRPAS)。有兴趣的读者应该参考以下引用了用于TIRPAS 5,6,18,23,25,26,33-35,43-47,PAS / TIRPAS折射18方程的推导,以及OTPAS 6。在每一种情况下,通过比通过棱镜简单透射率的不同的激励机构产生的光声效应;例如,在TIRPAS,光线渐逝通过一个棱镜/基材/样品界面到发色团(其可以包括样品材料本身,或示例内客体分子),而在SPRPAS,激发的主模式是不是通过表面等离子体的吸收,这是耦合当渐逝场的能量被转移到沉积在棱镜表面上的金属层的电子云中创建的二次电磁波。技术这个家庭是由Hinoue 等人在80年代初最初发明的,由T.稻垣等人加以改进,与SPRPAS的发明,但很少见到的发展,由于光源和现有的检测设备的技术限制。最近,以前的研究表明,增加的灵敏度和效用是可能的有现代聚偏二氟乙烯(PVDF)超声波探测器和Q开关掺钕钇铝石榴石(Nd:YAG激光器)激光器。具体来说,纳秒脉冲Nd:YAG激光器导致峰值功率的10 6倍的增加,这使得EFPA技术成为有用的工具,用于评估的各种材料和接口5,6,15,18,21-29,31-47,84的光学特性96。此外,以前的工作已进一步示出的这种技术的能力,以确定有关在界面材料,这是以前从来没有与传统的光声光谱法(PAS)技术可实现的结构信息,由于其相对较大的穿透深度53,55,57,59, 61,62,69,73,75,80,81。
这种能力显示在OTPAS技术下随后的协议;然而,在一个更基本的水平分别在三个技术依赖于不同的明确的方程,这决定了该技术的能力。例如,在TIRPAS,渐逝场的光穿透深度,δ'P,主要驱动所得的声信号强度以吸收样品,并且通过描述:

其中λ1是光通过棱镜介质行进的波长和由关系λ定义1 =λ/ N 1,其中n 1是棱镜材料的折射率。此外,θ是指激励的角度,而n 21指的是每个介质的折射率的比率和由n 21 = N 2 / N 1,其中,n 2是样品材料的折射率来定义。的光学穿透深度越大,越材料被照射。对于光声效应,光学穿透深度越大,更多的材料被激发,可以产生声波导致一个更大的声音信号。
与TIRPAS然而,PAS / TIRPAS折射初级方程式为斯涅耳定律:
其中n 1是所述棱镜的折射率,θ1是入射在棱镜/样品界面的角度,n 2为样品的折射率,θ2是通过第二折射的光的角度中。推定的材料的折射率的灵敏度主要由θ1的估计在内部全反射,当θ1超出其产生倏逝场的临界角,罪θ2 = 1,其实现的精度驱动因此,等式5降低到n 2 = N 1SINθ1。 (注:θ1 =θ 临界 )知道在哪些数值衍生物(DP /Dθ其中P是峰至光声信号的峰值电压和θ是光的入射角与样品的光声信号的角度)的角度有一个局部最小值允许为θ1的估计,它允许用户解决对于n 2并且因此估计的样本的体积的折射率, 如图1。
最后,在OTPAS,下面的等式涉及由%的光传输到光声峰 - 峰电压:

其中T是百分之光传输中,p是通过用在其上的膜的基板的角谱中产生的峰-峰电压, 第0是由角谱Ó产生的峰-峰电压发基底,β是基于棱镜与浸油的折射率的耦合常数,α是衰减因子,并且是包括厚度和渐逝场中的样品膜的折射率的一个因素。本技术的灵敏度与厚度和折射率由推定的峰值在角谱入射的每个角峰值的声信号强度,p和0的精度驱动。它已经表明,β可以基于棱镜和浸油的折射率直接计算;因此,这是一个简单的任务,计算入射的每个角度的光传输,并然后抽取通过统计曲线拟合分析该膜的折射率和厚度的估计值。有兴趣的读者应该参考施密特等人,更多的信息5,6。
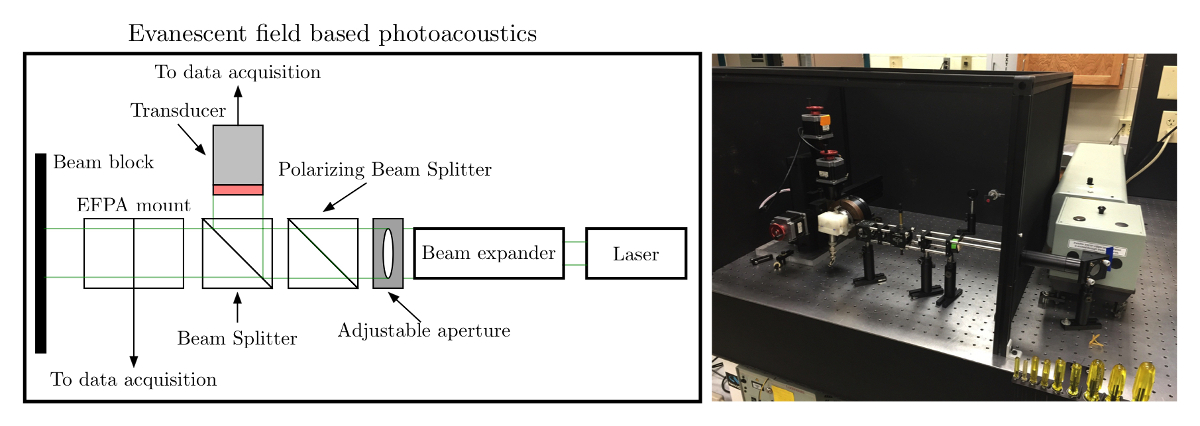
ŧ他EFPA系统能够估计厚度,薄膜折射率,散装折射率,并通过光吸收来检测产生的声信号的一个光声基础的系统。该系统包括一个激光器,一个光学系的光引导到棱镜/样品和给激光能量测量侧。激光能量测量侧被用于标准化的光声信号与入射激光能量, 如图2,EFPA系统是由一个步进电机驱动器驱动旋转的棱镜用于PAS / TIRPAS折射和OTPAS角谱/样品。该系统通过数字采集卡获取数据,并通过一个内部程序提供了一个用户界面和自动化级控制。
研究方案
1.设置系统
- 使用氰基丙烯酸酯环氧树脂附着一个9mm直径,1mm厚的红色胶乳橡胶圆筒一个10MHz的超声换能器的前面,并使用氰基丙烯酸酯环氧树脂附着一个9mm直径,1mm厚的红色胶乳橡胶缸6毫米厚丙烯酸系嵌段,然后用环氧树脂相同的方式对参考超声换能器,以充当声隔离。
- 设置有扩束的激光击中第一个光学列车。然后把一个手动调节光圈秒。最后用一个偏振分束器立方体作为第三元件,并放置在EFPA棱镜支架的超声换能器未在EFPA棱镜支架和该换能器在非偏振分束器的每一个输出。
注意:偏振束分光器立方体用于确保激发纯,单偏振因为这是所有EFPA技术正确的功能是至关重要的。 - 展开明显优于ING使用透镜来创建从Q开关Nd至少3X的光束扩展器的激光束:YAG激光器。
注意:相对于以确保尽管激光正确传感器功能走开由于折射通过棱镜以入射角不同角度对样品换能器的胶乳橡胶吸收器中的光束是故意超大。 - 对准,使得安装件的最靠近棱镜平面侧将使用数字电平被设置为0°角的光列车和EFPA棱镜支架。这确保了将在实验期间收集的角谱的数据的正确的起点。
- 连接并在外部设备上,如示波器,步进电机驱动器到计算机,该超声换能器,以及XY台马达功率。物理连接传感器不在EFPA棱镜安装到CH0和物理连接在EFPA棱镜换能器通过50欧姆BNC电缆安装到通道1。软件被预编程以识别从这些特定频道coustic信号。
2. EFPA系统初始化和光学校正
- 手动调整可调整光圈来遮挡光束到一个直径为1毫米。
- 启动编程软件( 如 LabVIEW中),按绿色的"移动"按钮,将安装移动到棱镜/样品接口所需的70°激励的角度设置角度为70°。
- 使用适当的激光安全眼镜(OD 7+在532纳米),直视棱镜从侧面垂直于所述激光束和手动移动台在X和使用手轮直到1mm的激光点是荧光可见Y轴在橡胶胶乳。确保该光束的胶乳居中。
- 展开手动可调光圈至其最大开口,并在程序的运行的前面板,以确保从EFPA棱镜安装两个激光能量测量光声信号看(红升INE)和从激光能量测量侧(白线的光声信号)是可见的,大致相同的幅度。
- 通过按"STOP"按钮来停止该程序。
注意:如果按钮没有按下棱镜将必须手动继续测试之前复位。一旦初始化协议已经完成,TIRPAS,PAS / TIRPAS屈光度,或OTPAS可以执行。
3. TIRPAS技术
- 放置棱镜在塑料棱镜安装适配器, 如图3。接下来,将2.5微升浸油指数匹配使用棱镜的类型,到棱镜的中心与通过将在基板上的顶部夹持油油层。
- 如图3放置25微升样品对在EFPA传感器安装连接到所述换能器的胶乳橡胶,以便它外套不形成气泡的整个表面。样品可以是任何光学吸收材料,例如染料的溶液中,生物流体,或悬浮在溶液中的分析物。需要的样品的任何准备。压缩棱镜安装和固定螺钉16.75克/毫米每个螺丝一套共同的扭矩拧紧坐骑。
- 选择"设置"选项卡,选择下拉菜单中的"设置"。
- 运行该程序名为OTPAS薄膜analyzer_USB-5133.vi(补充文件)。
- 查看由样品产生的声信号, 如图4。
注意:入射角可以改变,以控制渐逝场的光穿透深度,观察样品的更薄或更厚的光学部分。
4. PAS / TIRPAS折光
- 放置棱镜在塑料棱镜安装适配器, 如图3。接下来,将浸油指数的2.5微升匹配使用棱镜的类型,到第棱镜电子中心,并通过放置在基片上的油层的顶部夹持油。
- 放置25微升样品的上, 如图3连接到该换能器在换能器EFPA装入橡胶片。压缩棱镜支架和安装螺钉向16.75克/毫米为每个螺丝设定扭矩一起拧紧安装。
- 选择"角谱"标签,选择下拉菜单中的"角谱"。接着,输入如表1中所示的适当的参数到程序中。
- 运行程序,等到角谱已经完成,该计划已经结束。
- 右键单击角谱图并选择"导出→导出数据,以创先争优"保存数据并打开.csv文件。
- 打开一个图形程序这个数据( 例如 ,KaleidaGraph),并在其上点击"宏",然后选择&#进行数值导34;衍生物",输入相应的栏目采取衍生的,按"好"和数值微分将被计算出来。
- 图形数值与导数的角度,选择"曲线拟合"。选择"平滑"选项5,18,98,并选择在"曲线拟合选择"数据的复选框,以适应从数据平滑的噪声。在"查看"中选择的下拉箭头,选择"复制曲线拟合数据窗口",以曲线拟合数据提取到另一列。
- 通过曲线拟合手动搜索找到本地最小值和发病率的其相应的角度,指示从PAS到TIRPAS制度的过渡。该最小值对应于测量的临界角, 如图5,利用公式n个采样 = 正棱镜罪θC,计算出未知样品的堆积折射率的波用于激光询问长度。典型的结果示于表1中 。
5. OTPAS
- 放置2.5微升浸油(指数匹配使用的玻璃的类型)的在棱镜的中心。
- 放置膜或基底被测试膜侧(远离棱镜),并确保没有气泡被放置期间形成。
注意:如果泡沫形成,去除样品膜或基底并重新尝试应用。 - 放置25微升浸油的胶乳橡胶,使得浸油涂层,而不形成气泡的整个表面。
- 压缩的基板/薄膜层, 如图3拧紧固定螺钉16.75克/毫米的一组扭矩必须为每个螺丝相同。
注:在协议扭力扳手是oz.-in.,因此16.75克/毫米〜15 oz.-in. - 选择"角谱"标签,选择下拉男人"角谱"ü。接着,输入如表3中所示的适当的参数到程序中。
- 运行程序,等到角谱已经完成,该计划已经结束。
- 通过使用如在图6所示的基板或膜(两者以前未完成的)执行步骤5.1-5.6重新运行测试。
- 选择下拉框"曲线拟合",选择"曲线拟合"选项卡。接着,输入如表5中所示的适当的参数。选择下"样品"的电影扫描。下选择"衬底"的衬底扫描。
- 输入的折射率,偏振,和用于扫描其它选项,如表4中的步骤5.1-5.6以前运行。
- 在下拉框中选择"曲线拟合",并选择"曲线拟合"选项卡中运行该程序。观察下的折射率和厚度4;电影RI"和"在该程序的图形用户界面的右上角示出的电影"厚度典型数据示于图7。
- 使用"批量拟合"选项,通过输入扫描次数批量配合和选择.csv文件输出数据并重复步骤5.10一下子适应许多扫描。
注意:一旦运行该程序将每一组数据,输出所有折光指数,厚度和剩余价值的契合到.csv。为了使这项工作,扫描必须是一个数字列表,如scan_001.csv,扫描002.csv 等 。
结果
结果已显示为TIRPAS,PAS / TIRPAS折射,并且属于EFPA平台内的subtechniques OTPAS。 图4示出了从吸收样品产生一个代表TIRPAS声波。声波的双极性质是TIRPAS技术的特性,并表明TIRPAS正在发生。此双极波形由于在样品与玻璃基板之间的界面处的声反射由于在声阻抗大的差异发生。对于PAS / TIRPAS折射图5和表1得到。 图5示出角谱和用于进行测试,以估计本体折射率的样品获得的数值衍生物。 表1示出了使用的PAS / TIRPAS折射估计的结果水/ PEG /直红色染料混合物COMPA的整体折射率红色到使用标准的手持折射仪本体折射率的估计。最后,OTPAS结果示于图7和表2中 。 图7显示了期间所采取的角扫描的两个数字OTPAS。 表2示出OTPAS和椭圆偏振光谱法相同的薄膜样品的之间的比较。

图1. EFPA。EFPA的Subtechnologies目前由三个不同的子技术。这些技术是TIRPAS,PAS / TIRPAS折射和OTPAS。每一种技术可以评估材料,以获得或确定不同的属性。 TIRPAS检测基于其用于生物传感的目的的光吸收材料,PAS / TIRPAS屈光度计算整体折射率,以及OTPAS评估薄膜折射率的ð厚度。在TIRPAS,光超出临界角θC创建倏逝场,可以产生在与光吸收体相互作用的声波。在PAS / TIRPAS折射,无论TIRPAS和PAS波形从两个消逝场光声激发和传统的光声激励获得的。通过在角谱图表绘制这两个机制,过渡角可以观察到,然后可将其用于推导的折射率。最后,在OTPAS,与超过临界角θc代表在衬底上既是薄膜和裸露基底的激光照射得到的声学信号的频谱。通过应用非线性曲线拟合算法对数据,薄膜厚度和折射率可以的。 请点击此处查看该图的放大版本。

图 2. EFPA原理图/照片左:要设置EFPA激光束的扩大必须溢出的乳胶覆盖的感应区。梁最初应以45度角棱镜,如图所示。右:显示光学列车设置的照片请点击这里查看该图的放大版本。

图3. 示例加载。样品装入使得通过浸油到衬底光学接触的棱镜。在TIRPAS或PAS / TIRPAS折射,直接液体接触与基板用于测试在样品上实现。在OTPAS,光学耦合救援人员到场唉基材和红色乳胶之间的附加浸油允许发生光的隧道。挂载然后夹在一起使用扭矩扳手和安装螺丝。 请点击此处查看该图的放大版本。

图4. TIRPAS的典型数据。TIRPAS波形通常有一个双极声信号的外观,是TIRPAS方法的特点。 请点击此处查看该图的放大版本。

图5. PAS / TIRPAS典型的数据。</强>左:是受照射在各种入射角的样品获得角光谱数据。右:左图,揭示一个局部最小值指示从PAS到TIRPAS制度,这又与临界角的位置对应的过渡的数值衍生物。转载许可。18 ,请点击此处查看该图的放大版本。

图6.程序流程图 。该方案是在几个迭代步骤运行。棱镜安装被设置为零度,然后参数运行的程序之前选择。然后程序运行到获得既基板和膜的角谱。最后,曲线拟合到数据来估计该膜的折射率和厚度。转载许可。6 ,请点击此处查看该图的放大版本。

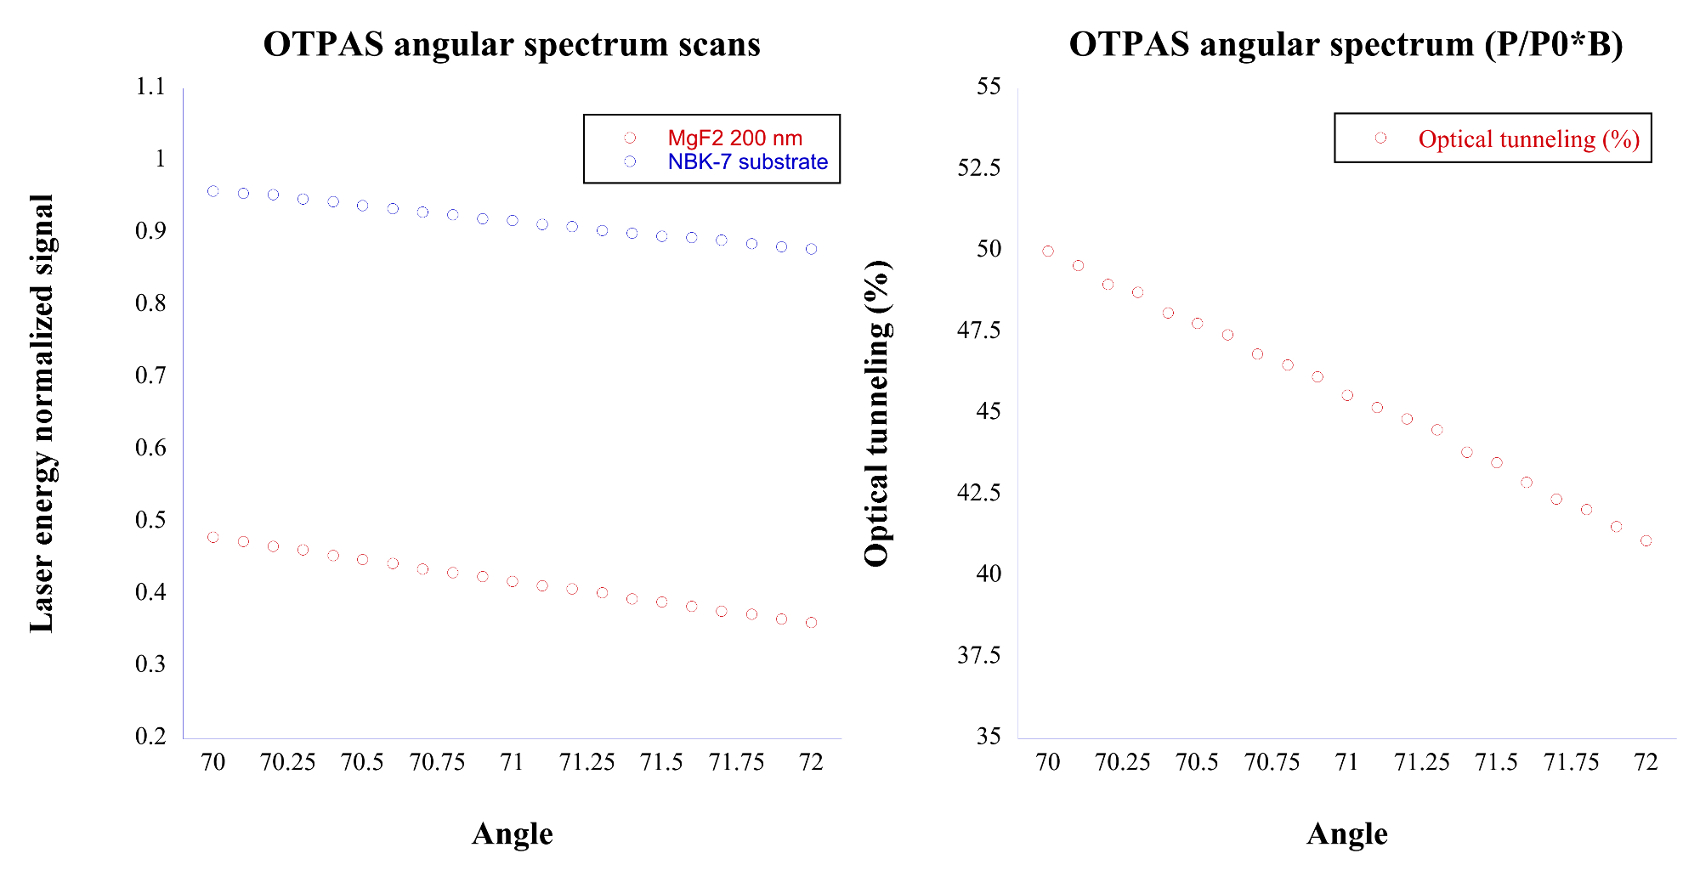
图 7. OTPAS典型数据左:该图显示了氟化镁膜和分别的N-BK7衬底的角谱扫描。右:通过由N-BK7衬底扫描分割氟化镁薄膜角频谱的扫描和由常量因子β相乘,可以得到光隧道(%)对入射角度,其允许折射的估计指数和薄膜厚度。 请点击此处查看该图的放大版本。
| PAS / TIRPAS | 示例1 | 示例2 | 样品3 | 样品4 | 样品5 | 爱宕R-5000 |
| 直接冲/ PEG 125微克/毫升 | 1.395 | 1.395 | 1.395 | 1.395 | 1.395 | 1.395-1.397 |
| 直接冲/ PEG 250微克/毫升 | 1.39 | 1.39 | 1.39 | 1.39 | 1.39 | 1.390-1.396 |
| 直接冲/ PEG 500微克/毫升 | 1.388 | 1.389 | 1.389 | 1.389 | 1.389 | 1.381-1.395 |
| 直接冲/ PEG 750微克/毫升 | 1.382 | 1.382 | 1.387 | 1.387 | 1.387 | 1.372-1.395 |
| 肌红蛋白 460微克/毫升 | 1.33 | 1.329 | 1.331 | 1.33 | 1.331 | 1.335 |
表1. PAS / TIRPAS结果。下表显示了对直接红染料,用50%的PEG混合在提高折射率的典型结果。经许可后转载。18
| 测试类型 | 技术 | 电影类型 | 折射率 | 膜厚(nm) |
| Intrasample | OTPAS | 氟化镁200纳米 | 1.384±0.004 | 203±6 |
| Intrasample | 椭sometry | 氟化镁200纳米 | 1.393±0.001 | 192.4±1.1 |
| 内采样 | OTPAS | 氟化镁200纳米 | 1.395±0.011 | 220±19 |
| 内采样 | 椭偏仪 | 氟化镁200纳米 | 1.392±0.002 | 195.2±1.8 |
表2. OTPAS结果。下表所示为200纳米的氟化镁薄膜在OTPAS与光谱椭偏典型结果。 Intrasample指测试单个膜十倍,而内采样是指独立地测试十部影片。转载许可。6
| 平均排名 | 1 | 起始角 | 60 | 预热(分钟) | 0 | 折射率(棱镜) | 1.519 |
| #扫描 | 1 | 步长 | 0.1 | 存到 | "yourfilename名为".csv | 微# | 10 |
| 设置Q开关 | 275 | 停止角 | 80 | 激光选择 | Surelite | 速度(RPM) | 500 |
| 误差容限(%) | 五 | 激光启动 | 上 | 低通滤波器(PROG随机存取存储器) | 1.00×10 7 | 加速(RPS) | 200 |
表 PAS / TIRPAS折射 3. 角谱设置。下表显示了必需的PAS / TIRPAS折射的角谱中的设置。
| 平均排名 | 64 | 起始角 | 70 | 预热(分钟) | 1 | 折射率(棱镜) | 1.519 |
| #扫描 | 1 | 步长 | 0.1 | 存到 | "yourfilename&#8221;的.csv | 微# | 10 |
| 设置Q开关 | 275 | 停止角 | 72 | 激光选择 | Surelite | 速度(RPM) | 500 |
| 误差容限(%) | 五 | 激光启动 | 上 | 低通滤波器(节目) | 1.00×10 7 | 加速(RPS) | 200 |
表 OTPAS 4. 角谱设置。下表显示了所必需的OTPAS一个角谱中的设置。
| 低的折射率 | 1 | 公差 | 1.00×10 -12 | 耦合器RI | 1.519 | 基底数据 | 选择yourfilename.csv |
| 较低的厚度 | 0纳米 | 折射率猜测 | 1.3 | 波长 | 532纳米 | 多个文件保存到 | 选择yourfilename.csv |
| 厚度上限 | 1000纳米 | 厚度猜想 | 200纳米 | 极化 | P偏振光 | 多少个文件 | 文件#要适应 |
| 最大迭代 | 5000 | 基质RI | 1.519 | 电影数据 | 选择yourfilename.csv | 适合类型 | 单FIT /批适合 |
表5. 曲线拟合参数。下表显示了所必需的正确参数估计的曲线拟合参数。
补充编码文件:OTPAS薄膜analyzer_USB-5133.vi 请点击这里下载此文件。
讨论
The use of devices for the characterization of materials at the nanoscale will undoubtedly continue far into the future in order to produce new materials and combinations of materials to solve difficult and costly societal problems. Many methods such as ellipsometry, atomic force microscopy (AFM), and traditional photoacoustics are currently used to evaluate material properties at the nanoscale despite their inherent limitations due to few alternatives. EFPA shows promise as a consolidated set of techniques that can push beyond the typical limitations of the photoacoustic effect to provide a single instrument to characterize materials at the nanoscale.
The protocol described herein and its associated sub-techniques have the capability to estimate both bulk and thin film refractive indices of a material, film thickness, and have detection capabilities for a variety of biosensing applications. OTPAS specifically has the advantage that it can estimate the thickness and refractive index of nanometer scale films despite the fact that the films themselves do not contain inherently absorbing pigmentation. EFPA as a consolidated set of techniques has a few advantages over techniques such as ellipsometry, atomic force microscopy, and the traditional photoacoustic effect. The first advantage is that EFPA is comparatively inexpensive to set up. A typical EFPA setup can estimate refractive index from both the bulk and surface, can estimate thickness, and can probe absorbing materials and will cost around $5,000 to set up. In contrast, AFM setups cost around $50,000 and cannot estimate optical properties. Secondly, EFPA can estimate these properties within a few minutes without complex interaction such as in ellipsometry where input parameter error can cause differences in results. Finally, EFPA, when compared to the traditional photoacoustic effect, has axial resolution 100X smaller as it can estimate thickness of 200 nm films6 whereas the traditional photoacoustic effect is limited to 7,500 nanometers when using similar lasers and setup82. Conveniently, almost every material has independent and differing surface and bulk refractive index properties as well as absorptive properties, which collectively make for functional differences in their use in optical research systems.
Critical steps within the protocol come down to three primary considerations. First, optical coupling of the sample, whether that be a liquid or a film, is crucial to obtain reliable and repeatable results. Air bubbles within the immersion oil or sample will lead to inaccurate characterization of the thickness, refractive index, and in some cases a complete lack of sensitivity of the transducer to the excited sample owing to the inability of ultrasound to adequately pass through a liquid/air interface due to vastly differing acoustic impedance values. Second, with regard to OTPAS, a sample that is homogeneously thick in the area irradiated by the laser beam in order to provide consistent thickness values during scanning since as of yet EFPA cannot determine thickness differences within the area of excitation. Finally, again with regard to OTPAS, the sample film must be transparent to the wavelength being used. This is a fundamental assumption made in the mathematical equations that describe how OTPAS finds thickness and refractive index values. If absorption is substantial enough that more than 1% of the incident light is absorbed by the film, characterization will not match the real thickness and refractive index values of the film.
Modifications to the EFPA technique can be made with relative ease and other types of components can be substituted in for more effective scans or functionality. The only major issues that have to be addressed when building an EFPA system are the following. First, it is crucial to have a method of automatically rotating a prism mount and acquiring acoustic signals at small (0.05 degree) increments. Second, having a nanosecond pulse width or shorter laser system to excite samples using the photoacoustic effect. Third, having a graphical user interface or program to acquire the data to do mathematical curve fitting and numerical derivatives for estimating thickness and bulk/thin film refractive index.
There are three fundamental limitations to EFPA. The first is that in order to find the bulk refractive index, thin film refractive index, thickness, or detect materials using TIRPAS, the sample must have a refractive index that is less than that of the prism or substrate it is in contact with so that total internal reflection can occur which is the basis of all three of these techniques. The second limitation is that EFPA currently requires physical contact in order to estimate thickness, refractive index, and for detection of properties. The final limitation is that OTPAS, a sub-technique of EFPA, currently requires optically transparent materials to estimate thickness and refractive index of the thin film of interest.
This type of consolidated instrument could find many applications in characterization environments including research cores and industrial environments. Future work regarding EFPA techniques is focused on the improvement of the refractive index accuracy through improvements in instrumentation and translational/rotational stages. Additional advancements will focus around the improvement of signal-to-noise ratio for the detection of smaller quantities of absorbing materials, so as to characterize weakly absorbing materials, as are found most commonly in biological systems.
披露声明
作者宣称,他们没有竞争的经济利益。
致谢
该项目由美国国家科学基金会brige是奖(1221019)的资助。
材料
| Name | Company | Catalog Number | Comments |
| 100 mm plano convex lens | Thorlabs | LA1509 | Plano convex lens for beam expander |
| -30 mm plano concave lens | Thorlabs | LC2679 | Plano concave lens for beam expander |
| 10 MHz Ultrasonic transducers | Harisonic | I31006T | Ultrasonic sensors used for photoacoustic detection, both for laser energy measurement and for OTPAS mount |
| Immersion oil Type A | Cargille | 16482 | Index of 1.519 to match that of NBK-7 substrates |
| Natural latex rubber sheet (red) | McMastercarr | 86085K11 | Index ~1.519 to match that of Type A immersion liquid to act as an optical absorber to measure optical tunneling and laser energy |
| Laser goggles | VERE | 53 | Used to protect eyes from laser light |
| Cage mounted non polarizing beam splitter cube | Thorlabs | CM1-BS013 | Split laser light so that one half can be measured and one half can be used for excitation |
| Cage mounted polarizing beam splitter cube | Thorlabs | CM1-PBS251 | Ensure light is polarized before being used for optical tunneling experiments |
| Graduated ring activated iris diaphragm | Thorlabs | SM1D12C | Cut beam down to a smaller size for alignment |
| Data acquisition card | National Instruments | USB-5133 | USB oscilloscope to acquire data |
| Stepper motor driver | National Instruments | MID-7604 | Stepper motor driver to drive stepper motors for angular spectra |
| Sherline XY stage (14”) | Sherline | 5600-CNC/5610-CNC | Sherline XY stage |
| 4-jaw self centering chuck | Sherline | 1076/1034 | Sherline rotational attachment |
| Right angle attachment | Sherline | 3701 | Right angle attachment to attach rotational mount |
| CNC rotary table | Sherline | 8730 | Rotary table for holding OTPAS prism/sample |
| Surelite I-20 laser system | Continuum | I-20 | Q-switched Nd:YAG laser for exciting samples |
| NBK-7 prism | Thorlabs | PS911 | Right angle prism for EFPA |
| Adjustable torque wrench | Tohnichi | RTD40Z | Adjustable torque wrench to equally tighten down the EFPA mount for each technique to 16.75 g/mm |
| Digital level | Micromark | 84519 | Digital level to ensure EFPA prism holder starts at 0 degree. |
参考文献
- Byrappa, K., Kumar, B. V. S. Characterization of zeolites by infrared spectroscopy. Asian J Chem. 19 (6), 4933-4935 (2007).
- Coquil, T., Richman, E. K., Hutchinson, N. J., Tolbert, S. H., Pilon, L. Thermal conductivity of cubic and hexagonal mesoporous silica thin films. J Appl Phys. 106 (3), 034910 (2009).
- Courjon, D. . Near-Field Microscopy and Near-Field Optics. , (2003).
- Dultsev, F. N. Investigation of the microporous structure of porous layers using ellipsometric adsorption porometry. Thin Solid Films. 458 (1-2), 137-142 (2004).
- Goldschmidt, B. S. . Photoacoustic Evaluation of Surfaces via Pulsed Evanescent Field Interaction. , (2014).
- Goldschmidt, B. S., et al. Characterization of MgF2 thin films using optical tunneling photoacoustic spectroscopy. Opt Laser Technol. 73, 146-155 (2015).
- Junno, T., Anand, S., Deppert, K., Montelius, L., Samuelson, L. Contact mode atomic force microscopy imaging of nanometer-sized particles. Appl Phys Lett. 66 (24), 3295 (1995).
- Kang, T., Oh, S., Hong, S., Moon, J., Yi, J. Mesoporous silica thin films as a spatially extended probe of interfacial electric fields for amplified signal transduction in surface plasmon resonance spectroscopy. Chem Commun. (28), 2998-3000 (2006).
- Kresge, C. T., Leonowicz, M. E., Roth, W. J., Vartuli, J. C., Beck, J. S. Ordered mesoporous molecular sieves synthesized by a liquid-crystal template mechanism. Nature. 359 (6397), 710-712 (1992).
- Lew, C. M., Cai, R., Yan, Y. Zeolite Thin Films: From Computer Chips to Space Stations. Acc Chem Res. 43 (2), 210-219 (2010).
- Marchand, D. J., Hsiao, E., Kim, S. H. Non-contact AFM imaging in water using electrically driven cantilever vibration. Langmuir. 29 (22), 6762-6769 (2013).
- Yamada, T., et al. Surface Photovoltage NO Gas Sensor with Properties Dependent on the Structure of the Self-Ordered Mesoporous Silicate Film. Adv Mater. 14 (11), 812-815 (2002).
- Harrick, N. J. Internal Reflection Spectroscopy. Harrick Scientific Corporation. , (1987).
- Splinter, R., Hooper, B. A. . An Introduction to Biomedical Optics (Optics and Optoelectronics). , (2006).
- Sathiyamoorthy, K., Joseph, J., Hon, C. J., Matham, M. V. . Proceedings of SPIE - The International Society for Optical Engineering. 8001, (2011).
- Hernandez, C. M., Murray, T. W., Krishnaswamy, S. Photoacoustic characterization of the mechanical properties of thin films. Appl Phys Lett. 80 (4), 691 (2002).
- Veldhuis, G. J., Parriaux, O., Hoekstra, H. J. W. M., Lambeck, P. V. Sensitivity enhancement in evanescent optical waveguide sensors. J Lightwave Technol. 18 (5), 677-682 (2000).
- Goldschmidt, B. S., et al. Photoacoustic measurement of refractive index of dye solutions and myoglobin for biosensing applications. Biomed Opt Express. 4 (11), 2463-2476 (2013).
- Hansma, P. K., et al. Tapping mode atomic force microscopy in liquids. Appl Phys Lett. 64 (13), 1738 (1994).
- Shen, Y. C., Zhang, S. Y., Jiang, Y. S., Zhu, R., Wei, Y. Angular resonance absorption spectra of Langmuir-Blodgett films studied by the photoacoustic technique. Thin Solid Films. 248 (1), 36-40 (1994).
- Inagaki, T., Motosuga, M., Arakawa, E. T., Goudonnet, J. P. Coupled surface plasmons in periodically corrugated thin silver films. Phys Rev B Condens Matter. 32 (10), 6238-6245 (1985).
- Negm, S., Talaat, H. Effect of intrinsic surface roughness and other decay processes on surface plasmon polariton resonance halfwidth. Ultrasonics Symposium. 1, 509-514 (1992).
- Hinoue, T., Murata, H., Kawabe, M., Yokoyama, Y. Effects of thermal diffusion and solvent materials on photoacoustic signals in total internal reflection technique. Anal Sci. 2 (5), 407-410 (1986).
- Xu, M., Zhang, S., Inagaki, T. Investigation of optical resonance absorption on bigratings by photoacoustic angular spectroscopy. Shengxue Xuebao/Acta Acustica. 25 (5), 440-444 (2000).
- Hinoue, T., Kawabe, M., Yokoyama, Y. Measurement of concentration profile of dye at glass-solution interface by photoacoustic spectrometry coupled with total internal reflection technique. Bull Chem Soc Jpn. 60 (10), 3811-3813 (1987).
- Iwasaki, T., Sawada, T., Kamada, H., Fujishima, A., Honda, K. Observation of semiconductor electrode-dye solution interface by means of fluorescence and laser-induced photoacoustic spectroscopy. J Phys Chem. 83 (16), 2142-2145 (1979).
- Rothenhausler, B., Rabe, J., Korpiun, P., Knoll, W. On the decay of plasmon surface polaritons at smooth and rough Ag-air interfaces: A reflectance and photo-acoustic study. Surf Sci. 137 (1), 373-383 (1984).
- Jiang, Y., Zhang, S., Shao, H., Yuan, C. Optical properties of Langmuir-Blodgett films investigated by a photoacoustic technique. Appl Opt. 34 (1), 169-173 (1995).
- Inagaki, T., Goudonnet, J. P., Royer, P., Arakawa, E. T. Optical properties of silver island films in the attenuated-total-reflection geometry. Appl Opt. 25 (20), 3635-3639 (1986).
- Talaat, H., Bucaro, J. A., Huang, W., Macdiarmid, A. G. Photoacoustic detection of plasmon surface polaritons in heavily doped polyacetylene films. Synth Met. 10 (4), 245-253 (1985).
- Jung, C. S., Park, G., Kim, Y. D. Photoacoustic determination of field enhancement at a silver surface arising from resonant surface plasmon excitation. Appl Phys Lett. 47 (11), 1165-1167 (1985).
- Inagaki, T., Nakagawa, Y., Arakawa, E. T., Aas, D. J. Photoacoustic determination of radiative quantum efficiency of surface plasmons in silver films. Phys Rev B. 26 (12), 6421-6430 (1982).
- Hinoue, T., Shimahara, Y., Yokoyama, Y. Photoacoustic observation of solid-liquid interface by means of total internal reflection technique. Chem Lett. 12 (2), 225-228 (1983).
- Hinoue, T., Shimahara, Y., Murata, H., Yokoyama, Y. Photoacoustic spectrometry by total internal reflection technique: Dependence of photoacoustic signal intensity on concentration and optical path. Bunseki kagaku. 33 (11), E459-E466 (1984).
- Hinoue, T., Murata, H., Yokoyama, Y. Photoacoustic spectrometry coupled with total internal reflection technique : Theory and experiment. Anal Sci. 2 (5), 401-406 (1986).
- Inagaki, T., Kagami, K., Arakawa, E. T. Photoacoustic study of surface plasmons in metals. Appl Opt. 21 (5), 949-954 (1982).
- Negm, S., Talaat, H., Pelzl, J. . Proceedings of the IEEE Ultrasonics Symposium. 2, 1259-1261 (1993).
- Talaat, H., Dardy, H. D. . Ultrasonics Symposium Proceedings. 2, 700-703 (1983).
- Royer, P., Goudonnet, J. P., Inagaki, T., Chabrier, G., Arakawa, E. T. Photoacoustic study of the optical absorption of oblate silver spheroids in attenuated-total-reflection geometry. Physica Status Solidi (a). 105 (2), 617-625 (1988).
- Abdallah, T., Negm, S., Talaat, H. Photoacoustic surface plasmon for the detection of nicotine. Egypt J Solids. 25 (2), 181-189 (2002).
- Negm, S., Talaat, H. Radiative and non-radiative decay of surface plasmons in thin metal films. Solid State Commun. 84 (1-2), 133-137 (1992).
- Negm, S., Talaat, H. Surface plasmon resonance halfwidths as measured using attenuated total reflection, forward scattering and photoacoustics. J Phys: Condens Matter. 1 (50), 10201-10205 (1989).
- Muessig, P. R., Diebold, G. J. Total internal reflectance optoacoustic spectroscopy. J Appl Phys. 54 (8), 4251 (1983).
- Sudduth, A. S. M., Goldschmidt, B. S., Samson, E. B., Whiteside, P. J. D., Viator, J. A. Total internal reflection photoacoustic detection spectroscopy. Progress in Biomedical Optics and Imaging. 7899, 78993E-78993E-78998 (2011).
- Goldschmidt, B. S., et al. Total internal reflection photoacoustic spectroscopy for the detection of beta-hematin. J Biomed Opt. 17 (6), 061212 (2012).
- Hinoue, T., Imamura, G., Yokoyama, Y. Study of the Adsorption Layer at the Glass-Dye Solution Interface by Variable Incidence-Angle Internal-Reflection Spectrometry. Bull Chem Soc Jpn. 66 (12), 3680-3685 (1993).
- Hinoue, T., Kawabe, M., Doi, S., Yokoyama, Y. Photoacoustic estimation of reflectivities at solid-liquid interfaces by using total internal reflection technique. Hyomen Kagaku. 10 (2), 129-134 (1989).
- Hinoue, T., Kawabe, M., Yokoyama, Y. Measurement of concentration profile of dye at glass-solution interface by photoacoustic spectrometry coupled with total internal reflection technique. Chem Soc Japan. 60, 3811-3813 (1987).
- Hinoue, T., Murata, H., Yokoyama, Y. Photoacoustic spectrometry coupled with total internal reflection technique: theory and experiment. Anal Sci. 2, 401-406 (1986).
- Kinney, J. B., Staley, R. H. Applications of photoacoustic spectroscopy. Annu Rev Mater Sci. 12, 295-321 (1982).
- McDonald, F. A., Wetsel, G. C. Generalized theory of the photoacoustic effect. J Appl Phys. 49 (4), 2313-2322 (1978).
- Rosencwaig, A. Photo-acoustic spectroscopy of solids. Rev Sci Instrum. 48 (9), 1133-1137 (1977).
- Jacques, S. L., Palthauf, G., Viator, J. A. Photoacoustic imaging in biological tissues with pulsed lasers. Ann Biomed Eng. 28 (Suppl. 1), S-39 (2000).
- Xu, M., Wang, L. V. Photoacoustic imaging in biomedicine. Rev Sci Instrum. 77 (4), 041101 (2006).
- Rosencwaig, A. Photoacoustic spectroscopy. Annu Rev Biophys Bioeng. 9, 31-54 (1980).
- Hess, P. . Photoacoustic, Photothermal and Photochemical Processes at Surfaces and in Thin Films. , (1989).
- Rosencwaig, A. . Photoacoustics and Photoacoustic Spectroscopy. , (1980).
- Rosencwaig, A. Theoretical aspects of photoacoustic spectroscopy. J Appl Phys. 49 (5), 2905-2910 (1978).
- Rosencwaig, A., Gersho, A. Theory of the photoacoustic effect with solids. J Appl Phys. 47 (1), 64-69 (1976).
- Holan, S. H., Viator, J. A. Automated wavelet denoising of photoacoustic signals for circulating melanoma cell detection and burn image reconstruction. Phys Med Biol. 53 (12), N227-N236 (2008).
- Viator, J. A. . Characterization of Photoacoustic Sources in Tissue Using Time Domain Measurements. , (2000).
- Viator, J. A., et al. Clinical testing of a photoacoustic probe for port wine stain depth determination. Lasers Surg Med. 30 (2), 141-148 (2002).
- Viator, J. A., et al. A comparative study of photoacoustic and reflectance methods for determination of epidermal melanin content. J Invest Dermatol. 122 (6), 1432-1439 (2004).
- Viator, J. A., Jacques, S. L., Prahl, S. A. Depth profiling of absorbing soft materials using photoacoustic methods. IEEE Journal of Selected Topics in Quantum Electronics. 5 (4), 989-996 (1999).
- Weight, R. M., Viator, J. A. Detection of circulating tumor cells by photoacoustic flowmetry. Methods Mol Biol. 1102, 655-663 (2014).
- Gutierrez-Juarez, G., et al. Detection of melanoma cells in vitro using an optical detector of photoacoustic waves. Lasers Surg Med. 42 (3), 274-281 (2010).
- McCormack, D., Bhattacharyya, K., Kannan, R., Katti, K., Viator, J. A. . Progress in Biomedical Optics and Imaging - Proceedings of SPIE. 7564, (2010).
- McCormack, D., Bhattacharyya, K., Kannan, R., Katti, K., Viator, J. A. Enhanced photoacoustic detection of melanoma cells using gold nanoparticles. Lasers Surg Med. 43 (4), 333-338 (2011).
- Hu, S., Maslov, K., Tsytsarev, V., Wang, L. V. Functional transcranial brain imaging by optical-resolution photoacoustic microscopy. J Biomed Opt. 14 (4), 040503-040503-040503 (2009).
- Viator, J. A., et al. Gold nanoparticle mediated detection of prostate cancer cells using photoacoustic flowmetry with optical reflectance. J Biomed Nanotechnol. 6 (2), 187-191 (2010).
- Bhattacharyya, K., et al. Gold Nanoparticle-Mediated Detection of Circulating Cancer Cells. Clin Lab Med. 32 (1), 89-101 (2012).
- Galanzha, E. I., Shashkov, E. V., Tuchin, V. V., Zharov, V. P. In vivo multispectral, multiparameter, photoacoustic lymph flow cytometry with natural cell focusing, label-free detection and multicolor nanoparticle probes. Cytometry Part A. 73A (10), 884-894 (2008).
- Viator, J. A., Choi, B., Ambrose, M., Spanier, J., Nelson, J. S. In vivo port-wine stain depth determination with a photoacoustic probe. Appl Opt. 42 (16), 3215-3224 (2003).
- Wang, L. V. Multiscale photoacoustic microscopy and computed tomography. Nature Photonics. 3 (9), 503-509 (2009).
- Rousseau, G., Gauthier, B., Blouin, A., Monchalin, J. P. Non-contact biomedical photoacoustic and ultrasound imaging. J Biomed Opt. 17 (6), 061217-061211-061217-061217 (2012).
- Hochreiner, A., Bauer-Marschallinger, J., Burgholzer, P., Jakoby, B., Berer, T. Non-contact photoacoustic imaging using a fiber based interferometer with optical amplification. Biomed Opt Exp. 4 (11), 2322-2331 (2013).
- Wang, Y., Li, C., Wang, R. K. Noncontact photoacoustic imaging achieved by using a low-coherence interferometer as the acoustic detector. Opt Lett. 36 (20), 3975-3977 (2011).
- McCormack, D., et al. Photoacoustic detection of melanoma micrometastasis in sentinel lymph nodes. J Biomech Eng. 131 (7), 074519 (2009).
- Weight, R. M., Viator, J. A., Dale, P. S., Caldwell, C. W., Lisle, A. E. Photoacoustic detection of metastatic melanoma cells in the human circulatory system. Opt Lett. 31 (20), 2998-3000 (2006).
- Swearingen, J. A., Holan, S. H., Feldman, M. M., Viator, J. A. Photoacoustic discrimination of vascular and pigmented lesions using classical and Bayesian methods. J Biomed Opt. 15 (1), (2010).
- Talbert, R. J., Holan, S. H., Viator, J. A. Photoacoustic discrimination of viable and thermally coagulated blood using a two-wavelength method for burn injury monitoring. Phys Med Biol. 52 (7), 1815-1829 (2007).
- Samson, E. B., et al. Photoacoustic spectroscopy of beta-hematin. Journal of Optics. 14 (6), 065302 (2012).
- Goudonnet, J. P., Inagaki, T., Arakawa, E. T., Ferrell, T. L. Angular and polarization dependence of surface-enhanced Raman scattering in attenuated-total-reflection geometry. Phys Rev B. 36 (2), 917-921 (1987).
- Inagaki, T., Kagami, K., Arakawa, E. T. Photoacoustic observation of nonradiative decay of surface plasmons in silver. Phys Rev B. 24 (6), 3644-3646 (1981).
- Ruddy, V., MacCraith, B. D., Murphy, J. A. Evanescent wave absorption spectroscopy using multimode fibers. J Appl Phys. 67 (10), 6070-6074 (1990).
- Gupta, B. D., Singh, C. D. Fiber-optic evanescent field absorption sensor: A theoretical evaluation. iber Integr Opt. 13 (4), 433-443 (1994).
- Court, I. N., von Willisen, F. K. Frustrated Total Internal Reflection and Application of Its Principle to Laser Cavity Design. Appl Opt. 3 (6), 719-726 (1964).
- Suter, J. D., Sun, Y., Howard, D. J., Viator, J. A., Fan, X. . Proceedings of SPIE - The International Society for Optical Engineering. 7056, (2008).
- DeGrandpre, M. D., Burgess, L. W. Long path fiber-optic sensor for evanescent field absorbance measurements. Anal Chem. 60 (23), 2582-2586 (1988).
- Sun, Y., et al. Optofluidic ring resonator sensors for rapid DNT vapor detection. Analyst. 134 (7), 1386-1391 (2009).
- Mukundan, H., et al. Waveguide-Based Biosensors for Pathogen Detection. Sensors. 9 (7), 5783-5809 (2009).
- Gohring, J. T., Dale, P. S., Fan, X. Detection of HER2 breast cancer biomarker using the opto-fluidic ring resonator biosensor. Sensors and Actuators B: Chemical. 146 (1), 226-230 (2010).
- Sai, V. V. R., et al. Label-free fiber optic biosensor based on evanescent wave absorbance at 280nm. Sensors Actuators B: Chem. 143 (2), 724-730 (2010).
- Wang, F., Anderson, M., Bernards, M. T., Hunt, H. K. PEG Functionalization of Whispering Gallery Mode Optical Microresonator Biosensors to Minimize Non-Specific Adsorption during Targeted, Label-Free Sensing. Sensors (Basel). 15 (8), 18040-18060 (2015).
- Leung, A., Shankar, P. M., Mutharasan, R. A review of fiber-optic biosensors. Sensors Actuators B: Chem. 125 (2), 688-703 (2007).
- Saavedra, S. S., Reichert, W. M. Integrated optical attenuated total reflection spectrometry of aqueous superstrates using prism-coupled polymer waveguides. Anal Chem. 62 (20), 2251-2256 (1990).
- Cargille Labs. . Cargille Microscope Immersion Oils. , (2015).
- Stineman, R. W. A Consistently Well-Behaved Method of Interpolation. Creat. Comp. , 54-57 (1980).
转载和许可
请求许可使用此 JoVE 文章的文本或图形
请求许可探索更多文章
This article has been published
Video Coming Soon
版权所属 © 2025 MyJoVE 公司版权所有,本公司不涉及任何医疗业务和医疗服务。