Method Article
协议塑料微粒采样的海面和样品分析
摘要
以下协议描述的方法:海面上的塑料微粒采样,颗粒的微型和化学鉴定分离。该协议是由MSFD技术小组对海洋垃圾公布了塑料微粒监测的建议。
摘要
Microplastic pollution in the marine environment is a scientific topic that has received increasing attention over the last decade. The majority of scientific publications address microplastic pollution of the sea surface. The protocol below describes the methodology for sampling, sample preparation, separation and chemical identification of microplastic particles. A manta net fixed on an »A frame« attached to the side of the vessel was used for sampling. Microplastic particles caught in the cod end of the net were separated from samples by visual identification and use of stereomicroscopes. Particles were analyzed for their size using an image analysis program and for their chemical structure using ATR-FTIR and micro FTIR spectroscopy. The described protocol is in line with recommendations for microplastics monitoring published by the Marine Strategy Framework Directive (MSFD) Technical Subgroup on Marine Litter. This written protocol with video guide will support the work of researchers that deal with microplastics monitoring all over the world.
引言
Microplastic pollution in the sea represents a growing concern to contemporary society, due to the constant increase in plastic production and its subsequent disposal and accumulation in the marine environment1. Even if plastic macro litter would no longer enter the seas, microplastic pollution would continue to grow due to fragmentation of already existing plastic litter in the sea2. The majority of microplastic pollution studies were carried out in marine and fresh water ecosystems and mainly addressed sea surface pollution3.
The term microplastic refers to plastic particles smaller than 5 mm in size4. This term describes a heterogeneous mixture of particles, which can differ in size (from a few microns to several millimeters), color and shape (from very different shapes of fragments to long fibers). Microplastic particles can be of a primary or secondary origin5. Microplastic of primary origin is manufactured as small particles used in the cosmetics industry (pilling crème etc.) or chemical industry as precursor for other plastic products (e.g. plastic pellets used in plastic industry). Microplastic of secondary origin arise via the degradation of larger plastic pieces in the environment due to physical and chemical processes, induced by light, heat, oxygen, water and organisms6. In 2015, four types of microplastic sources were defined: larger plastic litter, cleaning products, medicines and textiles6. The main source (80 %) of larger plastic litter is assumed to be land based7. Microplastic from cosmetic products, medicines and textile enters water ecosystems through sewage and storm waters6. Microplastic particles most frequently found in water ecosystems are fragments from larger plastic litter and textile fibers8.
Microplastics have several negative effects on the environment. Their small size allows them to enter the food web through ingestion by marine organisms9, 10. Ingested particles can cause physical damage or block the digestive system of animals11. Particles can also be carriers of persistent organic pollutants (POPs). Their hydrophobic surface and favorable ratio of large surface area to small volume, enables POPs to adsorb onto the microplastics12. In the environment or digestive systems of animals who ingest them, POPs and other plastic additives can be leached from microplastic particles13.
Previous studies reported the ubiquitous presence of microplastics in the marine environment3, from the water column to the bottom sediments. The threat of microplastic pollution was already identified by the Marine Strategy Framework Directive in the EU and, consequently, mandatory monitoring of microplastics was advised14. Accordingly, the EU Technical Subgroup on Marine Litter (TSG-ML) prepared recommendations for monitoring of microplastics in the European seas15. Thus, the video guidelines for microplastics sampling are of high importance, as they support comparative monitoring and a coherent management process all over the world.
This protocol was developed within the DeFishGear project for the first monitoring of microplastic pollution in the Adriatic Sea. Recommendations from the document "Guidance on Monitoring of Marine Litter in European Seas" by TSG-ML15 were taken into account. This protocol describes the methodology for microplastics sampling on the sea surface, separation of microplastics from the samples, and chemical analysis of microplastic particles to confirm that particles are from plastic material and to identify the type of plastic. Sampling was done by the use of a manta net, which is the most suitable equipment for sampling in calm waters16. Separation of microplastics from the samples was carried out by visual identification using a stereomicroscope. Isolated particles were later chemically identified using Fourier transform infrared (FTIR) spectroscopy and micro FTIR spectroscopy.
研究方案
1.海面上的塑料微粒采样
- 部署使用用线和登顶三角帆景气或»A型架«船只侧面的蝠鲼网。
- 为了防止收集受尾区域内的湍流水 - (从船上4米距离约3)部署蝠净出唤醒区。
- 写在数据表中的初始GPS坐标和初始时间。
- 开始在一条直线方向约7倍的速度移动。 2 - 3节的30分钟,开始时间测量。
- 30分钟后停止了船,写下最后的GPS坐标,路线长度(最正确的方法是计算从GPS坐标的长度),平均船速到所提供的数据表和解除曼塔净出水中。
- 从海水中网采用从船上WA潜水泵或水外彻底清洗净曼塔之三水库。冲洗从曼塔嘴鳕鱼端的方向,以集中附着在网成鳕鱼结束所有粒子。
注意:不要通过网络,以防止污染开幕冲洗样本。 - 安全删除鳕鱼端和筛在鳕鱼样品通过一条300微米的筛孔尺寸筛或更少结束。
- 从外部彻底冲洗鳕端,并通过筛倾倒样品的其余部分。直到不再有鳕结束内部的任何颗粒重复此步骤。
- 集中在筛上的所有材料在筛中的一个组成部分。
- 与使用漏斗,冲洗筛入,用70%乙醇的玻璃瓶或塑料瓶。
- 关闭瓶,用纸巾擦拭,并贴上标签的盖子和样品名称和日期防水标志的jar之外(你也应该把对帆纸上用铅笔写了第二个标签在一个罐子里,以避免可能的损失的由于在罐子擦除标签样品名称)。转移标记塑料瓶放入冷藏箱。
注意:一般取样条件:风速不应超过2博福特,因为海浪过高,净是不是海面稳定。在拖网期间保持在恒定速度的平稳线性当然是很重要的。曼塔网开放一半应取样过程中浸没。采样的持续时间应为30分钟(在情况下,有大量的天然材料,如浮游生物,采样的持续时间可以更短)。避免使用塑料工具和容器。避免合成布(如羊毛),绳索和与容器蝠净的接触,以防止样品污染。要非常小心,不要损坏蝠网或船体,同时部署和捕捉网。
2.分离塑料微粒从海面样本
- 如果样品中不包含大于25毫米的任何产品,似乎是干净的,直接与第3步继续。
- 倾通过筛(≤300微米筛目大小)样品,并删除从样品尺寸> 5毫米(宏和女中音屑)所有的天然或人造的垫料的目的,使用视觉识别和镊子。小心用蒸馏水,以去除附着在任何的微型垃圾仔细冲洗去除每个对象。存放在单独的容器中所有的天然和人造垃圾对象。干燥在干燥器(或在开放的空气,但在一个封闭的培养皿)中的所有天然和人工垫料对象和称重它们。确定根据项目凋落16的类别的主列表中的所有垃圾对象> 25毫米(宏屑)。
- 删除所有较大的物体后,集中所有剩余部分用喷瓶或自来水筛的一部分。用70%的乙醇的最小量与funn的帮助下将样品倒入玻璃容器埃尔。
注:在这一步骤中使用70%的乙醇的关键是要保持样品。此外,在样品的目视检查的步骤,乙醇有助于变色生物体多彩塑料因此变得更容易找到。 - 取样品(子样本)少量,倒入玻璃培养皿。与使用立体显微镜的分析样品(20 - 80倍变焦)并搜索微型塑料颗粒。
- 每个微型塑料粒子应归类到在表1中列出的类别之一,并放入培养皿或其它玻璃小瓶中,标有一个类别名称。培养皿需要在任何时候都被关闭。
注意:当您的样品中分离塑料微粒是保守的,并选择更多,而不是分析更小的颗粒。颗粒的实际化学结构仍将稍后确定。一定要分析来自各方的更大的物体如塑料微粒可能被卡住,因此较大的项目下隐藏。它也可能是有用的已经分析对象移到培养皿的一侧。 - 把培养皿测量设备(由千分尺滑或图像分析软件校准目镜尺),在显微镜下,测量各颗粒的尺寸(测量最长的对角线),除长丝,并记下其颜色。每个子样本应该由其他人进行审查。小心冲洗含有样品,使附着在玻璃墙的所有粒子洗净,放入培养皿玻璃容器。
- 分别通过使用分析级的权衡每个类别的微型塑料颗粒。微型塑料颗粒需要事先称量待干燥。封闭培养皿可以放入一个干燥器或样品可以放置干燥在一个封闭的培养皿直到颗粒变得干燥(封闭培养皿的带颗粒的重量为常数)。
- 确定微型垃圾。在分析搜索塑料微粒的样本,请考虑一些颗粒会轻易可见(颜色,形状,尺寸),而另一些可能是棘手找到。下面是确定样品中的微型颗粒的几个特点:比如,没有细胞结构,参差不齐,尖锐,边缘弯曲,粗细均匀,颜色鲜明(蓝,绿,黄等)。
3.塑料微粒的化学鉴定
- ATR-FTIR光谱
- 在分析之前用酒精清洁无绒布检测系统。
- 记录背景光谱。放置在样品架中样品和收集的光谱。用与数据库中的光谱所得到的频谱的一个自动化比较识别所获得的ATR- FTIR光谱。
- 微ATR-FTIR光谱
- 在分析之前用酒精清洁无绒布检测系统。
- 放置在玻璃过滤器的样品。注:其他滤镜可我们ED但他们的聚合物性质可以表征干扰。
- 将过滤器与自动扫描台样品,并使用操纵杆来定位样本。
- 记录的光学图像并标记的区域(例如,20 20微米),其中所述样品将被表征。
- 记录背景光谱。
- 放置在样品架中样品,并在预定位置收集的光谱。
- 用与数据库中的光谱所得到的频谱的一个自动化比较识别所获得的微ATR-FTIR光谱。
结果
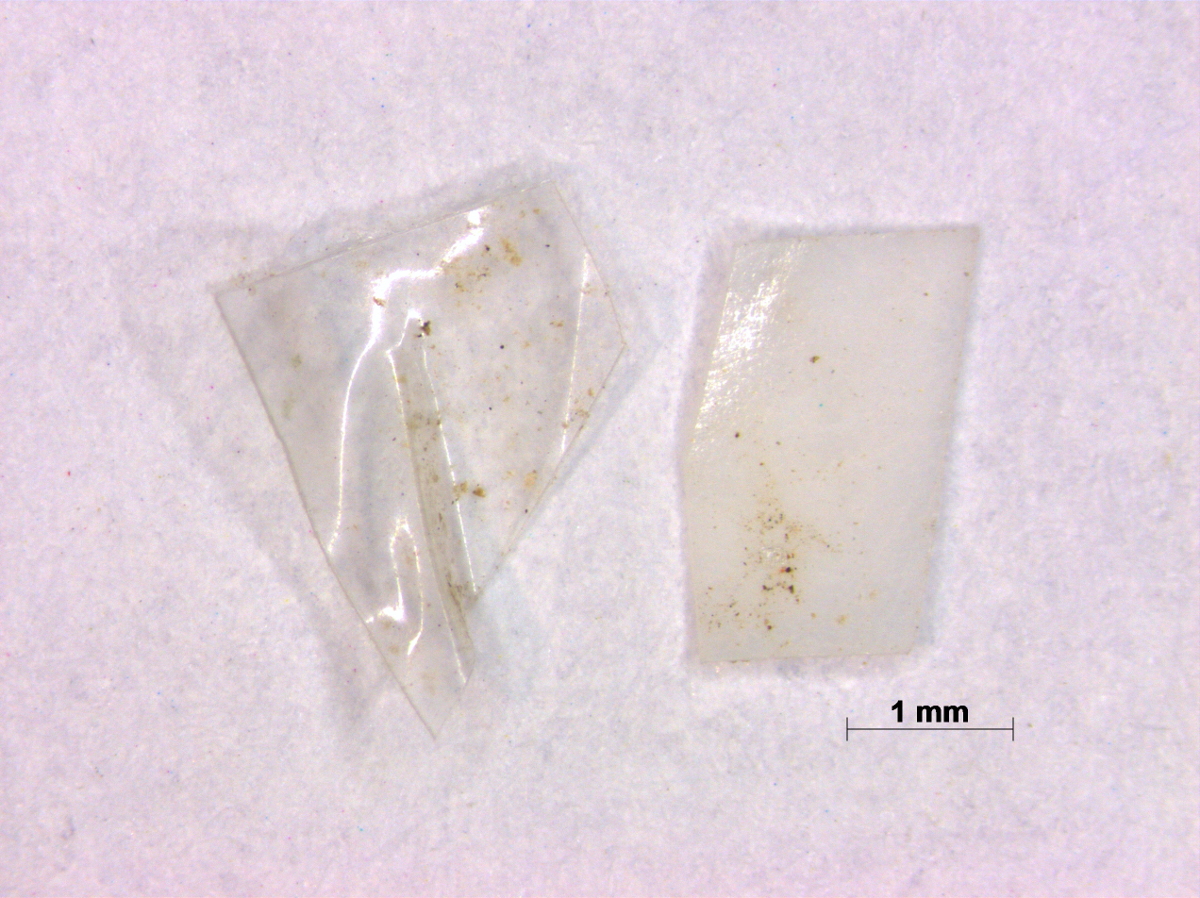
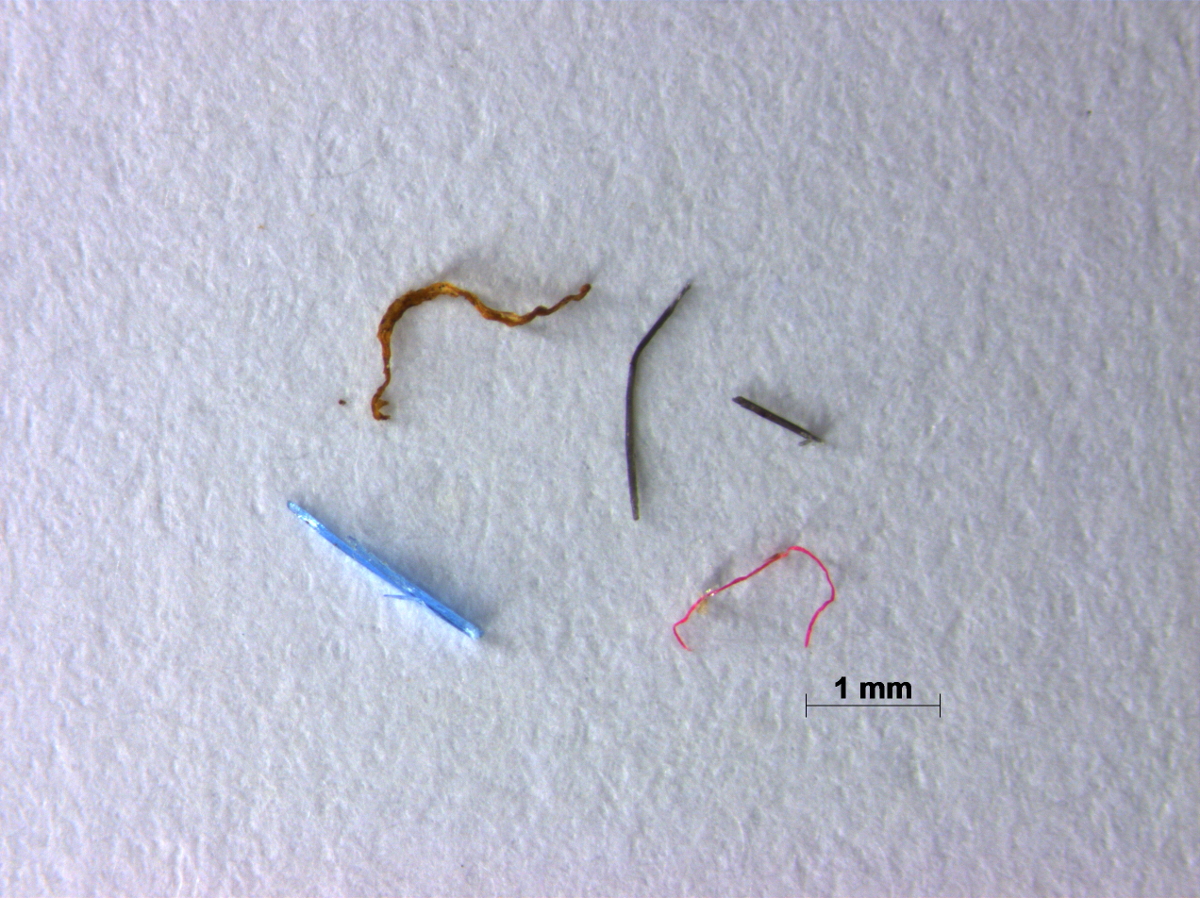
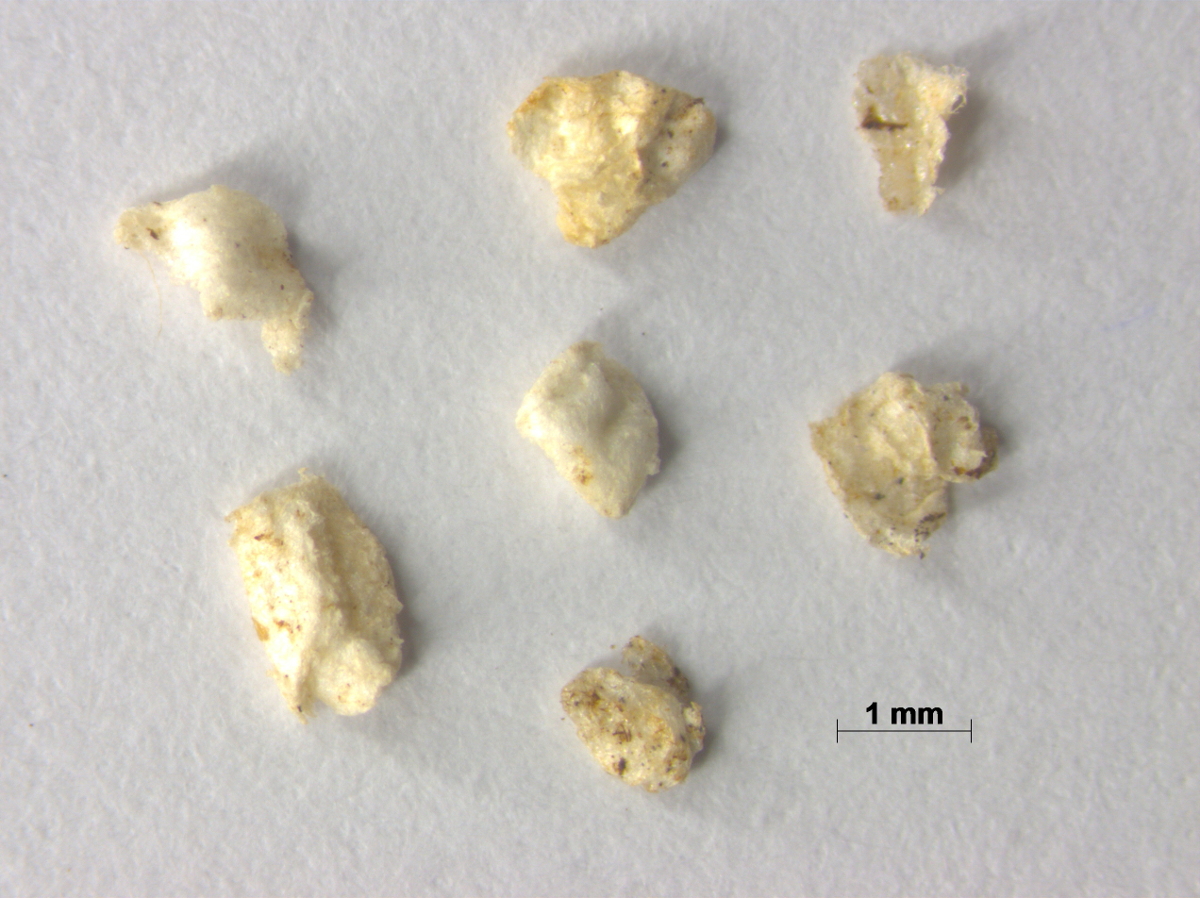
所描述的协议的第一个结果是根据其视觉特征(见表1)分为六类微型塑料颗粒。第一类,且通常是最丰富的,是片段(图1)。他们是刚性的,厚厚的,用锋利的边缘弯曲和不规则的形状。它们可以在各种不同的颜色。第二类是膜(图2)。他们同时出现在不规则形状,但与片段相比,他们很瘦,灵活,通常是透明的。第三类是颗粒(图3),一般从塑料工业始发。它们是不规则的,圆的形状,并且通常在尺寸更大,约5毫米的直径。它们通常是在一侧平坦,并且可以是各种颜色。第四类是颗粒(图4)。在与粒料相比较,它们具有规则圆形形状,并且通常更小的尺寸,大约1毫米的直径。它们出现在自然的色彩(白色,米色,褐色)。第五类是丝(图5)。它们是,毗邻的片段,最丰富的类型的微型颗粒。它们可以是短或长,具有不同的厚度和颜色。最后一类是泡沫(图6)。他们最常来自发泡胶的大颗粒。它们是柔软的,形状不规则和白色至黄色。
塑料微粒取样和样品分析的主要结果是每个样品的微型颗粒的数目。这些数据可以是每平方公里进一步规范。用于标准化的计算公式为:
每个样品/采样区域的微型颗粒,
(图;图7表2,3),其中取样区被由蝠净的开口的宽度采样距离乘以计算的。此外,颗粒可与即时进行分析年龄分析软件。结果包括每个粒子(表4)的最大长度和面积。图8a显示的图像分析之前颗粒和图8b是图像分析,其中每个粒子测量和编号之后。最后,建议每个样品颗粒的总或最高可能数量的化学分析。使用傅立叶变换红外光谱的选定颗粒的光谱获取,如图上图9这个频谱然后与从软件库(图10)的频谱进行比较。最后的结果将显示,如果一个给定的粒子是塑料或不与指示的塑料从化学结构的类型。
| 1 | 片段 |
| 2 | 电影 |
| 3 | 小球 |
| 4 | 颗粒 |
| 五 | 花丝 |
| 6 | 泡沫小号 |
表1:微型塑料颗粒的类别。

图1:片段:从类别颗粒的例子。 请点击此处查看该图的放大版本。

图2:电影:从类别颗粒的例子。 请点击此处查看该图的放大版本。
/55161fig3.jpg"/>
图3:颗粒:从类别颗粒的例子。 请点击此处查看该图的放大版本。

图4:从类颗粒的实施例:粒剂。 请点击此处查看该图的放大版本。

图5:从类颗粒的实施例:长丝。 请点击此处查看该图的放大版本。

图6:泡沫:从类别颗粒的例子。 请点击此处查看该图的放大版本。
| 采样距离[公里] | 2 |
| 曼塔宽度[公里] | 0.0006 |
| 取样面积[公里2] | 0.0012 |
表2:从调查数据,用于每平方公里的微型颗粒的计算的实施例 。
| 没有 | 无/ 平方公里 | |
| 片段 | 301 | 250833 |
| 影片 | 45 | 37500 |
| 小球 | 15 | 12500 |
| 颗粒 | 8 | 6667 |
| 泡沫 | 33 | 27500 |
| 花丝 | 223 | 185833 |
表3:从调查,其中该分类的数据分为6组进行计数和每公里 2 标准化结果的实施例 (没有-粒子数)。

图7:的对视觉分类后,代表性的结果示例文章(无 - 粒子数)。 请点击此处查看该图的放大版本。
| 区域指数 | 区域[平方毫米] | 最大长度(mm) |
| 1 | 8.010 | 5.506 |
| 2 | 10.517 | 5.628 |
| 3 | 12.185 | 5.429 |
| 4 | 3.367 | 3.367 |
| 五 | 2.475 | 2.155 |
| 6 | 1.809 | 2.943 |
| 7 | 6.604 | 5.238 |
| 8 | 5.779 | 4.037 |
| 9 | 4.472 | 3.791 |
| 10 | 16.907 | 5.355 |
| 11 | 7.246 | 3.733 |
| 12 | 7.867 | 4.622 |
| 13 | 64.11 | 5.056 |
| 14 | 3.281 | 3.070 |
| 15 | 12.937 | 5.554 |
| 16 | 6.709 | 3.716 |
表4:其中区域[毫米 2]和各颗粒的最大长度(mm)进行测量 的图像分析结果的实施例 。

图8:图像的实施例之前获得的a)和b)用图像分析软件颗粒图像分析后。ecsource.jove.com/files/ftp_upload/55161/55161fig8large.jpg"目标="_空白">点击此处查看该图的放大版本。

图9:对选定的颗粒测得的标记峰和它们的波长[-1]一个光谱的实施例。 请点击此处查看该图的放大版本。

图10:从选定的粒子从ATR-FTIR光谱库最佳匹配取得的频谱进行比较的例子。 请点击此处查看该F的放大版本igure。
讨论
由蝠净海面上塑料微粒采样为海面上塑料微粒的采样一种广泛使用的方法,但迄今还没有统一的方法。大体积的水可通过蝠网进行过滤,从而捕集塑料微粒的相关数的可能性高,结果被认为是可靠的。不同的样品中结果的可比性是通过规范化放心。在我们的情况下,该浓度通过由净开口的水平宽度拖网距离乘以相关的取样区。另一种选择是使用一个流量计,固定在网的开口。使用流量计是可能的,因为净曼塔其侧翼是海面上非常稳定,因此在跳浪是最小的。流量计记录的过滤水的体积,从而使每水样16卷结果的正常化。
最常用蝠网具有大约300微米的筛目大小和3 - 4.5米长。这些尺寸进行优化,以避免网的堵塞,并允许一定量的水的采样尽可能大。拖网速度推荐为介于2 - 结3,但它是依赖于波高度,风速和海流。这是很重要的,该蝠网是在监督下采样期间的全部时间,如果它开始跳频,在拖网速度必须减小。该拖网时间,建议大约30分钟,而是取决于悬浮物的浓度。它可能发生浮游物有时会堵塞蝠网。在这种情况下,拖网,必须立即停止,否则微型塑料颗粒可能丢失和净可能会损坏。蝠网是最经常从容器的侧面固定。这也是最合适的选择,而蝠鲼网肯定是出了醒区。在一些调查曼塔网从船的船尾固定17,18,但你必须要确保网是出来之后区域的情况下。的距离,在其上拖网设置为取样,应单独确定,因为所引起的容器湍流的区域从容器的尺寸和从船上19,20的速度而变化。
从海面样本的微型颗粒分离是最常见的视觉识别21刚刚完成。颗粒大于1毫米可以很容易地用肉眼识别,而颗粒小于1mm需要使用体视显微镜。以减少混淆非塑料颗粒与塑料的,使用上立体显微镜偏振的光的可能性,建议。塑料颗粒误认的可能性变得更小颗粒的高。由此颗粒> 0.5,MM可以仅通过使用立体显微镜来识别视觉上21。为颗粒小于0.5mm额外的,更精确的方法是必需的如微ATR-FTIR光谱仪21。
在塑料微粒分离来自样品的处理样品污染与空气长丝的可能性非常高。出于这个原因,控制悬空在工作台上培养皿强烈建议潜在的污染物空气中颗粒物的鉴定。即,数据的质量强烈依赖于:1)用样品,2)的质量和立体显微镜的放大倍数,以及3)的有机物质的量的样品16中工作的人的精度。视觉识别后,强烈建议进行分析排序的颗粒为材料8的化学鉴定可用的技术之一。
几种方法聚合物鉴定存在,其中FTIR光谱和拉曼光谱是最frequenTLY使用22。红外和拉曼光谱是互补的技术以及其准确性是相似的。在我们的协议中,红外光谱和显微红外光谱与"衰减全反射"(ATR)介绍。它们是使用简单,它们能够快速和准确的结果。塑料聚合物具有与不同的带图案高度特异性的红外(IR)光谱,从而使红外光谱的最佳技术用于塑料微粒21的识别。与样品,使特征IR光谱22的测量交互时的IR辐射的能量激励一个特定的分子的振动。红外光谱还可提供关于颗粒,如氧化23和降解24的水平的强度的额外信息。而ATR-FTIR适合较大颗粒的化学识别(> 0.5mm)的,微ATR-FTIR光谱可以提供关于颗粒&#的化学结构信息60 0.5毫米,因为它结合了显微镜和红外光谱仪的功能。
使用FTIR和微FTIR光谱之前,微型塑料颗粒必须预先干燥的,因为水强烈吸收IR辐射22,和纯化的,在情况下,它们都覆盖着生物膜和/或其它的有机和无机粘剂,其可以影响红外光谱。以纯化样品的大多数非侵入性的方式是通过搅拌,并用新鲜水25漂洗。如果这还不够,则建议使用30%的过氧化氢。所有其它的方法可对微型塑料颗粒的负面影响(如超声清洗可以进一步细分颗粒,强酸性或碱性溶液可能会损坏几个塑料聚合物等),因此不推荐使用。更有前途的是采用了连续酶促消化,为塑料友好纯化步骤。使用不同技术的酶纯化(例如脂肪酶,mylase,蛋白酶,几丁质酶,纤维素酶,蛋白酶K)已成功地应用于减少浮游生物的生物基质,从而被证明是一个有价值的技术,以尽量减少在红外光谱测量22矩阵文物。
通过视觉识别和选出的颗粒的化学鉴定塑料微粒的分离都非常耗时的过程。这项工作必须由一个准确和耐心的人谁具有立体显微镜,不仅在识别塑料粒子,而且在识别生物物质的经验来进行。即使是有经验的人无法从甲壳素或硅藻片段22歧视明确所有潜在的微型颗粒。因此,视觉分拣的误差率范围为20%26至70%21,并与减小粒径增大。
披露声明
The authors have nothing to disclose.
致谢
此协议的发展由IPA亚得里亚海跨境合作计划2007 - 2013年成立后,DeFishGear项目(1°STR / 00010)之内。
材料
| Name | Company | Catalog Number | Comments |
| In this protocol no specific equipment or reagents were used. | |||
参考文献
- Law, K. L., et al. Plastic accumulation in the North Atlantic subtropical gyre. Science. 329 (5996), 1185-1188 (2010).
- Thompson, R. C. Microplastics in the marine environment: Sources, consequences and solutions. Marine anthropogenic litter. , 185-200 (2015).
- Lusher, A. Microplastics in the marine environment: distribution, interactions and effects. Marine anthropogenic litter. , 245-307 (2015).
- Arthur, C., Baker, J., Bamford, H. . Proceedings of the International Research Workshop on the Occurrence, Effects, and Fate of Microplastic Marine Debris, September 9-11. , (2008).
- Andrady, A. L. Microplastics in the marine environment. Marine pollution bulletin. 62 (8), 1596-1605 (2011).
- Browne, M. A. Sources and pathways of microplastics to habitats. Marine anthropogenic litter. , 229-244 (2015).
- . Marine litter: an analytical overview. UNEP's REGIONAL SEAS PROGRAMME. , (2005).
- van der Wal, M., et al. . SFRA0025: Identification and Assessment of Riverine Input of (Marine) Litter, Final Report for the European Commission DG Environment under Framework Contract No ENV.D.2/FRA/2012/0025. , (2015).
- Setälä, O., Fleming-Lehtinen, V., Lehtiniemi, M. Ingestion and transfer of microplastics in the planktonic food web. Environmental pollution. 185, 77-83 (2014).
- Farrell, P., Nelson, K. Trophic level transfer of microplastic: Mytilus edulis. (L.) to Carcinus maenas (L). Environmental Pollution. 177, 1-3 (2013).
- Wright, S. L., Thompson, R. C., Galloway, T. S. The physical impacts of microplastics on marine organisms: a review. Environmental Pollution. 178, 483-492 (2013).
- Bakir, A., Rowland, S. J., Thompson, R. C. Transport of persistent organic pollutants by microplastics in estuarine conditions. Estuarine, Coastal and Shelf Science. 140, 14-21 (2014).
- Cole, M., Lindeque, P., Halsband, C., Galloway, T. S. Microplastics as contaminants in the marine environment: a review. Marine pollution bulletin. 62 (12), 2588-2597 (2011).
- Zarfl, C., et al. Microplastics in oceans. Marine Pollution Bulletin. 62, 1589-1591 (2011).
- Hanke, G., et al. . MSFD GES technical subgroup on marine litter. Guidance on monitoring of marine litter in European Seas. , (2013).
- Löder, M. G. J., Gerdts, G. Methodology used for the detection and indentification of microplastics - A critical appraisal. Marine anthropogenic litter. , 201-227 (2015).
- Kang, J. H., Kwon, O. Y., Lee, K. W., Song, Y. K., Shim, W. J. Marine neustonic microplastics around the southeastern coast of Korea. Marine pollution bulletin. 96 (1), 304-312 (2015).
- Lusher, A. L., Tirelli, V., O'Connor, I., Officer, R. Microplastics in Arctic polar waters: the first reported values of particles in surface and sub-surface samples. Scientific reports. 5, (2015).
- Shu, J. -. J. Transient Marangoni waves due to impulsive motion of a submerged body. International Applied Mechanics. 40 (6), 709-714 (2004).
- Rabaud, M., Moisy, F. Ship wakes: Kelvin or Mach angle. Physical Review Letters. 110 (21), 214503 (2013).
- Hidalgo-Ruz, V., Gutow, L., Thompson, R. C., Thiel, M. Microplastics in the marine environment: a review of the methods used for identification and quantification. Environmental science & technology. 46 (6), 3060-3075 (2012).
- Löder, M. G. J., Kuczera, M., Mintenig, S., Lorenz, C., Gerdts, G. Focal plane array detector-based micro-Fourier-transform infrared imaging for the analysis of microplastics in environmental samples. Environmental Chemistry. 12 (5), 563-581 (2009).
- Ioakeimidis, C., et al. The degradation potential of PET bottles in the marine environment: An ATR-FTIR based approach. Scientific reports. 6, 23501 (2016).
- McDermid, K. J., McMullen, T. L. Quantitative analysis of small-plastic debris on beaches in the Hawaiian archipelago. Marine pollution bulletin. 48 (7), 790-794 (2004).
- Eriksen, M., et al. Microplastic pollution in the surface waters of the Laurentian Great Lakes. Marine pollution bulletin. 77 (1-2), 177-182 (2013).
转载和许可
请求许可使用此 JoVE 文章的文本或图形
请求许可探索更多文章
This article has been published
Video Coming Soon
版权所属 © 2025 MyJoVE 公司版权所有,本公司不涉及任何医疗业务和医疗服务。