
红外光谱
Overview
资料来源: 加州大学欧文分校化学系 Vy 先生和陈先生
这项实验将演示红外 (IR) 光谱学 (也称为振动光谱学) 的使用, 以阐明一个未知化合物的身份识别的功能组 (s) 目前。红外光谱将使用衰减全反射 (ATR) 取样技术, 并在一个整洁的未知样品的红外光谱仪。
Principles
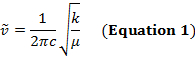
两个原子之间的共价键可以被认为是具有质量的两个对象, m1和m2与弹簧连接。自然, 这种键的拉伸和压缩具有一定的振动频率。此频率由公式 1给出, 其中 k是弹簧的力常数, c是光速, µ是减少的质量 (公式 2)。频率通常以 wavenumbers 表示, 以相反的厘米 (cm-1) 表达。
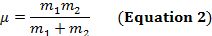
从公式 1中, 频率与弹簧的强度成正比, 与物体的质量成反比。因此, 由于氢是一个轻原子, 因此, c h、N h 和 o h 键的拉伸频率比 c-c 和 c o 键高。双和三重键可以被认为是更强的弹簧, 所以一个 c o 双键有一个更高的拉伸频率比一个 c o 单键。红外线是电磁辐射, 波长从 700 nm 到1毫米不等, 这与相对的键强度一致。当一个分子吸收红外光的频率等于共价键的固有振动频率时, 辐射产生的能量会增加键振动的振幅。如果电 (吸引电子的倾向) 在共价键中的两个原子是非常不同的, 电荷分离发生, 结果在一个偶极矩。例如, 在一个 C O 双键 (羰基) 中, 电子比碳原子花费更多的时间在氧原子上, 因为氧比碳更具负电。因此, 有一个净偶极矩, 导致在氧气部分负电荷和部分正电荷碳。另一方面, 对称炔烃没有一个净偶极矩, 因为两个单独的偶极矩在两边相互抵消。当键拉伸或压缩时, 红外吸收的强度与偶极矩的变化成正比。因此, 一个羰基的拉伸将在 IR 中显示一个强波段, 对称的内部炔烃将显示一个小的, 如果不是隐形的, 用于拉伸 c-c 三重键的带 (图 1)。表 1显示了一些特征的吸收频率。图 2显示了 Hantzsch 酯的红外光谱。请注意, 对于羰基基团, 在3343厘米-1处的峰值为 n-H 单键, 峰值为1695厘米-1 。在这个实验中, 使用 atr 取样技术, 其中红外光反射的样品与 atr 晶体多次接触。通常使用高折射率的材料, 如锗和硒化锌。这种方法使人能够直接检查固体或液体分析, 无需进一步的准备。
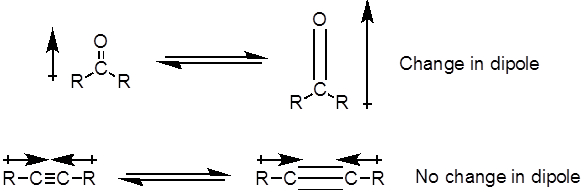
图1。图中显示了 c-O 双和 c-C 三键拉伸和在偶极矩中产生的变化.
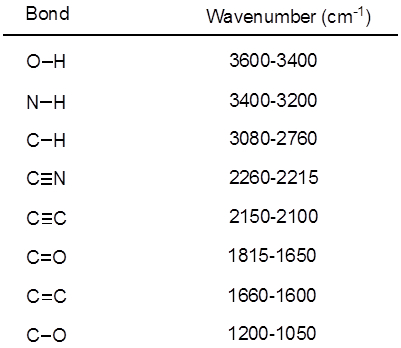
表1。有机分子中存在共价键的红外频率特征。
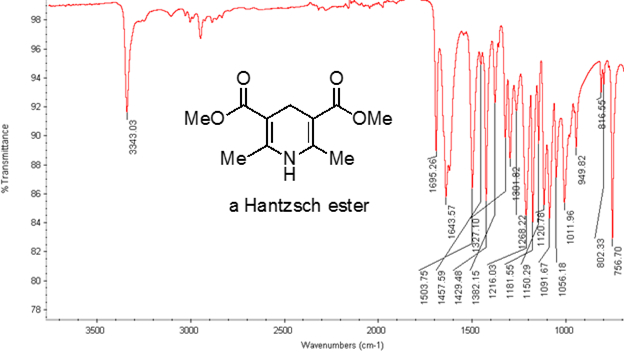
图2。Hantzsch 酯的红外光谱。
Procedure
- 打开红外线光谱仪, 让它预热。
- 从讲师处获取一个未知的样本, 并记录该样本的字母和外观。
- 收集背景光谱。
- 使用金属刮刀, 将少量的样品放在探头下面。
- 旋转探头直到它锁定到位。
- 记录未知样品的红外光谱。
- 如有必要, 重复, 以获得良好的质量频谱。
- 记录所呈现的功能组的吸收频率。
- 用丙酮清洗探头。
- 关掉光谱仪
- 分析得到的频谱。图 3显示了未知示例的可能候选项。说明未知样本的可能识别。

图 3。显示未知的可能标识的图。
Results
表 2: 所列化合物的外观和观察到的 IR 频率图 3。
| 复合编号 | 1 | 2 | 3 | 4 | 5 | 6 | 7 | 8 | 9 | 10 |
| 外观 | 清液 | 白色固体 | 清液 | 清液 | 清液 | 清液 | 黄色液体 | 白色固体 | 白色固体 | 清液 |
| 观察到的频率 (cm-1) | 1691, 1601, 1450, 1368, 1266 |
2773, 2730, 1713, 1591, 1576 |
2940, 2867, 1717, 1422, 1347 |
3026, 2948, 2920, 1605, 1496 |
2928, 2853, 1450, 904, 852 |
3926, 3315, 2959, 2120, 1461 |
3623, 3429, 3354, 2904, 1601 |
3408, 3384, 3087, 1596, 1496 |
3226, 2966, 1598, 1474, 1238 |
3340, 2959, 2861, 1468, 1460 |
Application and Summary
在这个实验中, 我们已经证明了如何识别一个未知的样本基于其特征的红外光谱。不同的功能组给出不同的伸展频率, 这使得功能基团的识别成为现实。
如本实验所示, IR 光谱学是有机化学家识别和表征分子的有用工具。除了有机化学之外, 红外光谱在其他领域也有很好的应用。在制药工业中, 该技术用于药物的定量和定性分析。在食品科学中, 红外光谱用于研究脂肪和油脂。最后, 红外光谱用于测量温室气体的组成,即、co2、co、CH4和 N2O, 以了解全球气候变化。
Tags
跳至...
此集合中的视频:

Now Playing
红外光谱
Organic Chemistry II
215.6K Views

清洁玻璃器皿
Organic Chemistry II
123.8K Views

亲核替代
Organic Chemistry II
99.6K Views

还原剂
Organic Chemistry II
43.1K Views

氏反应
Organic Chemistry II
149.2K Views

n-丁基滴定
Organic Chemistry II
48.0K Views

院长-斯塔克陷阱
Organic Chemistry II
100.6K Views

烯烃臭氧
Organic Chemistry II
67.1K Views

催化
Organic Chemistry II
16.9K Views

钯催化交联
Organic Chemistry II
34.6K Views

固相合成
Organic Chemistry II
41.2K Views

氢
Organic Chemistry II
49.7K Views

聚合
Organic Chemistry II
94.5K Views

熔点
Organic Chemistry II
150.0K Views

旋
Organic Chemistry II
100.2K Views
版权所属 © 2025 MyJoVE 公司版权所有,本公司不涉及任何医疗业务和医疗服务。