All
Research
Education
Business
Solutions
EN
EN - English
CN - 中文
DE - Deutsch
ES - Español
KR - 한국어
IT - Italiano
FR - Français
PT - Português
TR - Türkçe
JA - 日本語
PL - Polski
RU - Русский
HE - עִברִית
AR - العربية
Sign In
Chapter 8
The accurate values of population parameters such as population proportion, population mean, and population standard deviation (or variance) are usually ...
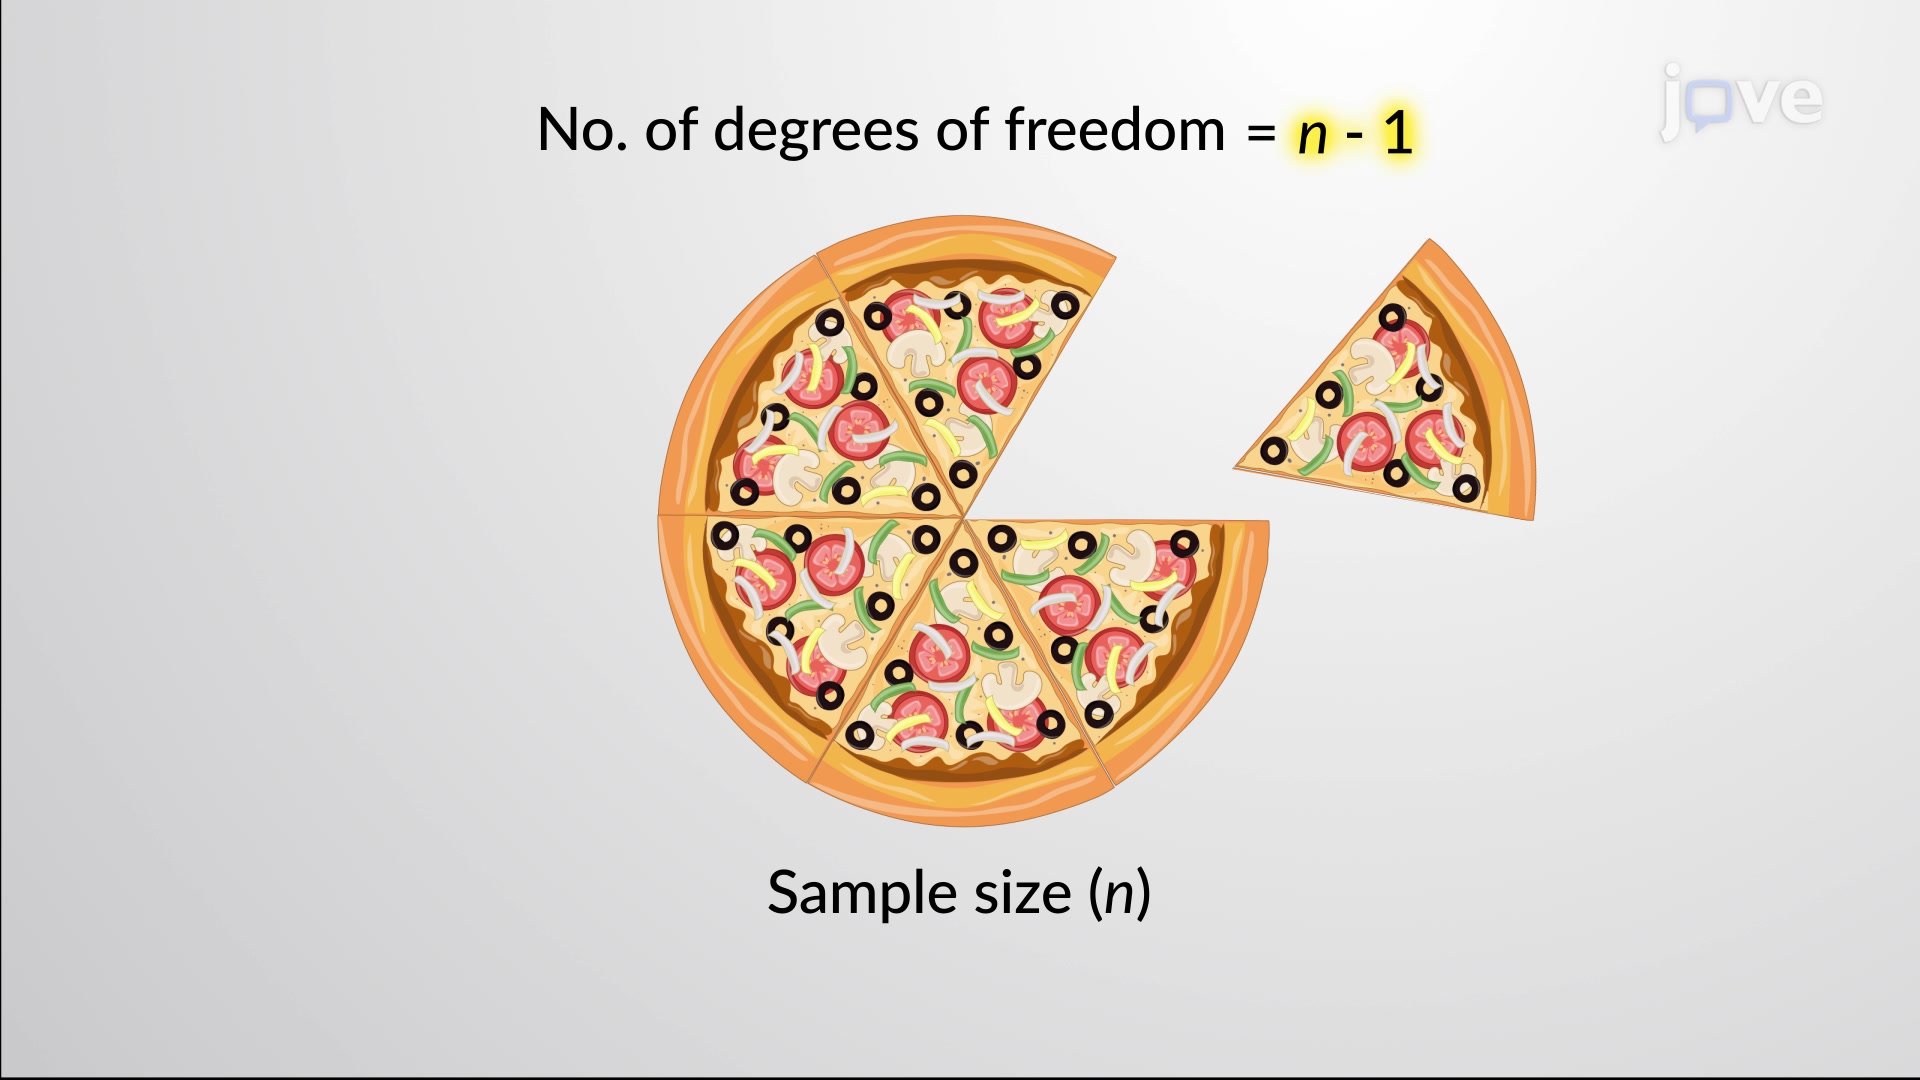
The degree of freedom for a particular statistical calculation is the number of values that are free to vary. Thus, the minimum number of independent ...
The population standard deviation is rarely known in many day-to-day examples of statistics. When the sample sizes are large, it is easy to estimate the ...
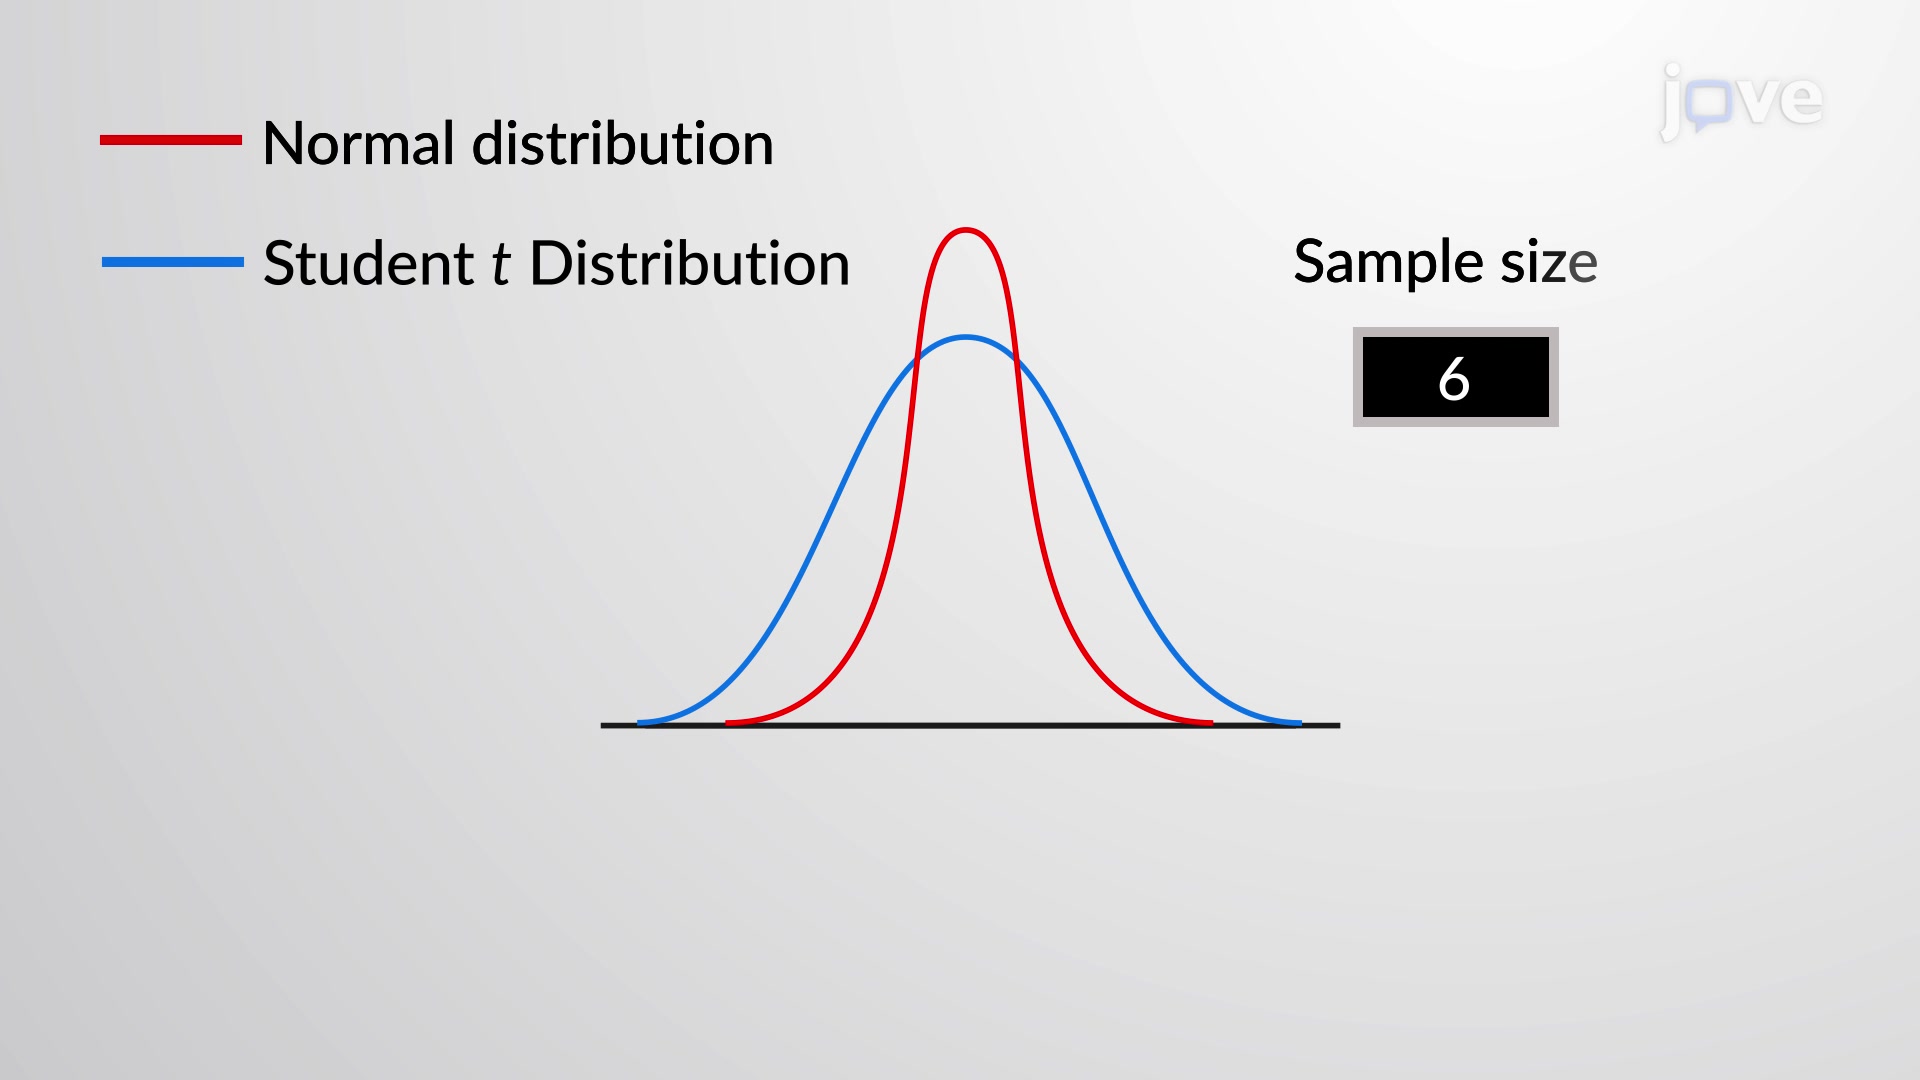
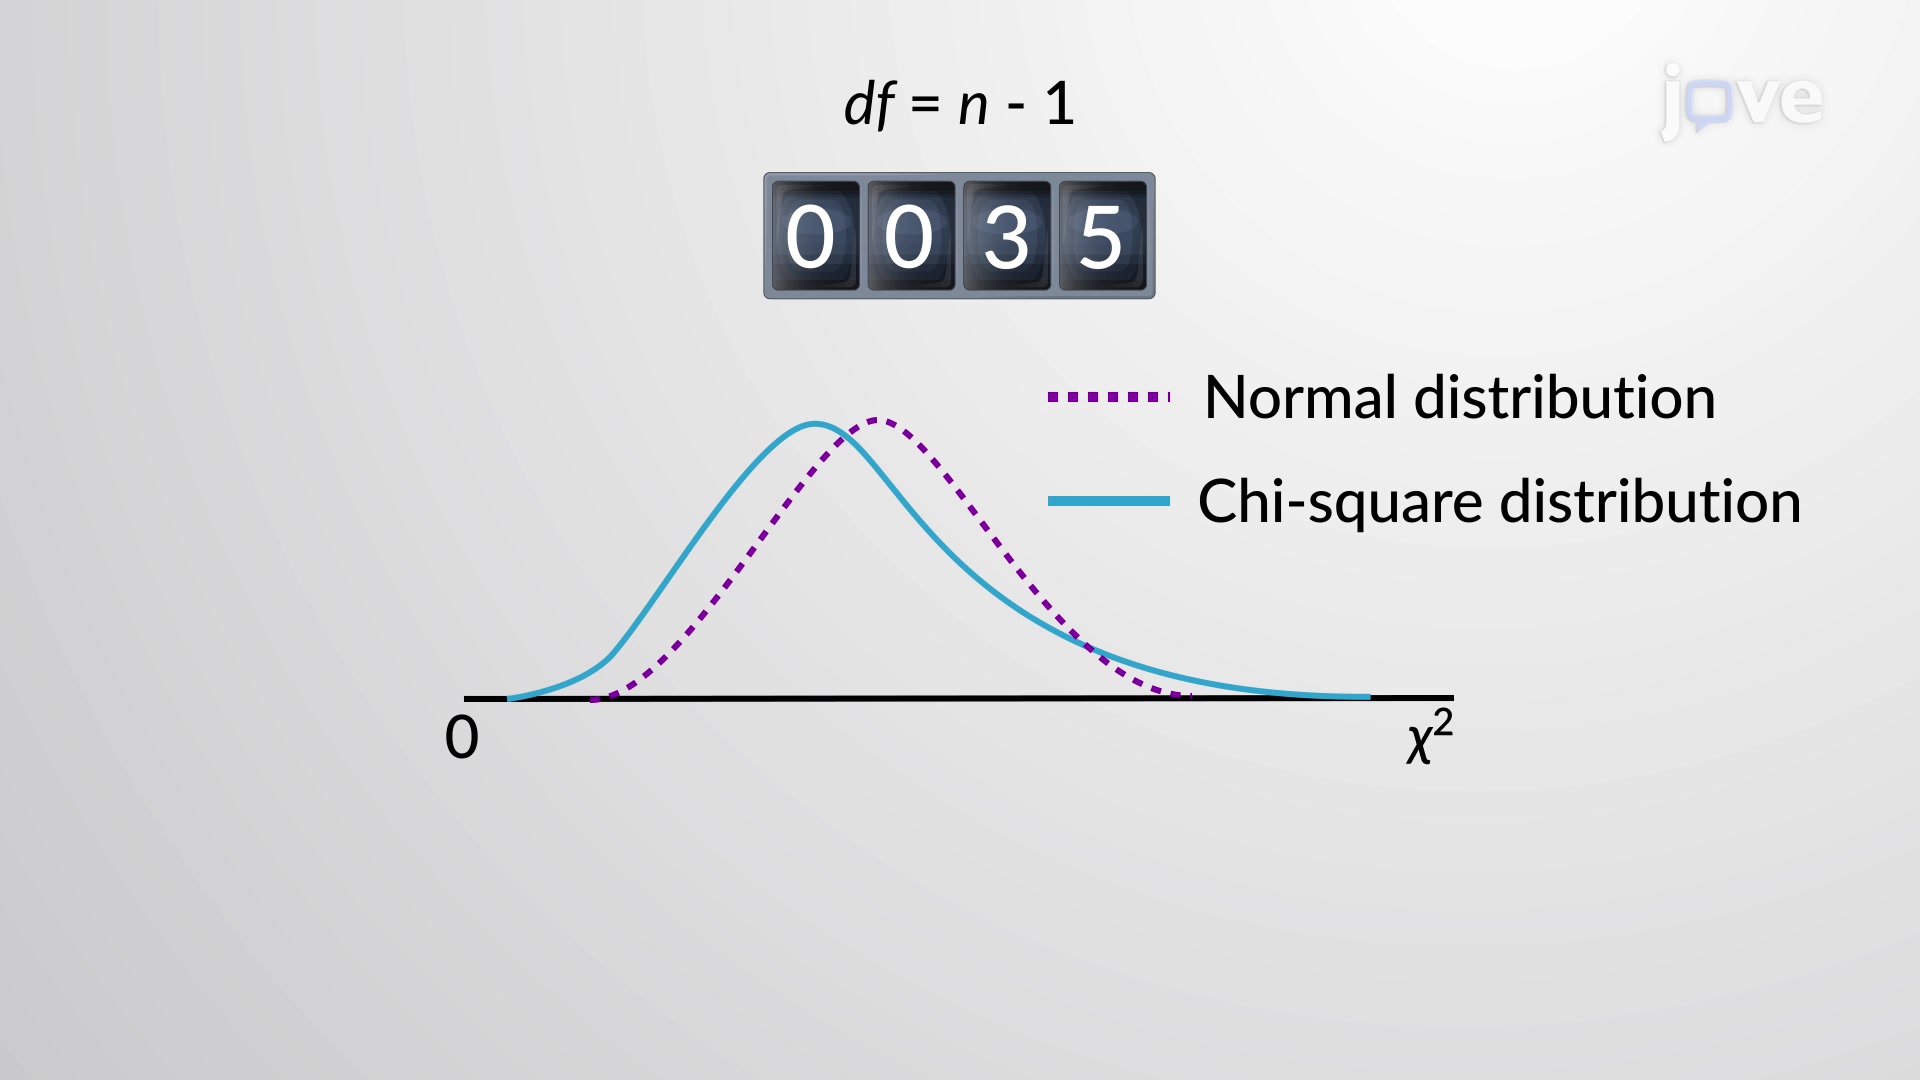
The z and the Student t distribution estimate the population mean using the sample mean and standard deviation. However, to decide which distribution to ...
How does one determine if bingo numbers are evenly distributed or if some numbers occurred with a greater frequency? Or if the types of movies people ...
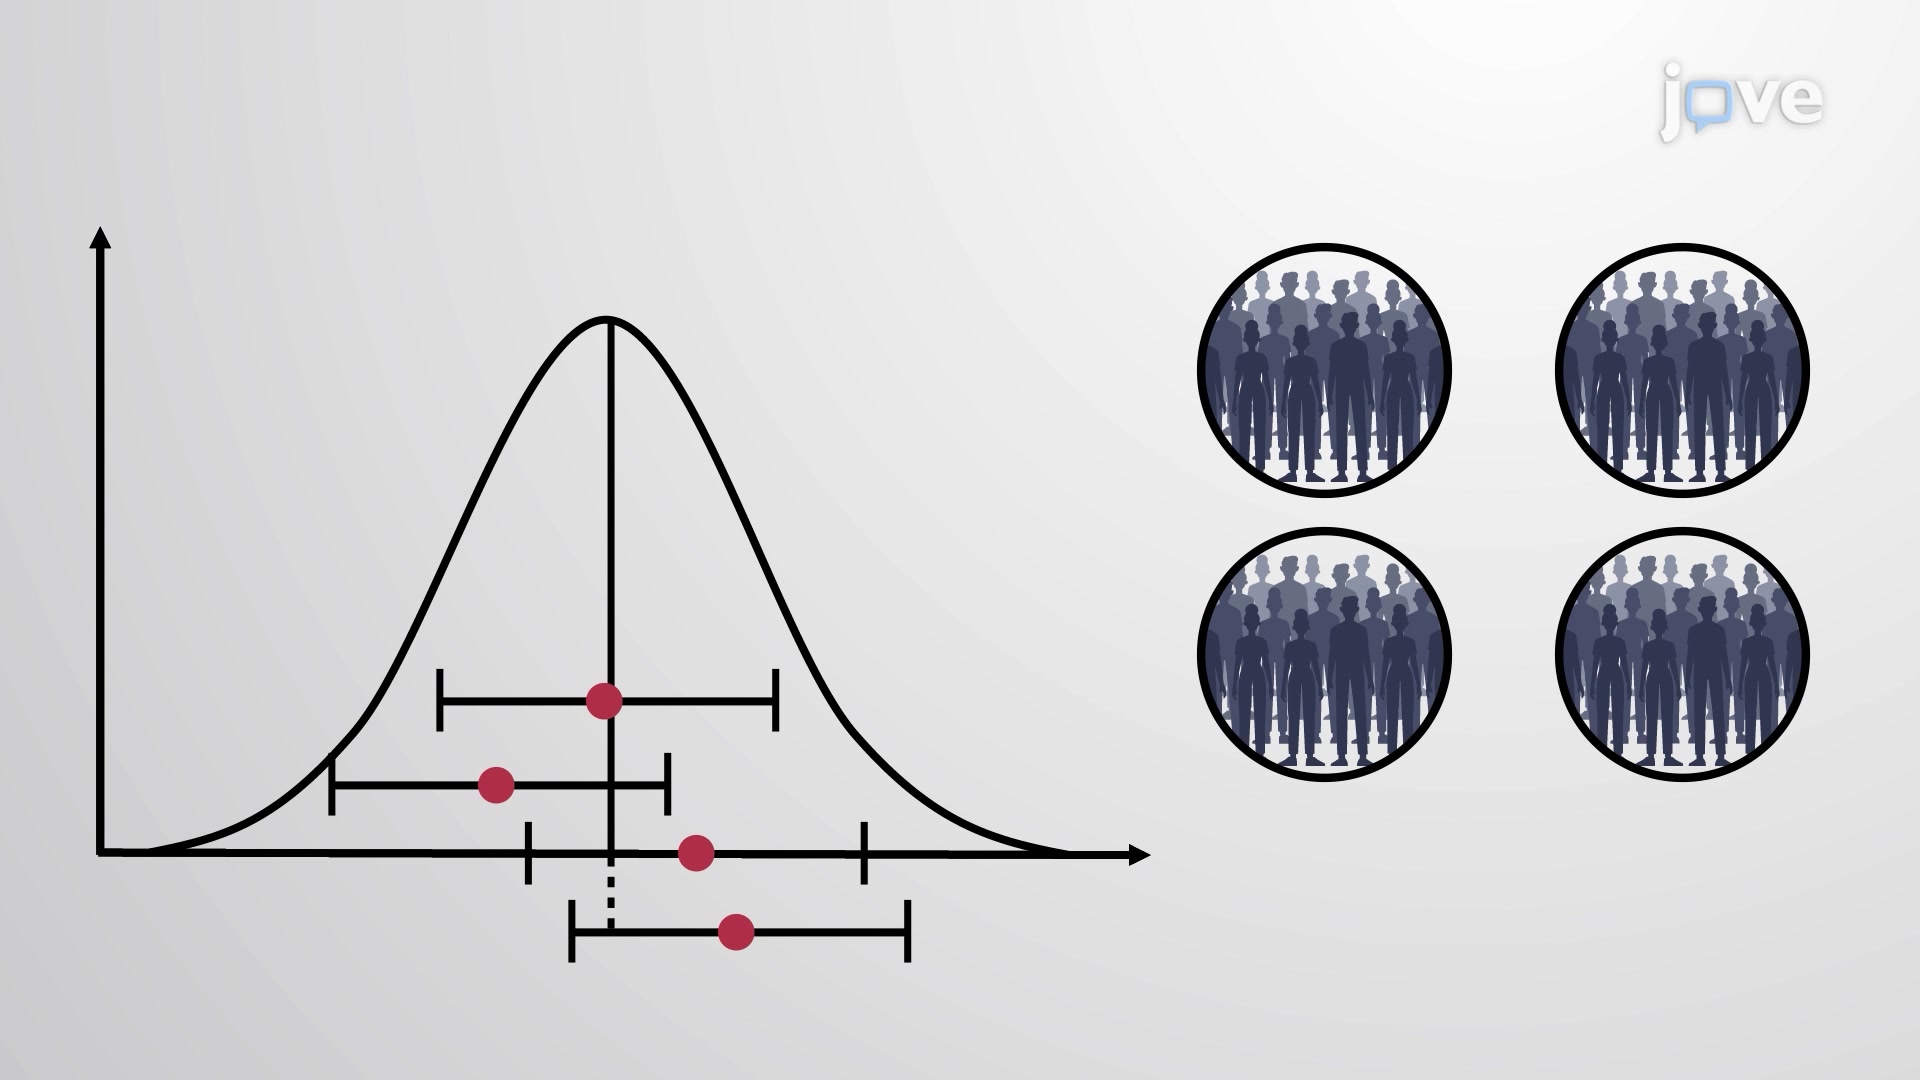
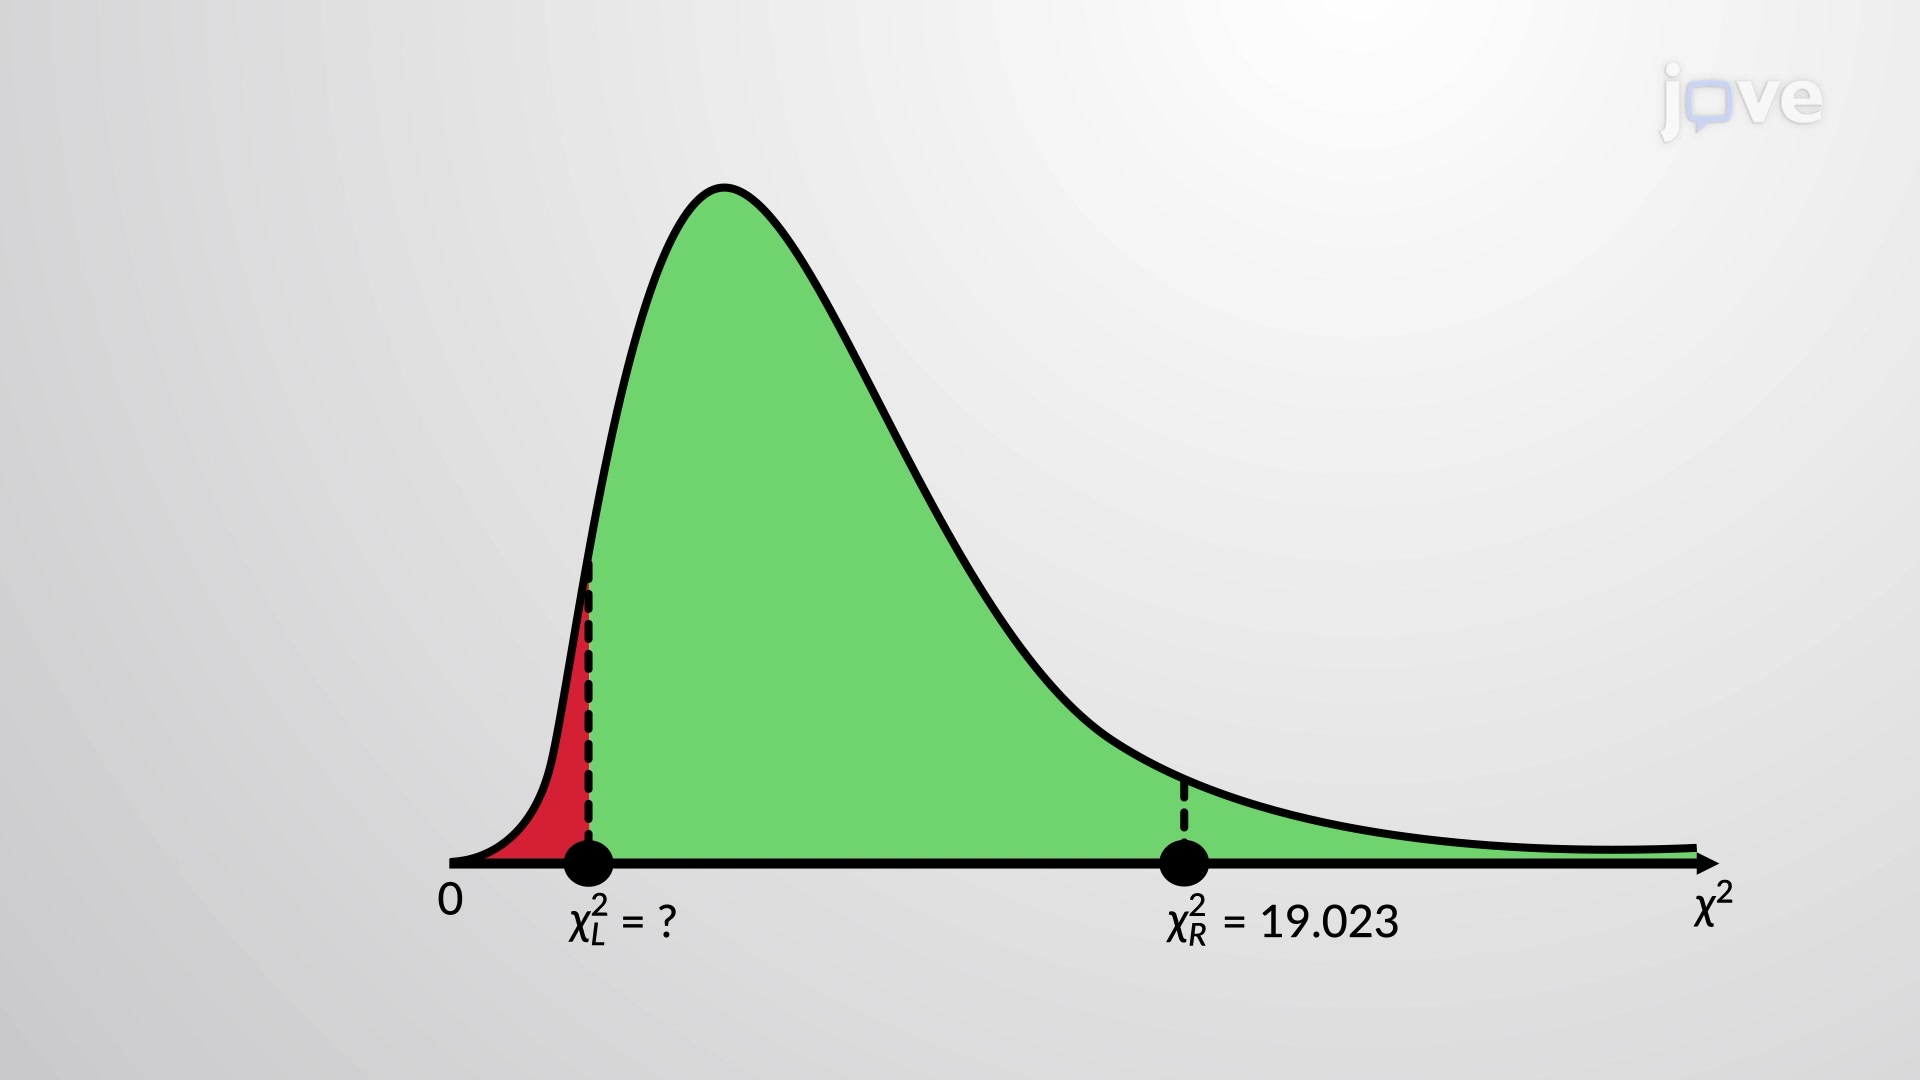
Consider a curve representing sample data drawn randomly from a normally distributed population. One must construct confidence intervals to estimate or to ...
When the population standard deviation is unknown and the sample size is large, the sample standard deviation s is commonly used as a point estimate of ...
The goodness-of-fit test is a type of hypothesis test which determines whether the data "fits" a particular distribution. For example, one may ...
A goodness-of-fit test is conducted to determine whether the observed frequency values are statistically similar to the frequencies expected for the ...
A contingency table provides a way of portraying data that can facilitate calculating probabilities. It is a method of displaying a frequency distribution ...
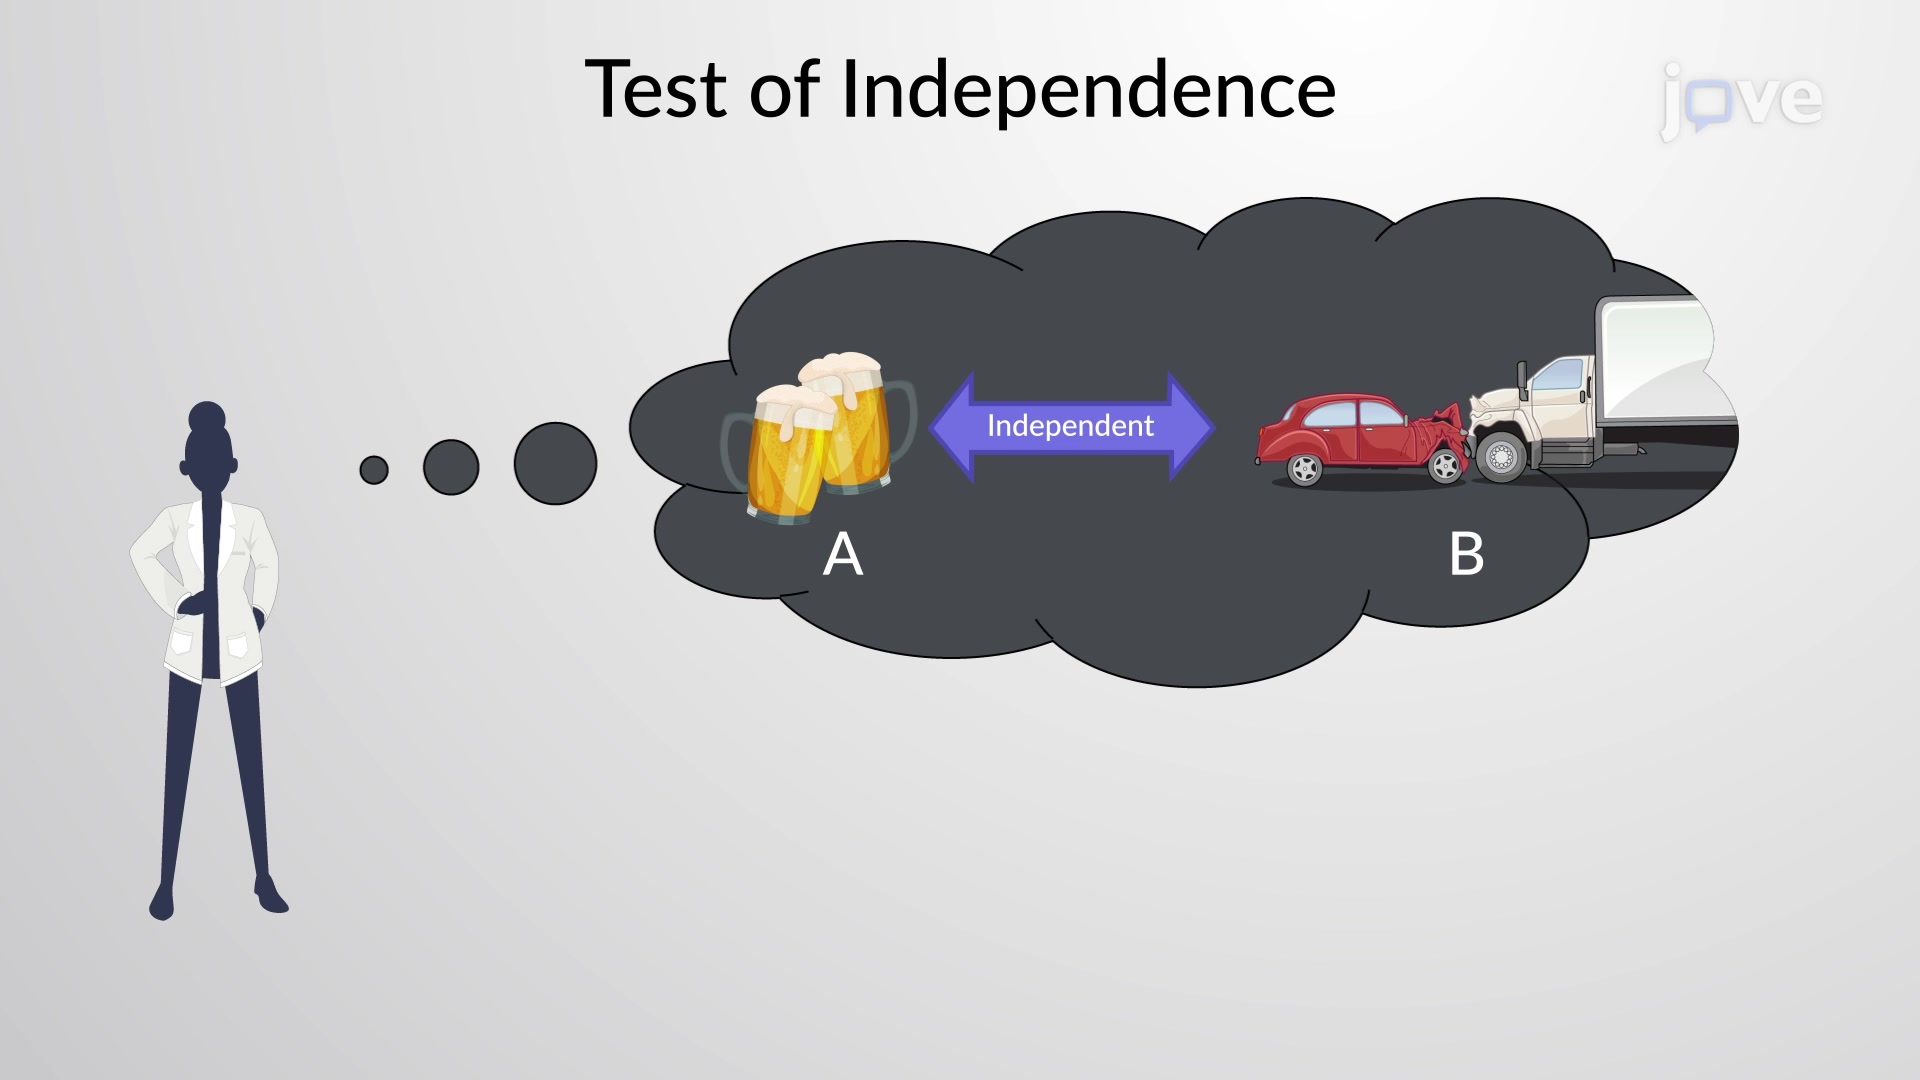
In statistics, the term independence means that one can directly obtain the probability of any event involving both variables by multiplying their ...
The test of independence is a chi-square-based test used to determine whether two variables or factors are independent or dependent. This hypothesis test ...
Suppose one wants to test independence between the two variables of a contingency table. The values in the table constitute the observed frequencies of ...
The goodness–of–fit test can be used to decide whether a population fits a given distribution, but it will not suffice to decide whether two ...
The F distribution was named after Sir Ronald Fisher, an English statistician. The F statistic is a ratio (a fraction) with two sets of degrees of ...
Privacy
Terms of Use
Policies
Contact Us
Recommend to library
JoVE NEWSLETTERS
JoVE Journal
Methods Collections
JoVE Encyclopedia of Experiments
Archive
JoVE Core
JoVE Science Education
JoVE Lab Manual
JoVE Quiz
JoVE Playlist
Authors
Librarians
Access
ABOUT JoVE
JoVE Sitemap
Copyright © 2025 MyJoVE Corporation. All rights reserved