
13.16 : Wald-Wolfowitz Runs Test II
The Wald-Wolfowitz runs test, commonly referred to as the runs test, is a nonparametric test used to assess the randomness of ordered data. The test evaluates the number of runs, which are consecutive sequences of similar elements within the data. If the number of runs is significantly higher or lower than expected, the data is considered non-random, indicating a detectable pattern or structure.
For binary data, runs are identified using symbols such as + and −, or equivalently, 1s and 0s. In the case of categorical data with two categories, these categories are converted into binary choices. However, in cases like DNA sequences, where categories such as A, T, G, and C are inherent, no conversion is necessary, and the test can be applied directly to the sequences. For numerical data, values are often converted by assigning a + (or 1) to those above a certain threshold (like the mean or median) and a − (or 0) to those below it, enabling the identification of runs.
The test's null hypothesis (H0) states that the data follows a random sequence, while the alternative hypothesis (H1) suggests that the data has an underlying pattern or order. The test statistic, denoted as G, represents the number of observed runs in the data. This value is then compared to critical values in a two-tailed test. If G falls outside the critical range (i.e., it is too high or too low), we reject the null hypothesis, concluding that the data is non-random and exhibits a particular sequence. Conversely, if G falls within the critical range, we fail to reject the null hypothesis, suggesting that the data is likely random without any specific order.
The critical values are obtained from a standard table of runs when the number of elements in the data having a particular characteristic (for instance, values smaller than the median), denoted by n1, and the number of elements in the data having a different characteristic (for instance values greater than the median) denoted by n2 is less than or equal to 20 and at the significance level α= 0.05 (Note: do not confuse these numbers with the sample size n).
When these conditions are not fulfilled, i.e., when n1 and n2 and greater than 20 or when the significance level αis anything else but 0.05, the test statistic z is used, and it is calculated using the following equation:
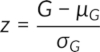
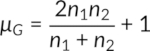
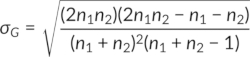
Where µG and σG are calculated by the following equations:
The critical z values, i.e., negative (left-tailed) and positive (right-tailed) critical z values, are obtained from the standard z distribution table. When the test statistic z (calculated from the above equations) is beyond the range of -z and +z, the randomness is rejected, concluding that there is evidence of a specific sequence in the data. If the test statistic is within the range, the randomness in the data is not rejected.
The runs test is unaffected by sample size or the underlying distribution of the population and sample, making it versatile for various types of sequential data to detect randomness. However, while it can identify whether a sequence is random, it does not measure the degree or magnitude of randomness within the data.
Del capítulo 13:

Now Playing
13.16 : Wald-Wolfowitz Runs Test II
Nonparametric Statistics
180 Vistas

13.1 : Introduction to Nonparametric Statistics
Nonparametric Statistics
663 Vistas

13.2 : Ranks
Nonparametric Statistics
226 Vistas

13.3 : Introduction to the Sign Test
Nonparametric Statistics
690 Vistas

13.4 : Sign Test for Matched Pairs
Nonparametric Statistics
102 Vistas

13.5 : Sign Test for Nominal Data
Nonparametric Statistics
70 Vistas

13.6 : Sign Test for Median of Single Population
Nonparametric Statistics
89 Vistas

13.7 : Wilcoxon Signed-Ranks Test for Matched Pairs
Nonparametric Statistics
87 Vistas

13.8 : Wilcoxon Signed-Ranks Test for Median of Single Population
Nonparametric Statistics
101 Vistas

13.9 : Wilcoxon Rank-Sum Test
Nonparametric Statistics
151 Vistas

13.10 : Bootstrapping
Nonparametric Statistics
583 Vistas

13.11 : The Anderson-Darling Test
Nonparametric Statistics
665 Vistas

13.12 : Spearman's Rank Correlation Test
Nonparametric Statistics
679 Vistas

13.13 : Kendall's Tau Test
Nonparametric Statistics
590 Vistas

13.14 : Kruskal-Wallis Test
Nonparametric Statistics
561 Vistas
See More
ACERCA DE JoVE
Copyright © 2025 MyJoVE Corporation. Todos los derechos reservados