
Aby wyświetlić tę treść, wymagana jest subskrypcja JoVE. Zaloguj się lub rozpocznij bezpłatny okres próbny.
Method Article
Quantification of Hydrogen Concentrations in Surface and Interface Layers and Bulk Materials through Depth Profiling with Nuclear Reaction Analysis
W tym Artykule
Podsumowanie
We illustrate the application of 1H(15N,αγ)12C resonant nuclear reaction analysis (NRA) to quantitatively evaluate the density of hydrogen atoms on the surface, in the volume, and at an interfacial layer of solid materials. The near-surface hydrogen depth profiling of a Pd(110) single crystal and of SiO2/Si(100) stacks is described.
Streszczenie
Nuclear reaction analysis (NRA) via the resonant 1H(15N,αγ)12C reaction is a highly effective method of depth profiling that quantitatively and non-destructively reveals the hydrogen density distribution at surfaces, at interfaces, and in the volume of solid materials with high depth resolution. The technique applies a 15N ion beam of 6.385 MeV provided by an electrostatic accelerator and specifically detects the 1H isotope in depths up to about 2 μm from the target surface. Surface H coverages are measured with a sensitivity in the order of ~1013 cm-2 (~1% of a typical atomic monolayer density) and H volume concentrations with a detection limit of ~1018 cm-3 (~100 at. ppm). The near-surface depth resolution is 2-5 nm for surface-normal 15N ion incidence onto the target and can be enhanced to values below 1 nm for very flat targets by adopting a surface-grazing incidence geometry. The method is versatile and readily applied to any high vacuum compatible homogeneous material with a smooth surface (no pores). Electrically conductive targets usually tolerate the ion beam irradiation with negligible degradation. Hydrogen quantitation and correct depth analysis require knowledge of the elementary composition (besides hydrogen) and mass density of the target material. Especially in combination with ultra-high vacuum methods for in-situ target preparation and characterization, 1H(15N,αγ)12C NRA is ideally suited for hydrogen analysis at atomically controlled surfaces and nanostructured interfaces. We exemplarily demonstrate here the application of 15N NRA at the MALT Tandem accelerator facility of the University of Tokyo to (1) quantitatively measure the surface coverage and the bulk concentration of hydrogen in the near-surface region of a H2 exposed Pd(110) single crystal, and (2) to determine the depth location and layer density of hydrogen near the interfaces of thin SiO2 films on Si(100).
Wprowadzenie
The ubiquity of hydrogen as an impurity or as a constituent of a vast variety of materials and the wealth of hydrogen-induced interaction phenomena make revealing the hydrogen distribution in the near-surface region and at buried interfaces of solids an important task in many areas of engineering and fundamental material science. Prominent contexts include studies of hydrogen absorption in storage and purification materials for hydrogen energy applications, fuel cell, photo-, and hydrogenation catalysis, hydrogen retention and embrittlement in nuclear and fusion reactor engineering, hydrogen-induced surfactant effects in epitaxial growth fabrication and hydrogen-related electrical reliability issues in semiconductor device technology.
Despite its omnipresence and simple atomic structure, the quantitative detection of hydrogen poses analytical challenges. As hydrogen contains only a single electron, otherwise versatile elemental analysis by electron spectroscopy is rendered ineffective. Common hydrogen detection methods through mass analytical, optical, or nuclear resonance techniques such as metallurgical fusion, thermal desorption, infrared absorption or NMR spectroscopy are principally insensitive to the depth location of hydrogen. This precludes, e.g., discriminating between surface-adsorbed and bulk-absorbed hydrogen which differ substantially in their physical and chemical material interactions, and their distinction therefore becomes increasingly important for the analysis of nanostructured materials that comprise small volumes and large surface areas. Hydrogen profiling by secondary ion mass spectroscopy, although providing depth-resolved quantitative H concentrations, is equally destructive to the analyzed target as metallurgical fusion, and sputtering effects may render the depth information obtained near the surface unreliable.
Nuclear reaction analysis with the narrow energy resonance (Eres) of the 1H(15N,αγ)12C reaction at 6.385 MeV1-3, on the other hand, combines the advantages of non-destructive hydrogen quantitation with high depth resolution in the order of a few nanometers near the surface. The method determines surface H coverages with a sensitivity in the order of 1013 cm-2 (~1% of a typical atomic monolayer density). Hydrogen concentrations in the interior of materials can be assessed with a detection limit of several 1018 cm-3 (~100 at. ppm) and a probing depth range of about 2 μm. The near-surface depth resolution is routinely 2-5 nm in surface-normal incidence of the 15N ion beam onto the analyzed target. In surface-grazing incidence geometries, the resolution can be enhanced further to values below 1 nm. See Ref. 3 for a detailed account.
These capabilities have proven 1H(15N,αγ)12C NRA as a powerful technique to elucidate the static and dynamic behavior of hydrogen at surfaces and interfaces in a large variety of processes and materials3. Established by Lanford4 in 1976, 15N NRA was first used predominantly to quantitatively determine volume H concentrations in bulk materials and thin films. Among other purposes, the absolute hydrogen concentrations obtained through 15N NRA have been used to calibrate other, not directly quantitative, hydrogen detection techniques5,6. Also 15N NRA hydrogen profiling in targets with well-defined interfaces in layered thin film structures has been described7-10. More recently, much progress has been achieved in studying hydrogen in the near-surface region of chemically clean and structurally well-defined targets by combining 15N NRA with surface analytical ultra-high vacuum (UHV) instrumentation to prepare atomically controlled surfaces in situ for the H analysis3.
By quantifying the hydrogen coverage on single crystal surfaces, NRA has contributed significantly to the current microscopic understanding of hydrogen adsorption phases on many materials. 1H(15N,αγ)12C NRA is furthermore the only experimental technique to directly measure the zero-point vibrational energy of surface-adsorbed H atoms11, i.e., it can reveal the quantum-mechanical vibrational motion of adsorbed H atoms in the direction of the incident ion beam. Through the capability of nanometer-scale discrimination between surface-adsorbed and bulk-absorbed H, 15N NRA can provide valuable insight into the hydrogen ingress through material surfaces, such as relevant to mineral hydration dating12 or for observing hydride nucleation underneath surfaces of H-absorbing metals13-15. High-resolution 15N NRA applications have demonstrated the potential to detect sub-monolayer thickness variations of adlayers16 and to distinguish surface-adsorbed from volume-absorbed hydrogen in Pd nanocrystals17. The combination with thermal desorption spectroscopy (TDS) allows for unambiguous identifications of H2 thermal desorption features and for the depth-resolved assessment of the thermal stability of adsorbed and absorbed hydrogen states against desorption and diffusion13,15,18. Due to its non-destructive nature and high depth resolution 1H(15N,αγ)12C NRA is also the ideal method to detect hydrogen buried at intact interfaces, which allows for studying hydrogen trapping at metal/metal19-22 and metal/semiconductor interfaces16,23-25 and for tracking hydrogen diffusion in stacked thin film systems9. By directly visualizing hydrogen redistribution phenomena between interfaces of SiO2/Si-based metal-oxide-semiconductor (MOS) structures that relate to electrical device degradation, NRA has made particularly valuable contributions to device reliability research26.
The hydrogen detection principle in NRA is to irradiate the analyzed target with a 15N ion beam of at least Eres=6.385 MeV to induce the resonant 1H(15N,αγ)12C nuclear reaction between 15N and 1H in the material. This reaction releases characteristic γ-rays of 4.43 MeV that are measured with a scintillation detector nearby the sample. The γ-yield is proportional to the H concentration in a certain depth of the target. Normalizing this signal by the number of incident 15N ions converts it into absolute H density after the γ-detection system has been calibrated with a standard target of known H concentration. 15N ions incident at Eres can react with hydrogen on the target surface. The concentration of buried hydrogen is measured with 15N ions incident at energies (Ei) above Eres. Inside the target material, the 15N ions suffer energy loss due to electronic stopping. This effect provides the high depth resolution, because the 1H(15N,αγ)12C nuclear reaction resonance has a very narrow width (Lorentzian width parameter Γ = 1.8 keV) and the stopping power of materials for 6.4 MeV 15N ranges between 1-4 keV/nm, so that the passage of the 15N ion through only a few atomic layers is sufficient to shift its energy outside the resonance window. Thus, the resonant reaction detects buried H at Ei > Eres in a probing depth d=(Ei-Eres)/S, where S is the electronic stopping power of the analyzed material3.
By measuring the γ-yield while scanning the incident 15N ion energy in small increments, one obtains a nuclear reaction excitation curve that contains the density-depth distribution of hydrogen in the target. In this excitation curve (γ-yield vs. 15N energy), the actual H depth distribution is convolved with the NRA instrumental function that adds a predominantly Gaussian broadening and is the main limitation for the depth resolution3. At the surface (i.e., at Ei = Eres) the Gaussian width is dominated by a Doppler Effect due to zero-point vibration of the H atoms against the target surface.11,27,28 The yield curve of buried hydrogen detected at Ei > Eres is affected by an additional Gaussian broadening component due to random 15N ion energy straggling inside the target. The straggling width increases in proportion to the square root of the ion trajectory length in the material 29,30 and becomes the dominant resolution limiting factor above probing depths of 10-20 nm.
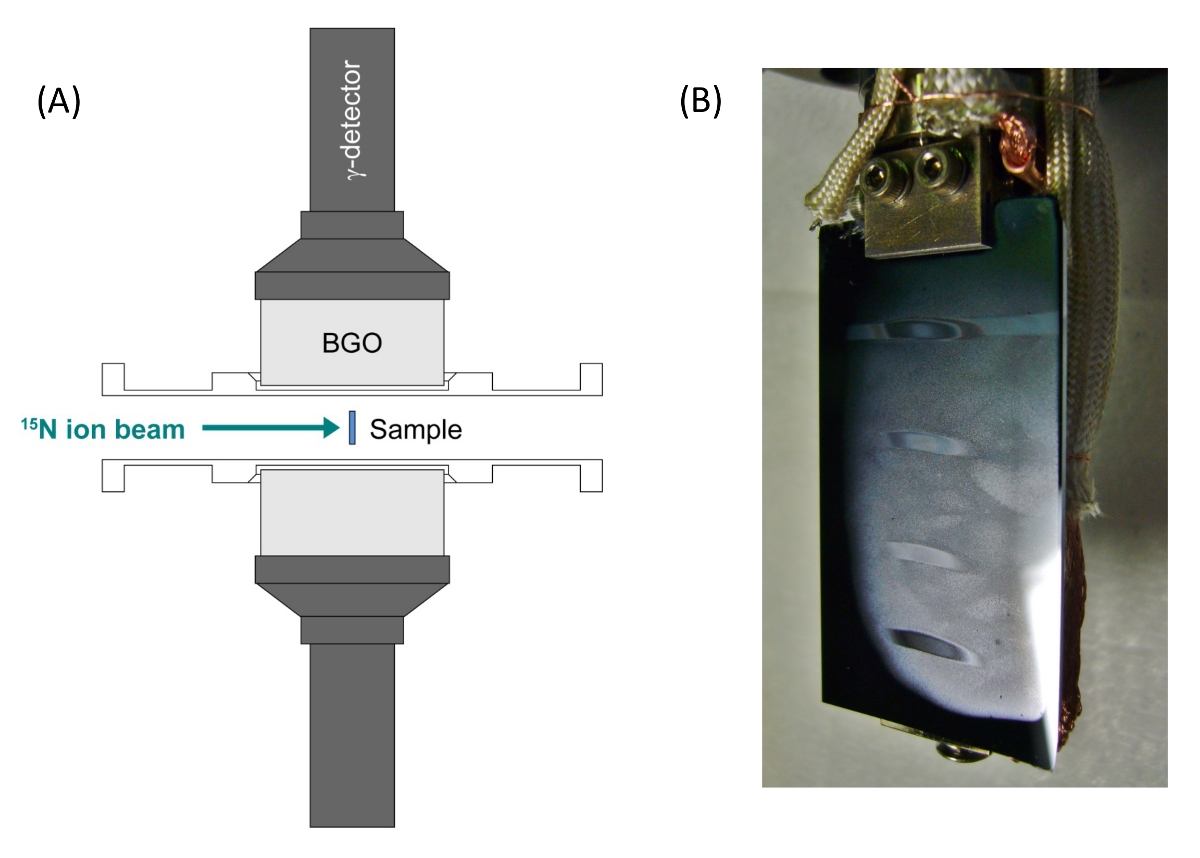
To demonstrate a few very typical hydrogen profiling applications with 15N NRA, we here exemplarily describe (1) the quantitative evaluation of the surface H coverage and of the bulk-absorbed hydrogen concentration in a H2 exposed palladium (Pd) single crystal, and (2) the evaluation of the depth location and hydrogen layer densities at buried interfaces of SiO2/Si(100) stacks. The NRA measurements are performed at the MALT 5 MV van-de-Graaf tandem accelerator31 of the University of Tokyo, which delivers a highly stable and well-monochromatized (ΔEi ≥ 2 keV) 15N ion beam of 6-13 MeV. The authors have developed a computer control system for the accelerator to enable automated energy scanning and data acquisition for hydrogen profiling. Reflecting the two different NRA measurement tasks presented by the above H profiling applications, the MALT facility provides two ion beam lines with specialized experimental stations: (1) a UHV surface analytical system with a single bismuth germanate (BGO, Bi4Ge3O12) γ-scintillation detector dedicated to the NRA quantitation of hydrogen surface coverages, to zero-point vibration spectroscopy, and to H depth profiling at atomically controlled single crystal targets in a unique combination with TDS; and (2) a high vacuum chamber equipped with two BGO detectors positioned very close to the target for increased γ-detection efficiency, providing for a lower H detection limit and faster data acquisition. This setup has no sample preparation facilities but allows for rapid sample exchange (~30 min) and thus for a higher throughput of targets for which a well-controlled surface layer is not an essential part of the analytical task, such as H profiling at buried interfaces or the quantitation of bulk H concentrations. At both beam lines, the BGO detectors are placed conveniently outside of the vacuum systems because the γ-rays penetrate the thin chamber walls with negligible attenuation.

Figure 1. NRA setup in the BL-1E UHV system. (A) Schematic top view into the BL-1E UHV system equipped with sputter ion gun, low energy electron diffraction (LEED), and Auger electron spectroscopy (AES) for the in-situ preparation of atomically ordered and chemically clean single crystal surface targets and combined NRA and TDS measurements with a quadrupole mass spectrometer (QMS) mounted on a linear translation stage. (B) Pd single crystal specimen attached on the sample holder of the cryogenic manipulator. Please click here to view a larger version of this figure.
Figure 1 (A) illustrates the UHV system at beam line (BL)-1E, which is fully equipped for the in-situ preparation of atomically ordered single crystal surfaces and has a base pressure <10-8 Pa to maintain surface cleanliness. To provide sample access for the surface-analytical tools, the 4" BGO scintillator is placed on the 15N ion beam axis ~30 mm behind the target. The sample is mounted on a 4-axis manipulation stage for precise (x, y, z, Θ) positioning and can be cooled with liquid nitrogen to ~80 K or with compressed He to ~20 K. Figure 1 (B) shows a Pd single crystal target mounted by spot-welded Ta support wires to a He compression cryostat. Quartz sheet spacers insulate the sample holder plate electrically from the cryostat body. This enables the incident 15N ion beam current measurement necessary for quantitative NRA and allows for electron bombardment heating from the tungsten filament on the backside of the sample holder. A type K thermocouple is spot-welded to the edge of the Pd specimen. A quartz plate attached on the manipulator axis above the sample is used to monitor the ion beam profile and for sample-beam alignment. Figure 2 (A) shows the setup at BL-2C with two 4" BGO detectors arranged at 90° with respect to the 15N beam with their front face no further than 19.5 mm apart from the beam axis. The sample holder (Figure 2 (B)) provides a simple clamping mechanism for quick sample exchange and allows for rotation of the sample around the vertical axis to adjust the 15N incidence angle.

Figure 2. NRA setup at BL-2C. (A) Schematic top view into the high vacuum chamber at BL-2C equipped with two BGO γ-detectors close to the target position. (B) Sample holder with a large chip target of SiO2/Si(100) clamped on. Fogging up this sample type with water vapor after the NRA analysis visualizes the spots that were irradiated by the 15N ion beam. Please click here to view a larger version of this figure.
Protokół
1. Planning of Experiments
- Identify the MALT accelerator beam line of interest depending on the measurement task (BL-1E for surface hydrogen, BL-2C for bulk or interfacial hydrogen). Contact the assisting scientist (currently M.W. or K.F.) to discuss details of the NRA measurements and their necessary preparations.
- Download a beam time application form and observe the submission deadline on the MALT website31.
Note: The MALT facility invites new project proposals each March and September for the Summer (April-September) and Winter (October-March) half year terms, respectively. - Write the beam time proposal and submit as instructed on the MALT website.
- After approval of the proposal, confirm the beam time schedule for the upcoming half year term as announced on the MALT website31. Safety training is required for new users in the beginning of the term.
- Prepare for the beam time in advance. Consider all details of the experiment, and the time necessary for the transport of materials, for sample installation, and especially for in-situ surface preparation in UHV (if required). Ready the target specimen for the NRA measurement before the beam time starts.
2. Preparation for NRA Measurements at BL-1E (UHV)
Note: Always wear gloves when handling instruments and materials intended for use in vacuum, including the clean tools.
- Install single crystal sample into UHV (refer to Figure 1 (B)).
- Set spot-welder power to 3.5. Place single crystal specimen onto clean, flat, non-conducting working surface and spot-weld two 4-cm long pieces of tantalum (Ta) wire (0.3 mm diam.) in parallel to sample edges.
- Gently bend wires to fit around the crystal edge shape while countering the bending forces with tweezers or pliers at the spot welding points. On a length of ~1 cm on each side, apply 2-4 additional spot welding points to the wire pair along the crystal edge.
- Bend wire ends to point away from crystal center in a horizontal plane parallel to the working surface. Place sample with support wires onto the Ta plate (0.3 mm thick) of the sample holder. Align sample to cover the hole above the backside filament heater and fix the specimen position by spot-welding all four support wire ends onto the plate. If possible, apply more than one welding point to each wire end, moving from wire tip towards sample.
- Cut away any excessive wire length standing out from holder plate edge. Set spot-welder power to minimum and release one pulse through spot-welding pliers closed empty. Spot-weld type K (chromel-alumel) thermocouple (0.2 mm diameter) to the upper edge of the crystal specimen.
- Confirm proper connectivity of the sample mount by measuring resistances between the electrical feedthrough contacts at the cryostat head: Filament vs. sample (bias contact wire attached to sample holder plate) > 20 MΩ; Filament vs. ground (cryostat body) > 20 MΩ; Filament leads (0.3 mm diam. W) < 3 Ω; Thermocouple leads: ~16 Ω; Thermocouple vs. ground > 20 MΩ; Thermocouple vs. sample ~20 Ω and ~8 Ω (depending on wire material, chromel or alumel).
- Note distance between centers of sample and beam profile monitor (quartz plate).
- Replace copper gasket on UHV manipulator head and carefully insert cryostat with mounted sample. Tighten flange bolts and evacuate UHV system following instructions from the assisting scientist.
- Prepare UHV chamber for bake out by attaching heater tapes and aluminum foil. Assure normal operation of all turbo-molecular pumps for at least 30 min and a pressure < 2×10⁻⁴ Pa. Turn on chamber heaters to bake the UHV system for 24 hr.
- Confirm ion gauge reading below 1×10⁻⁵ Pa. Turn off baking heaters. Reactivate non-evaporable getter (NEG) pump with internal heater element at 400-450 °C for 30 min while the chamber is still hot.
- Let chamber cool for 3-4 hr, then reattach QMS electronics and power supply cables to ion gun and LEED optics. Degas filaments of QMS, ion gun, and LEED. Confirm that chamber base pressure is <1×10⁻⁸ Pa after fully cooling to room temperature (within 12-24 hr).
- Prepare single crystal surface in UHV (refer to Figure 1 (A)).
- Position sample in chamber center with the manipulator x, y, z-stage and rotate to align surface between viewport and ion gun (facing the gas doser). Switch on ion gun power supply and adjust 'Emission' control to 20 mA. Look at the sample through the viewport and fine-adjust sample rotation angle so that the mirror image of the glowing ion gun filament is visible on the sample surface.
- Set 'Beam energy' on ion gun power supply to 800 eV. Close NEG pump gate valve at the chamber bottom and introduce 6×10⁻³ Pa Ar gas into UHV chamber through variable leak valve. Confirm a sputter ion current (digital tester, from sample to ground) around 2 μA and sputter surface for 10 min at room temperature.
- Add liquid nitrogen to the manipulator cryostat. At manipulator head, connect filament heater leads to power supply and digital tester (20 mV range) to thermocouple feedthrough. Ground the filament.
- Connect sample contact to bias voltage power supply. Apply sample bias of 1 kV. Use filament heater currents up to 6.6 A for annealing, oxidation, and flash-heating in the next Step (2.2.5) while monitoring the thermocouple voltage (sample temperature) with the digital tester.
CAUTION: NEVER touch digital tester or manipulator head while the sample is biased (risk of fatal electric shock!). - Anneal sample in UHV to 1,000 K for 10 min ensuring the pressure remains below 2×10⁻⁷ Pa. Oxidize at 750 K in 5.0×10⁻⁵ Pa O2 for 5 min, then reduce at room temperature (RT) in 5.0×10⁻⁵ Pa H2. Perform a final flashing to 600 K in UHV.
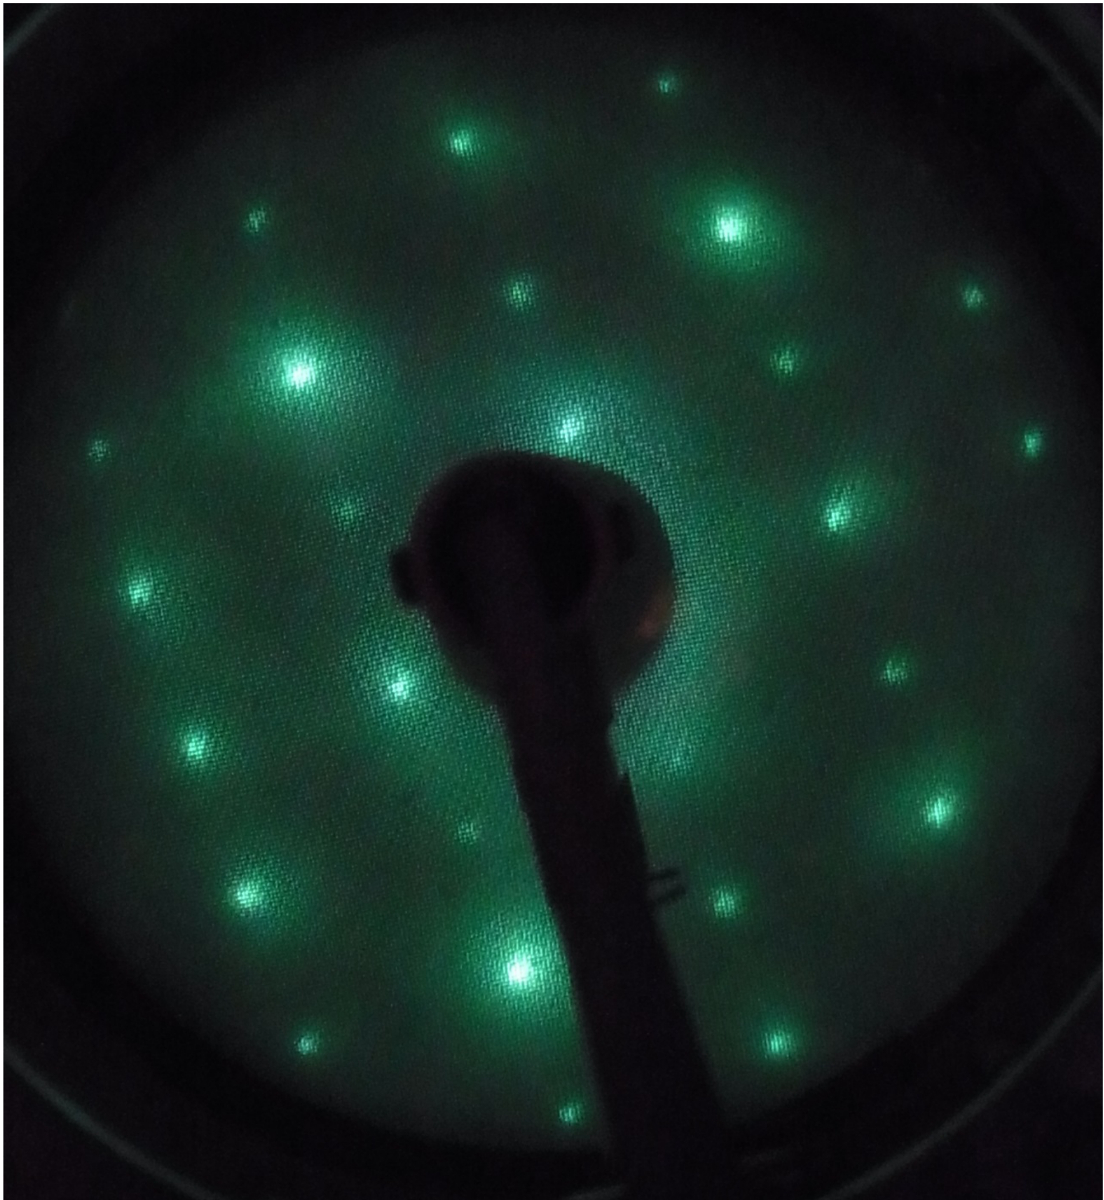
- Observe LEED pattern and repeat Steps 2.2.1 to 2.2.2 (sputtering) and 2.2.3. to 2.2.5 (annealing/oxidation/H2-reduction) until a clear (1×1) structure with bright spots on low background results (Figure 3) and no impurities remain in Auger electron spectroscopy32. Sputter for only 2-3 min in the repeated sputter/annealing cycles.
- (optional) Add liquid nitrogen to the manipulator cryostat to cool sample to 90 K and expose to a few Langmuirs (L) of H2 gas (1 L = 1.33 × 10⁻⁴ Pa). Perform a TDS measurement and finally verify that the H2 thermal desorption spectrum conforms with literature data15.
Note: The preparations necessary in advance of the NRA beam time are now complete. The clean surface target can now be prepared routinely within ~2-3 hr by repeating Steps 2.2.1 through 2.2.6 with sputtering cycles of 2-3 min.

Figure 3. LEED pattern (223 eV) of the cleaned Pd(110) surface in the BL-1E UHV system. The clear (1×1) pattern with bright diffraction spots on a low background signifies an atomically well-ordered surface structure. Please click here to view a larger version of this figure.
- Align 15N ion beam to single crystal target.
- At the 1E UHV chamber, position sample in chamber center (x = 25, y = 26, adjust z by eye to height of QMS front aperture) and rotate to face 15N ion beam line. Bring quartz plate beam profile monitor (Figure 1 (B)) into NRA measurement position by lowering sample holder by sample-monitor distance measured in Step 2.1.5. Set digital camera on window flange below the manipulator to transmit beam profile image on the quartz plate to the TV monitor in the accelerator control room.
- Remove all other electrical contacts to sample at manipulator head and connect signal line to digital current integrator in control room. Set electrostatic deflector voltage on BL-1E to 8,500 V. Open the three manual gate valves on BL-1E between the UHV chamber and the bending magnet BM04.
- Obtain instructions from the assisting scientist to become familiar with the accelerator control system in the control room.
Note: Accelerator parameters (such as beam energy- and direction-defining magnet fields and focusing lenses) are set with assignable dials on a central control panel. Beam line valves and Faraday cups are remotely opened/closed by mouse clicks and pneumatic actuation. - In the control room, switch current integrator from 'Stand by' mode to 'Operate'. Connect integrator analog output to current indicator. At the accelerator control panel, adjust 15N ion beam energy with accelerator in slit feedback mode to an energy analyzer magnet field of 5,535 Gauss (Parameter: NMR03) and match bending magnet field (Parameter HPB04) to ~-6,033.4 Gauss to direct ion beam onto target in 1E UHV chamber. Set magnetic quadrupole lens parameters (MQ04) to XCC=4.64 A and YCC=5.15 A to focus beam approximately.
- In the control room, open two gate valves between accelerator and beam line 1E. Open Faraday cup (FC) FC04 and observe ion beam profile on quartz plate in target chamber on the TV monitor. Fine tune BM04 and MQ04 parameter settings to obtain well-focused ion beam in center of profile monitor plate. Adjust z-position of quartz monitor with sample manipulator if necessary.
- Close Faraday cup FC04 and lift up sample z-position again by sample-monitor distance. Take note of NMR03/HPB04/MQ04 (XCC, YCC) parameters and save them in a new MagparNNN.xls file for the current beam time (NNN, a three-digit number).
Note: Based on this reference NMR03/HPB04 input, MagparNNN.xls calculates the matching magnet field parameters for the energy-analyzing (BM03) and direction-switching (BM04) magnets necessary to keep the ion beam position on the target during a 15N energy scan.
3. Preparation for NRA Measurement at BL-2C
- Lift up any previously used sample from the beam line position into to the manipulator transfer rod, secure height with fixation screw, and close gate valve to the beam line.
- Detach sample current line at electrical feedthrough and rotary pump line at KF flange coupling of the manipulator. Detach manipulator from the gate valve flange.
- Place manipulator onto preparation table and slide sample holder out of the transfer tube. Rotate manipulator axis to place sample horizontally.
- Loosen two M2 cap screws of sample clamp (Figure 2 (B)) and remove old target. Set new sample, align parallel to manipulator axis, and tighten clamp screws. Retract sample into transfer tube and secure position with fixation screw.
- Replace copper gasket on gate valve and reinstall manipulator on the beam line. Attach rotary pump line to manipulator. Close valve in the rotary pump line to the turbo-molecular pump (TMP).
- Open rotary pump line valve of the manipulator and evacuate transfer tube for 10-15 min to restore rotary base pressure. Close manipulator pump line valves and open valve in rotary pump line to TMP. Slowly open the gate valve to the manipulator and evacuate for 20-30 min to restore 2-3×10⁻³ Pa.
- Lower sample to beam line position and align surface normal of beam profile monitor (glass plate) to incident beam direction with aid of BL-2C camera and nearby TV monitor. Then connect BL-2C camera signal line to TV monitor in control room. Open two pneumatically actuated gate valves on BL-2C between the NRA chamber and bending magnet BM04.
- Connect sample current signal line between electrical feedthrough of sample manipulator and digital current integrator (control room). In the accelerator control room, switch current integrator from 'Stand by' mode to 'Operate' and connect integrator analog output to current monitor.
- Roughly align 15N ion beam to target in BL-2C by setting bending magnet field (Parameter HPB04) to ~0.6 Gauss (Polarity: positive), magnetic quadrupole lens MQ04 parameters to XCC=4.64 A and YCC=5.15 A, and quadrupole lens MQ-2C parameters A=3.3 A and B=3.6 A to focus beam approximately.
- Fine-tune HPB04/MQ04(XCC, YCC)/MQ-2C(A, B) parameters to optimize beam transmission (unobstructed passage to target) and beam profile on target (use beam profile monitors BPM-1C and BPM-2C and BL-2C camera image) and take note of the best settings.
4. NRA Measurement at BL-1E
- Flash-heat Pd sample to 600 K to free surface from any adsorbed contaminants. Stabilize sample temperature at 145 K with filament heater (~3.6 A) and running He compression cryostat (or liquid nitrogen cooling).
- Close valves to accelerator and to NEG pump and expose sample to 2,000 L H2 (2.66×10-3 Pa × 100 sec) at 145 K. Let sample cool to 80 K and adjust a H2 background pressure of 1×10⁻⁶ Pa.
- In the control room, set 15N ion beam energy at BM03 to desired start value for the energy scan (typically NMR03 = 5,525 Gauss) and adjust BM04 according to the MagparNNN.xls table.
- Load the NRA data acquisition software (NRAmain.vi) on the accelerator control PC at BL-2C. Select depth profiling routine 'AutoScanLinuxUHVfb3.vi'. In AutoScanLinuxUHVfb3.vi, push 'Read present values' to transfer current magnet parameter settings to the control PC software.
- Verify again that all valves on BL-1E are open, that the sample current signal line is connected, that the current digitizer is set to 'Operate', and that a 15N beam of ideally 15±5 nA is available on FC04.
- Set the stat START, STOP and STEP values of the BM03 parameter for the energy scan (typically 5,525 Gauss, 5,600 Gauss, and 1 Gauss, respectively) and turn the option 'Force TVC to gvm' on. For a ~15 nA beam of 15N2+, set the 'Acquisition time' parameter to 50 sec.
- Click the 'Execution' arrow in AutoScanLinuxUHVfb3.vi console to start automated acquisition of a depth profile (up to ~35 nm depth in Pd for STOP = 5,600 Gauss). At the end of the scan (or for an earlier termination), click 'Stop measurement' to close the data file.
- Switch current digitizer to 'Stand by' mode, detach sample current line from sample manipulator feedthrough, and close the last gate valve on BL-1E before the UHV chamber.
- Stop the background H2 gas dosage by closing the variable leak valve. Open the NEG gate valve at the UHV chamber bottom. (Optional: Take a H2 TDS spectrum of the sample.)
- For additional NRA measurements (optional), re-expose the Pd(110) surface to H2 as instructed in Step 4.2 and repeat Steps 4.3 through 4.9.
5. NRA Measurement at BL-2C
- In the control room, set 15N ion beam energy at BM03 to desired START value for the energy scan (typically NMR03 = 5,525 Gauss to start profiling at the surface).
- Load the NRA data acquisition software (NRAmain.vi) on the accelerator control PC at BL-2C. Select depth profiling routine 'AutoScanLinux11.vi'. Enter the desired BM03 parameters for the automated energy scan (START, STOP, STEP), matching START to the BM03 value set in Step 5.1. For the present SiO2/Si samples, set 'Acquisition time' to 50 sec.
- Verify again that all valves on BL-2C are open, that the sample current signal line is connected, that the current digitizer is set to 'Operate', and that a 15N2+ beam of 50-100 nA is available on FC04.
- Click 'Execution' arrow in 'AutoScanLinux11.vi' to acquire a depth profile that terminates automatically at the STOP value of the BM03 parameter. At the end of the scan (or for earlier termination), click 'Stop measurement' to close the data file.
6. Data Analysis
- Copy *.nra raw data files in /home/csadmin/DataTaking/BTNNN from the acquisition PC (NNN is the number of the current beam time) onto a USB memory stick and transfer to data analysis PC.
- Start the home-built software package for NRA data analysis and open procedure 'NRA-Linux-2C-v3.ipf'. Obtain the procedures NRA-Analysis-2C-v4.ipf, LinuxAddOn-3-v3.ipf, and Menu-NRA.ipf and copy them to the data folder containing Igor User Routines.
- Compile procedures and select 'Load NRA data' from the appearing 'NRA' menu. Select data file measured under Sections 4 or 5, and click 'Continue' in the appearing pop-up dialog.
Note: The software generates two graph outputs from measured data: 'raw data' (raw γ-counts (GRS) vs. NMR03 magnet field as displayed during data acquisition), and 'NRA spectrum', corresponding to the excitation curve (background-subtracted and incident charge-normalized γ-yield (Inorm) vs. 15N ion energy). - Select 'Correct Sample Current readings' from 'NRA' menu and choose the 'Recalculate ISC (entire wave) from averaged ISC/IFar ratio (e.g., sample w/o bias)' option from the drop down menu to rescale ion beam charge reading from current digitizer to actual dimension (μC), referenced to the averaged FC04 beam current readings of the entire data set. Delete the 'Inorm_by_Faraday' trace from the 'NRA spectrum' graph.
Note: Normalization to this scaled integrated incident charge is preferable (over normalization to the Faraday current) because it better reflects the 15N ion charge that actually hits the target than the FC04 current. The latter is measured only once before the Faraday cup opens (to deliver the beam onto the target) and therefore does not account for beam current fluctuations that always occur to some degree during the acquisition time for each data point. Rescaling the sample charge is necessary because the current digitizer reading overestimates the actual incident ion beam charge due to secondary electron emission from the target. - Determine the NMR03 value corresponding to Eres (the maximum position of the surface resonance peak in the 'raw data' plot). If different from the software default value of 5,535 Gauss, correct the entry (if necessary also the Stopping power value) by selecting 'NMR, energy and depth scale' routine from the 'NRA' menu.
- If a background rate (cps) correction has become necessary, use first the 'Correct Faraday readings' function to recalculate the normalized γ-yield from the raw (GRS) data after revising the background value, entering a correction factor of 1 (for the FC04 current). Then run the 'Correct Sample Current readings' function again (Step 6.4) to recalculate also the charge-normalized γ-yield with the revised background in properly scaled relation to the FC04 Faraday.
- Plot charge-normalized γ-yield vs. depth as top axis to display the convolved hydrogen depth distribution (Figure 4).
- Add error bars to the graph using the respective function from the 'NRA' menu. Whenever possible, prefer charge-normalization.
Note: Counting statistics define the error ΔI of the NRA γ-yield, I = GRS-Background, through the error-propagated uncertainties of the measured raw counts, and of the background,
 hence calculates as:
  . The error bars in the depth profile graphs (Figures 4 and 5) are ΔInorm = ΔI/incident ion beam charge.
 - (optional) Perform a fit analysis of the data with suitable model functions3.
Wyniki
Figure 4 shows near-surface NRA H profiles of H2-exposed Pd(110) measured in the BL-1E UHV system at a sample temperature of 90 K under a H2 background pressure of 1.33×10⁻⁶ Pa. The 15N ion incidence energy has been converted into probing depth using the stopping power of Pd (S = 3.90 keV/nm). The open symbol profile was obtained after pre-exposing the Pd(110) sample to 2,000 L H2 at 145 K to induce abso...
Dyskusje
Figure 4 demonstrates the efficient distinction and quantitation of surface-adsorbed from bulk-absorbed hydrogen through 15N NRA at the example of a Pd(110) single crystal in the BL-1E UHV system. The high reproducibility of the surface H peak in the three profiles attests to the reliability of the in-situ UHV sample preparation and to the non-destructive nature of the NRA measurement. The quantitative agreement of the determined H coverage with the expected atomic saturation density ...
Ujawnienia
The authors declare that they have no competing financial interests.
Podziękowania
We greatly appreciate M. Matsumoto for implementing the software that enables the automated measurement of NRA H depth profiles by remotely controlling the MALT accelerator parameters from the data acquisition PC. We thank K. Namba for skillfully performing Pd(110) sample preparations and NRA and TDS measurements at the BL-1E UHV system, and C. Nakano for technical assistance in the accelerator operation. The SiO2/Si(100) specimen is gratefully received as a courtesy of Z. Liu of NEC Corporation, Japan. This work is partially supported by Grants-in-Aid for Scientific Research (Grant numbers 24246013 and 26108705) of the Japan Society for the Promotion of Science (JSPS), as well as through a Grant-in-Aid for Scientific Research in Innovative Areas 'Material Design through Computics: Complex Correlation and Non-Equilibrium Dynamics' from the Ministry of Education, Culture, Sports, Science, and Technology of Japan.
Materiały
| Name | Company | Catalog Number | Comments |
| Material | |||
| Pd single crystal | SPL (Surface Preparation Laboratory), http://www.spl.eu/products.html, or any other suitable supplier | Order made to specification | Disk, 9 mm diam., (110) oriented, aligned to < 0.5 degree or less, one side polished to < 0.3 mm roughness, self-prepared specimen |
| H2 gas | Joutou Gas Corporation, Ltd., Japan, http://www.jyotougas.co.jp/item/gas.html | (99.9995%), or any other suitable supplier | |
| O2 gas | Joutou Gas Corporation, Ltd., Japan, http://www.jyotougas.co.jp/item/gas.html | (99.99%), or any other suitable supplier | |
| Ar gas | Joutou Gas Corporation, Ltd., Japan, http://www.jyotougas.co.jp/item/gas.html | (99.99995%), or any other suitable supplier | |
| Tantalum / Wire | The Nilaco Corporation, http://nilaco.jp/en/order.php | TA-411325 | (99.95%), 0.3 mm diam., or any other suitable supplier |
| Alumel / Wire | The Nilaco Corporation, http://nilaco.jp/en/order.php | 851266 | 0.2 mm diam., or any other suitable supplier |
| Chromel / Wire (Chromel) | The Nilaco Corporation, http://nilaco.jp/en/order.php | 861266 | 0.2 mm diam., or any other suitable supplier |
| Equipment | |||
| 3 keV Raster Ion Bombardment Gun and Control | VARIAN, http://www.eurovac.se/docs/varian1.htm | 981-2046 Power Supply, 981-2043 Ion Gun | or equivalent product of any other suitable manufacturer |
| LEED-AUGER Optics | OCI, http://www.ocivm.com/spectrometer_bdl800ir.html | BDL600IR | or equivalent product of any other suitable manufacturer |
| Quadrupole Mass Spectrometer | Pfeiffer Vacuum, http://www.pfeiffer-vacuum.com/ | Prisma QMS 200 | or equivalent product of any other suitable manufacturer |
| Palladium Hydrogen Purifier | Power + Energy Inc., http://www.powerandenergy.com | PE-3001 | 99.9999999% purity; P+E H2 purifiers are now business of SAES Pure Gases Inc., http://www.saespuregas.com/Products/Gas-Purifier/Hydrogen/Palladium-Membrane/Palladium-Purifier-PE2100.html |
Odniesienia
- Lanford, W. A. Analysis for hydrogen by nuclear-reaction and energy recoil detection. Nucl. Instrum. Methods Phys. Res. B. 66 ((1-2)), 65-82 (1992).
- Lanford, W. A., JR, T. e. s. m. e. r., M, N. a. s. t. a. s. i. Nuclear Reactions for Hydrogen Analysis, Chapter 8. Handbook of Modern Ion Beam Materials Analysis. , 193-204 (1995).
- Wilde, M., Fukutani, K. Hydrogen detection near surfaces and shallow interfaces with resonant nuclear reaction analysis. Surf. Sci. Rep. 69 (4), 196-295 (2014).
- Lanford, W. A., Trautvetter, H. P., Ziegler, J. F., Keller, J. New precision technique for measuring concentration versus depth of hydrogen in solids. Appl. Phys. Lett. 28 (9), 566-568 (1976).
- Ross, R. C., Tsong, I. S. T., Messier, R., Lanford, W. A., Burman, C. Quantification of hydrogen in a-Si-H films by IR spectrometry, N-15 nuclear-reaction, and SIMS. J. Vac. Sci. Technol. 20 (3), 406-409 (1982).
- Suzuki, T., Konishi, J., Yamamoto, K., Ogura, S., Fukutani, K. Practical IR extinction coefficients of water in soda lime aluminosilicate glasses determined by nuclear reaction analysis. J. Non-Cryst. Solids. 382, 66-69 (2013).
- Wagner, W., Rauch, F., Bange, K. Concentration profiles of hydrogen in technical oxidic thin-films and multilayer systems. Fresenius Z. Analyt. Chem. 333 (4-5), 478-480 (1989).
- Wagner, W., Rauch, F., Ottermann, C., Bange, K. In-depth profiling of hydrogen in oxidic multilayer systems. Surf. Interf. Anal. 16 (1-12), 331-334 (1990).
- Wagner, W., Rauch, F., Ottermann, C., Bange, K. Hydrogen dynamics in electrochromic multilayer systems investigated by the N-15 technique. Nucl. Instrum. Methods Phys. Res. B. 50 (1-4), 331-334 (1990).
- Hjörvarsson, B., Rydén, J., Karlsson, E., Birch, J., Sundgren, J. E. Interface effects of hydrogen uptake in Mo/V single-crystal superlattices. Phys. Rev. B. 43 (8), 6440-6445 (1991).
- Fukutani, K., Itoh, A., Wilde, M., Matsumoto, M. Zero-Point Vibration of Hydrogen Adsorbed on Si and Pt Surfaces. Phys. Rev. Lett. 88 (11), 116101 (2002).
- Ericson, J. E., Dersch, O., Rauch, F. Quartz hydration dating. J. Archaeological Sci. 31 (7), 883-902 (2004).
- Wilde, M., Matsumoto, M., Fukutani, K., Aruga, T. Depth-resolved analysis of subsurface hydrogen absorbed by Pd(100). Surf. Sci. 482-485 (Part 1), 346-352 (2001).
- Wilde, M. Hydrogen sorption by Ti(0001) single crystal surfaces. J. Vac. Soc. Jpn. 45 (5), 458-462 (2002).
- Ohno, S., Wilde, M., Fukutani, K. Novel insight into the hydrogen absorption mechanism at the Pd(110) surface. J. Chem. Phys. 140 (13), 134705 (2014).
- Fukutani, K., Wilde, M., Matsumoto, M. Nuclear-reaction analysis of H at the Pb/Si(111) inter-face: Monolayer depth distinction and interface structure. Phys. Rev. B. 64 (24), 245411 (2001).
- Wilde, M., Fukutani, K., Naschitzki, M., Freund, H. J. Hydrogen absorption in oxide-supported palladium nanocrystals. Phys. Rev. B. 77 (11), 113412 (2008).
- Wilde, M., Fukutani, K. Penetration mechanisms of surface-adsorbed hydrogen atoms into bulk metals: Experiment and model. Phys. Rev. B. 78, 115411 (2008).
- Okada, M., Nakamura, M., Moritani, K., Kasai, T. Dissociative adsorption of hydrogen on thin Au films grown on Ir(111). Surf. Sci. 523 (3), 218-230 (2003).
- Okada, M. Reactivity of gold thin films grown on iridium: Hydrogen dissociation. Appl. Catal. A General. 291 (1-2), 55-61 (2005).
- Okada, M. Reactive gold thin films grown on iridium. Appl. Surf. Sci. 246 (1-3), 68-71 (2005).
- Ogura, S. Hydrogen adsorption on Ag and Au monolayers grown on Pt(111). Surf. Sci. 566-568 (Part 2), 755-760 (2004).
- Fukutani, K. Interface hydrogen between a Pb overlayer and H-saturated Si(111) studied by a resonant nuclear reaction. Surf. Sci. 377 (1-3), 1010-1014 (1997).
- Fukutani, K., Iwai, H., Murata, Y., Yamashita, H. Hydrogen at the surface and interface of metals on Si(111). Phys. Rev. B. 59 (20), 13020-13025 (1999).
- Wilde, M., Fukutani, K. Low-temperature growth of Au on H-terminated Si(111): Instability of hydrogen at the Au/Si interface revealed by non-destructive ultra-shallow H-depth profiling. Jpn. J. Appl. Phys. 42 (7B), 4650-4654 (2003).
- Liu, Z., Fujieda, S., Ishigaki, H., Wilde, M., Fukutani, K. Current Understanding of the Transport Behavior of Hydrogen Species in MOS Stacks and Their Relation to Reliability Degradation. ECS Transactions. 35 (4), 55-72 (2011).
- Zinke-Allmang, M., Kalbitzer, S. A novel method to determine vibrational energy states of atomic systems. Z. Physik A. 323 (2), 251-252 (1986).
- Zinke-Allmang, M., Kalbitzer, S., Weiser, M. Nuclear reaction spectroscopy of vibrational modes of solids. Z. Physik A. 325 (2), 183-191 (1986).
- N, B. o. h. r. . K. Dan. Vidensk. Selsk. Mat. -Fys. Medd. 18, (1948).
- Rud, N., Bøttiger, J., Jensen, P. S. Measurements of energy-loss distributions for 6.5 MeV 15N ions in solids. Nucl. Instrum. Methods. 151 (1-2), 247-252 (1978).
- Briggs, D., Seah, M. P. . Practical Surface Analysis by Auger and X-ray Photoelectron Spectroscopy. , (1983).
- Rieder, K. H., Baumberger, M., Stocker, W. Selective Transition of Chemisorbed Hydrogen to Subsurface Sites on Pd(110). Phys. Rev. Lett. 51 (19), 1799-1802 (1983).
- Dong, W., Ledentu, V., Sautet, P., Kresse, G., Hafner, J. A theoretical study of the H-induced reconstructions of the Pd(110) surface. Surf. Sci. 377-379, 56-61 (1997).
- Wilde, M. Influence of H2-annealing on the hydrogen distribution near SiO2/Si(100) interfaces revealed by in situ nuclear reaction analysis. J. Appl. Phys. 92 (8), 4320-4329 (2002).
- Himpsel, F. J., McFeely, F. R., Taleb-Ibrahimi, A., Yarmoff, J. A., Hollinger, G. Microscopic structure of the SiO2/Si interface. Phys. Rev. B. 38 (9), 6084-6096 (1988).
- Helms, C. R., Poindexter, E. H. The silicon-silicon dioxide system: Its microstructure and imperfections. Rep. Progr. Phys. 57 (8), 791 (1994).
- Briere, M. A., Wulf, F., Braunig, D. Measurements of the accumulation of hydrogen at the silicon-silicon-dioxide interface using nuclear reaction analysis. Nucl. Instrum. Methods Phys. Res. B. 45 (1-4), 45-48 (1990).
- Ecker, K. H., Krauser, J., Weidinger, A., Weise, H. P., Maser, K. Nuclear reaction analysis of hydrogen migration in silicon dioxide films on silicon under N-15 ion irradiation. Nucl. Instrum. Methods Phys. Res. B. 161-163, 682-685 (2000).
- Maser, K. Hydrogen migration in wet-thermally grown silicon dioxide layers due to high dose 15N ion beam irradiation. Microelectron. Eng. 48, 1-4 (1999).
- Bugeat, J. P., Ligeon, E. Influence of ion beam bombardment in hydrogen surface layer analysis. Nucl. Instrum. Methods. 159 (1), 117-124 (1979).
- Wilde, M., Fukutani, K. Evaluation of non-resonant background in hydrogen depth profiling via 1H(15N,ag)12C nuclear reaction analysis near 13.35 MeV. Nucl. Instrum. Methods Phys. Res. B. 232 (1-4), 280-284 (2005).
- Horn, K. M., Lanford, W. A. Suppression of background radiation in BGO and NaI detectors used in nuclear reaction analysis. Nucl. Instrum. Methods Phys. Res. B. 45 (1-4), 256-259 (1990).
Przedruki i uprawnienia
Zapytaj o uprawnienia na użycie tekstu lub obrazów z tego artykułu JoVE
Zapytaj o uprawnieniaThis article has been published
Video Coming Soon
Copyright © 2025 MyJoVE Corporation. Wszelkie prawa zastrzeżone