
Aby wyświetlić tę treść, wymagana jest subskrypcja JoVE. Zaloguj się lub rozpocznij bezpłatny okres próbny.
Method Article
Comparison of Scale in a Photosynthetic Reactor System for Algal Remediation of Wastewater
W tym Artykule
Podsumowanie
An experimental methodology is presented to compare the performance of small (100 L) and large (1,000 L) scale reactors designed for algae remediation of landfill wastewater. System characteristics, including surface area to volume ratio, retention time, biomass density, and wastewater feed concentrations, can be adjusted based on application.
Streszczenie
An experimental methodology is presented to compare the performance of two different sized reactors designed for wastewater treatment. In this study, ammonia removal, nitrogen removal and algal growth are compared over an 8-week period in paired sets of small (100 L) and large (1,000 L) reactors designed for algal remediation of landfill wastewater. Contents of the small and large scale reactors were mixed before the beginning of each weekly testing interval to maintain equivalent initial conditions across the two scales. System characteristics, including surface area to volume ratio, retention time, biomass density, and wastewater feed concentrations, can be adjusted to better equalize conditions occurring at both scales. During the short 8-week representative time period, starting ammonia and total nitrogen concentrations ranged from 3.1-14 mg NH3-N/L, and 8.1-20.1 mg N/L, respectively. The performance of the treatment system was evaluated based on its ability to remove ammonia and total nitrogen and to produce algal biomass. Mean ± standard deviation of ammonia removal, total nitrogen removal and biomass growth rates were 0.95±0.3 mg NH3-N/L/day, 0.89±0.3 mg N/L/day, and 0.02±0.03 g biomass/L/day, respectively. All vessels showed a positive relationship between the initial ammonia concentration and ammonia removal rate (R2=0.76). Comparison of process efficiencies and production values measured in reactors of different scale may be useful in determining if lab-scale experimental data is appropriate for prediction of commercial-scale production values.
Wprowadzenie
Translation of bench-scale data to larger scale applications is a key step in the commercialization of bioprocesses. Production efficiencies in small-scale reactor systems, particularly those focusing on the use of microorganisms, have been shown to consistently over predict efficiencies occurring in commercial-scale systems 1,2,3,4. Challenges also exist in scaling up photosynthetic cultivation of algae and cyanobacteria from the laboratory scale to larger systems for the purpose of manufacturing high-value products, such as cosmetics and pharmaceuticals, for production of biofuels, and for the treatment of wastewater. The demand for large-scale algal biomass production is growing with the emerging industry for algae in biofuel, pharmaceuticals/nutraceuticals, and livestock feed 5. The methodology described in this manuscript aims to evaluate the influence of increasing scale of a photosynthetic reactor system on biomass growth rate and nutrient removal. The system presented here uses algae to remediate landfill leachate wastewater but can be adapted for a variety of applications.
Production efficiencies of large scale systems are often predicted using smaller scale experiments; however, several factors must be considered to determine the accuracy of these predictions, as scale has been shown to affect the performance of bioprocesses. For example, Junker (2004) presented results from a comparison of eight different-sized fermentation reactors, ranging from 30 L to 19,000 L, which showed that actual productivity at pilot- or commercial-scales was almost always lower than the values predicted using small-scale studies 4. Inequalities in vessel dimension, mixing power, agitation type, nutrient quality, and gas transfer were predicted to be the major causes for the decreased productivity 4. Similarly, it has been shown in algae growth reactors that biomass growth and biomass related products are nearly always reduced when scale is increased 6.
Biological, physical, and chemical factors change with the size of a reactor, with many of these factors influencing microbial activity at small scales differently than at larger scales 2,7. Since most full-scale systems for algae, such as raceway ponds, exist outdoors, one biological factor to consider is that microbial species and bacteriophages can be introduced from the surrounding environment, which may alter the microbial species present and thus the microbial function of the system. The activity of the microbial community will also be sensitive to environmental factors, such as light and temperature. Mass transfers of gasses and fluid motion are examples of physical factors that are influenced in the scale up of microbial processes. Achieving ideal mixing in small reactors is easy; however, with increasing scale, it becomes a challenge to engineer ideal-mixing conditions. At larger scales, reactors are more likely to have dead zones, non-ideal mixing, and reduced efficiencies in mass transfer 2. Since algae are photosynthetic organisms, commercial growth must account for changes in light exposure due to changes in water depth and surface area when increasing volume. High biomass density and/or low mass transfer rates can cause decreased CO2 concentrations and increased O2 concentrations, both of which may result in inhibition of biomass growth 8. Chemical factors in an algae growth system are driven by pH dynamics of the aquatic environment 2, which is consequently affected by changes in pH buffering compounds such as dissolved CO2 and carbonate species. These factors are compounded by complex interactions among the biological, physical, and chemical factors, often in unpredictable ways 9.
This study presents a paired reactor system designed to regulate and compare growth conditions in vessels of two different scales. The experimental protocol focuses on quantifying leachate treatment and algae growth; however, it could be adapted to monitor other metrics such as changes in the microbial community over time or the CO2 sequestration potential of algae. The protocol presented here is designed to evaluate the effect of scale on algal growth and nitrogen removal in a leachate treatment system.
Protokół
1. System Setup
Note: A 'paired system' refers to one aquarium tank and one raceway pond, run in parallel.
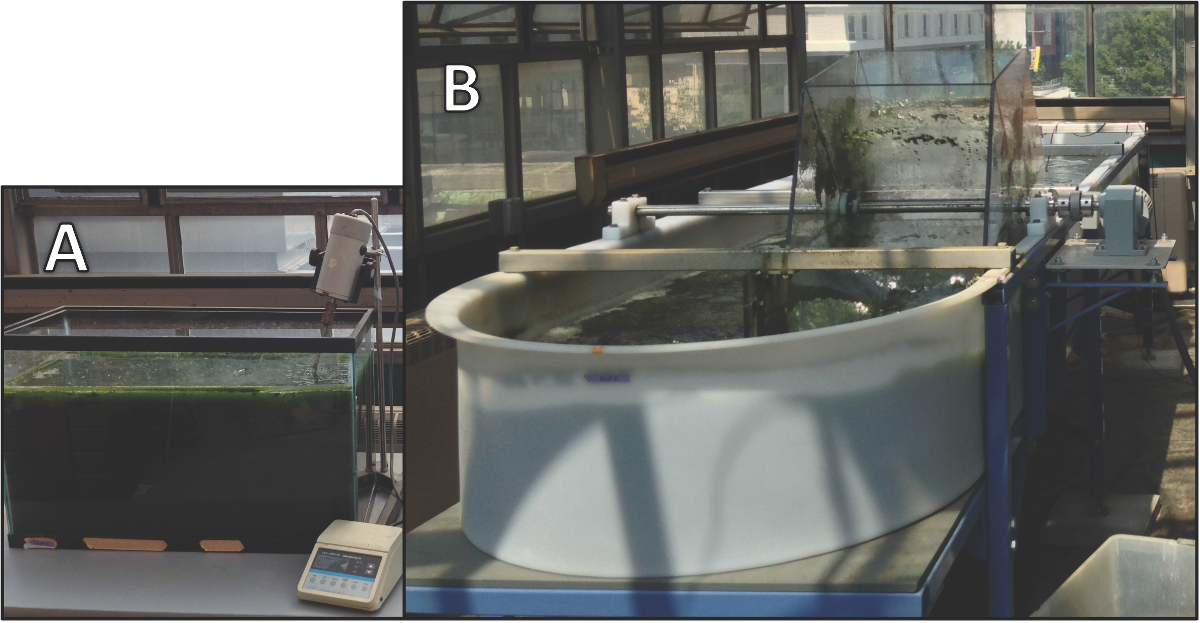
- For one paired system, use one 100 L aquaria tanks (AT), with an overhead mixer for the small-scale vessel, and one 1,000 L raceway pond (RWP), with a paddle wheel mixer for the large-scale vessel. Vessels used in this system are pictured in Figure 1.
- Inoculate all vessels with the same algae culture. Use a high density of the inoculation, resulting in a final density of no less than 0.1 g/L once diluted to the full volume in the tank or pond 10. It may take a considerable amount of time (weeks to months) to grow enough algae for this step.
- Use untreated landfill leachate as the nutrient source. Use leachate taken from a landfill that accepts mostly domestic waste and has low levels of toxins. Composition analysis for the leachate should be available from the landfill. The amount of leachate used in each tank or pond can vary depending on the strength of the wastewater, but final ammonia concentrations should measure 5-75 mg NH3-N/L.
- Start the 100 L aquaria tank with a 60 L working volume, and the raceway pond with a 600 L working volume. This study started with approximately 1 L leachate in 59 L of water in the aquaria tank, and 10 L leachate in 590 L of water in the raceway pond. Increase the concentration of leachate used over the course of this study.

Figure 1. Examples of an aquarium tank and raceway pond. An example of an aquarium tank (A) and raceway pond (B) are shown. Please click here to view a larger version of this figure.
2. Weekly Operation and Sampling
- Operate the aquaria tank and raceway pond as semi-batch reactors with hydraulic retention times of three weeks. Each sampling period spans one week.
- Take a 125 mL sample from each vessel. This is the beginning of the week sample. Test samples according to the Sample Analysis protocol in sections 3.1-3.3.
- At the end of the week, take 125 mL samples from each vessel for analysis. After the end-of-week samples have been taken, empty the entire volume of the aquarium tank into the raceway pond.
- Once per week, pump the entire volume of the aquarium tank into the raceway pond.
- Remove one-third of the volume (for an average hydraulic retention time of 3 weeks) from the raceway pond. Replace volume removed with water and untreated leachate.
- Transfer approximately 60 L from the raceway pond back into the aquarium tank. This ensures that the aquarium tank and the raceway pond are starting with the same nutrient and biological conditions each week.
- Take 125 mL samples from all vessels for the analysis of the starting conditions for the next week.
3. Sample Analysis
- Test all beginning-of-the-week and end-of-the-week samples for ammonia-N, nitrate-N, nitrite-N, and biomass density.
- Measure biomass by standard total suspended solids (TSS) protocol, ASTM-D5907, using 0.45 µm filters.
- First weigh a filter paper and then filter 20-40 mL of sample using a vacuum filtration system. Dry the biomass/filter paper in an oven at 105 °C for one hour, or until the weight of the biomass/filter paper no longer changes.
- Weigh biomass/filter paper, and subtract the initial mass of the filter paper. Divide this mass by the volume filtered to calculate the biomass density. Run in duplicate 11.
- Measure ammonia, nitrate, and nitrite spectrophotometrically using a spectrophotometer.
- Use 100 µL of sample in the commercial method kit to determine ammonia concentration. Refer to the manufacturer's protocol.
- Use 1 mL of sample in the commercial method kit to determine nitrate concentration. Refer to the manufacturer's protocol.
- Use 10 mL of sample in the commercial method kit to determine nitrite concentration. Refer to the manufacturer's protocol.
- Monitor environmental conditions (air temperature, solar radiation, wind speed) using a commercial weather station as well as tank/pond conditions (water temperature, pH, dissolved oxygen) using commercial probes and data logger. Refer to the manufacturer's protocol.
4. Statistical Analysis of Results
- Determine if the data collected is statistically normal. Determine normality of the data set using a Q-Q plot12.
- Determine correlations among parameters using Pearson's r or Spearman's p for normal and non-normal data, respectively13. Correlation parameters should include at least the following parameters: initial ammonia concentration, initial total nitrogen concentration, initial biomass density, ammonia removal rate, total nitrogen removal rate, biomass growth rate, and all environmental conditions.
Wyniki
The aim of this study is to compare the biomass growth and nutrient removal capabilities of algal cultures grown in small- and large-scale reactors. This study uses two paired systems, referred to as System 1 and System 2, to duplicate its findings. These representative results are from an 8-week period, February through April, 2016. The first raceway pond was inoculated with algae originally sourced from an outdoor pond in Philadelphia, PA 14. This culture was gro...
Dyskusje
System performance:
Over the course of an 8-week study, the productivity of the small- and large-scale vessels in a system were compared. In this study nitrogen and ammonia removal rates and biomass growth rates were used as measures of productivity of the treatment system. The system was operated as a semi-batch reactor, where each week was operated under discrete conditions. Representative results account for the first 8 weeks of system operation, however a full study would extend for much long...
Ujawnienia
The authors have nothing to disclose.
Podziękowania
The authors would like to thank the Sandtown Landfill in Felton, DE for sharing their knowledge and leachate.
Materiały
| Name | Company | Catalog Number | Comments |
| Aquarium Tank | Any 100+ L aquarium tank with optically clear glass can be used | ||
| RW 3.5 | MicroBio Engineering | Raceway Pond | |
| Eurostar 100 digital | IKA | 4238101 | Overhead mixers |
| Leachate | Sandtown Landfill | ||
| Sampling Bottles | Nalgene | Plastic or glass, lab grade, 125-200 mL | |
| Transfer Pumps | Garden type pump with drinking water quality hoses will be suitable | ||
| AmVer Salicylate Test 'N Tube | Hach | 2606945 | High Range Ammonia Tests |
| NitraVer X Nitrogen - Nitrate Reagent Set | Hach | 2605345 | High Range Nitrate Tests |
| NitriVer 2 Nitrite Reagent Powder Pillows | Hach | 2107569 | High Range Nitrite Tests |
| Hach DR2400 Spectrophotmeter | Hach | The DR2400 was discontinued, but any DR series Hach spectrophotometer can be used in this application. | |
| EMD Microbiological Analysis Membrane Filters | Millipore | HAWG047S6 | 0.45 µm filters |
Odniesienia
- Janssen, M., Tramper, J., Mur, L. R., Wijffels, R. H. Enclosed outdoor photobioreactors: light regime, photosynthetic efficiency, scale-up, and future prospects. Biotechnol. Bioeng. 81 (2), 193-210 (2003).
- Takors, R. Scale-up of microbial processes: impacts, tools and open questions. J. Biotechnol. 160 (1), 3-9 (2012).
- Sauer, M., Porro, D., Mattanovich, D., Branduardi, P. Microbial production of organic acids: expanding the markets. Trends in Biotechnol. 26 (2), 100-108 (2008).
- Junker, B. H. Scale-up methodologies for Escherichia coli and yeast fermentation processes. J. Biosci. Bioeng. 97 (6), 347-364 (2004).
- Brennan, L., Owende, P. Biofuels from microalgae-a review of technologies for production, processing, and extractions of biofuels and co-products. Renewable Sustainable Energy Rev. 14 (2), 557-577 (2010).
- Van Den Hende, S., Beelen, V., Bore, G., Boon, N., Vervaeren, H. Up-scaling aquaculture wastewater treatment by microalgal bacterial flocs: from lab reactors to an outdoor raceway pond. Bioresour. Technol. 159, 342-354 (2014).
- Hewitt, C. J., Nienow, A. W. The Scale-Up of Microbial Batch and Fed-Batch Fermentation Processes. Adv Appl Microbiol. 62, 105-135 (2007).
- Downton, W., Bishop, D., Larkum, A., Osmond, C. Oxygen Inhibition of Photosynthetic Oxygen Evolution in Marine Plants. Funct Plant Biol. 3 (1), 73-79 (1976).
- Pholchan, M. K., Baptista, J. d. C., Davenport, R. J., Curtis, T. P. Systematic study of the effect of operating variables on reactor performance and microbial diversity in laboratory-scale activated sludge reactors. Water Res. 44 (5), 1341-1352 (2010).
- Richmond, A. . Handbook of microalgal culture: biotechnology and applied phycology. , (2008).
- Clesceri, L. S., et al. . Standard Methods for the Examination of Water and Wastewater. , (1998).
- . . Statistics for Macintosh v.23.0. , (2015).
- Devore, J. L. . Probability and Statistics for Engineering and the Sciences. , (2015).
- Sniffen, K. D., Sales, C. M., Olson, M. S. Nitrogen removal from raw landfill leachate by an algae-bacteria consortium. Water Sci. Technol. 73 (3), 479-485 (2015).
- Paerl, H. W., Fulton, R., Moisander, P. H., Dyble, J. Harmful freshwater algal blooms, with an emphasis on cyanobacteria. Scientific World J. 1, 76-113 (2001).
- Abeliovich, A., Azov, Y. Toxicity of Ammonia to Algae in Sewage Oxidation Ponds. Appl. Environ. Microbiol. 31 (6), 801-806 (1976).
- Azov, Y., Goldman, J. C. Free ammonia inhibition of algal photosynthesis in intensive cultures. Appl. Environ. Microbiol. 43 (4), 735-739 (1982).
- Adamsson, M., Dave, G., Forsberg, L., Guterstam, B. Toxicity identification evaluation of ammonia, nitrite and heavy metals at the Stensund Wastewater Aquaculture Plant, Sweden. Water Sci. Technol. 38 (3), 151-157 (1998).
- Quinn, J. C., Davis, R. The potentials and challenges of algae based biofuels: a review of the techno-economic, life cycle, and resource assessment modeling. Bioresour. Technol. 184, 444-452 (2015).
- Liu, X., et al. Pilot-scale data provide enhanced estimates of the life cycle energy and emissions profile of algae biofuels produced via hydrothermal liquefaction. Bioresour. Technol. 148, 163-171 (2013).
- Van Den Hende, S., et al. Treatment of industrial wastewaters by microalgal bacterial flocs in sequencing batch reactors. Bioresour. Technol. 161, 245-254 (2014).
- Rawat, I., Kumar, R. R., Mutanda, T., Bux, F. Biodiesel from microalgae: A critical evaluation from laboratory to large scale production. Appl. Energy. 103, 444-467 (2013).
- Cloern, J. E. The relative importance of light and nutrient limitation of phytoplankton growth: a simple index of coastal ecosystem sensitivity to nutrient enrichment. Aquat Ecol. 33 (1), 3-15 (1999).
Przedruki i uprawnienia
Zapytaj o uprawnienia na użycie tekstu lub obrazów z tego artykułu JoVE
Zapytaj o uprawnieniaPrzeglądaj więcej artyków
This article has been published
Video Coming Soon
Copyright © 2025 MyJoVE Corporation. Wszelkie prawa zastrzeżone