
Aby wyświetlić tę treść, wymagana jest subskrypcja JoVE. Zaloguj się lub rozpocznij bezpłatny okres próbny.
Method Article
Estimating Sediment Denitrification Rates Using Cores and N2O Microsensors
W tym Artykule
Podsumowanie
This method estimates sediment denitrification rates in sediment cores using the acetylene inhibition technique and microsensor measurements of the accumulated N2O. The protocol describes procedures for collecting the cores, calibrating the sensors, performing the acetylene inhibition, measuring the N2O accumulation, and calculating the denitrification rate.
Streszczenie
Denitrification is the primary biogeochemical process removing reactive nitrogen from the biosphere. The quantitative evaluation of this process has become particularly relevant for assessing the anthropogenic-altered global nitrogen cycle and the emission of greenhouse gases (i.e., N2O). Several methods are available for measuring denitrification, but none of them are completely satisfactory. Problems with existing methods include their insufficient sensitivity, and the need to modify the substrate levels or alter the physical configuration of the process using disturbed samples.This work describes a method for estimating sediment denitrification rates that combines coring, acetylene inhibition, and microsensor measurements of the accumulated N2O. The main advantages of this method are a low disturbance of the sediment structure and the collection of a continuous record of N2O accumulation; these enable estimates of reliable denitrification rates with minimum values up to 0.4-1 µmol N2O m-2 h-1. The ability to manipulate key factors is an additional advantage for obtaining experimental insights. The protocol describes procedures for collecting the cores, calibrating the sensors, performing the acetylene inhibition, measuring the N2O accumulation, and calculating the denitrification rate. The method is appropriate for estimating denitrification rates in any aquatic system with retrievable sediment cores. If the N2O concentration is above the detection limit of the sensor, the acetylene inhibition step can be omitted to estimate the N2O emission instead of denitrification. We show how to estimate both actual and potential denitrification rates by increasing nitrate availability as well as the temperature dependence of the process. We illustrate the procedure using mountain lake sediments and discuss the advantages and weaknesses of the technique compared to other methods. This method can be modified for particular purposes; for instance, it can be combined with 15N tracers to assess nitrification and denitrification or field in situ measurements of denitrification rates.
Wprowadzenie
Anthropogenic alteration of the nitrogen cycle is one of the most challenging problems for the Earth system1. Human activity has at least doubled the levels of reactive nitrogen available to the biosphere2. However, there remain large uncertainties regarding how the global N cycle is evaluated. A few flux estimates have been quantified with less than ±20% error, and many have uncertainties of ±50% and larger3. These uncertainties indicate the need for accurate estimations of denitrification rates across ecosystems and an understanding of the underlying mechanisms of variation. Denitrification is a microbial activity through which nitrogenous oxides, mainly nitrate and nitrite, are reduced to dinitrogen gasses, N2O and N24. The pathway is highly relevant to the biosphere availability of reactive nitrogen because it is the primary process of removal5. N2O is a greenhouse gas with a warming potential nearly 300 times that of CO2 over 100 years, and it is the current major cause of stratospheric ozone depletion due to the large quantities being emitted6,7.
In the following, we present a protocol for estimating sediment denitrification rates using cores and N2O microsensors experimentally (Figure 1). Denitrification rates are estimated using the acetylene inhibition method8,9 and measurements of the accumulation of N2O during a defined period (Figure 2 and Figure 3). We demonstrate the method by applying it to mountain lake sediments. This case study highlights the performance of the method for detecting relatively low rates with minimal disturbance to the physical structure of the sediments.
Denitrification is particularly difficult to measure10. There are several alternative approaches and methods, each with advantages and disadvantages. Drawbacks to available methods include their use of expensive resources, insufficient sensitivity, and the need to modify the substrate levels or alter the physical configuration of the process using disturbed samples10. An even more fundamental challenge to measuring N2 is its elevated background levels in the environment10. The reduction of N2O to N2 is inhibited by acetylene (C2H2)8,9. Thus, denitrification can be quantified by measuring the accumulated N2O in the presence of C2H2, which is feasible due to low environmental N2O levels.
The use of C2H2 to measure denitrification rates in sediments was developed about 40 years ago11, and the incorporation of N2O sensors occurred about 10 years later12. The most widely applied acetylene-based approach is the "static core". The accumulated N2O is measured during an incubation period of up to 24 h after the C2H2 is added to the headspace of the sealed sediment core10. The method described here follows this procedure with some innovations. We add the C2H2 by bubbling the gas in the water phase of the core for some minutes, and we fill all the headspace with sample water before measuring the accumulation of N2O with a microsensor. We also include a stirring system that prevents the stratification of the water without resuspending the sediment. The procedure quantifies the denitrification rate per sediment surface area (e.g., µmol N2O m-2 h-1).
The high spatial and temporal variation of denitrification presents another difficulty in its accurate quantification10. Usually, N2O accumulation is measured sequentially by gas chromatography of headspace samples that are collected during the incubation. The method described provides improved monitoring of the temporal variation of the N2O accumulation, because the microsensor provides a continuous signal. The microsensor multimeter is a digital microsensor amplifier (picoammeter) that interfaces with the sensor(s) and the computer (Figure 1a). The multimeter allows several N2O microsensors to be used at the same time. For instance, up to four sediment cores from the same study site can be measured simultaneously to account for the spatial variability.
The core approach barely disturbs the sediment structure compared to some other methods (e.g., slurries). If the integrity of the sediments is altered, this leads to unrealistic denitrification rates13 that are only adequate for relative comparisons. Higher rates are always obtained with slurry methods compared to core methods14, because the latter preserves the limitation of denitrification by substrate diffusion15. Slurry measures cannot be considered representative of in situ rates16; they provide relative measures for comparisons made with the exact same procedure.
The method described is appropriate for estimating denitrification rates in any sediment type that can be cored. We particularly recommend the method for performing experimental manipulations of some of the driving factors. Examples are experiments that modify nitrate availability and temperature as needed for estimating the energy activation (Ea) of denitrification17 (Figure 2).

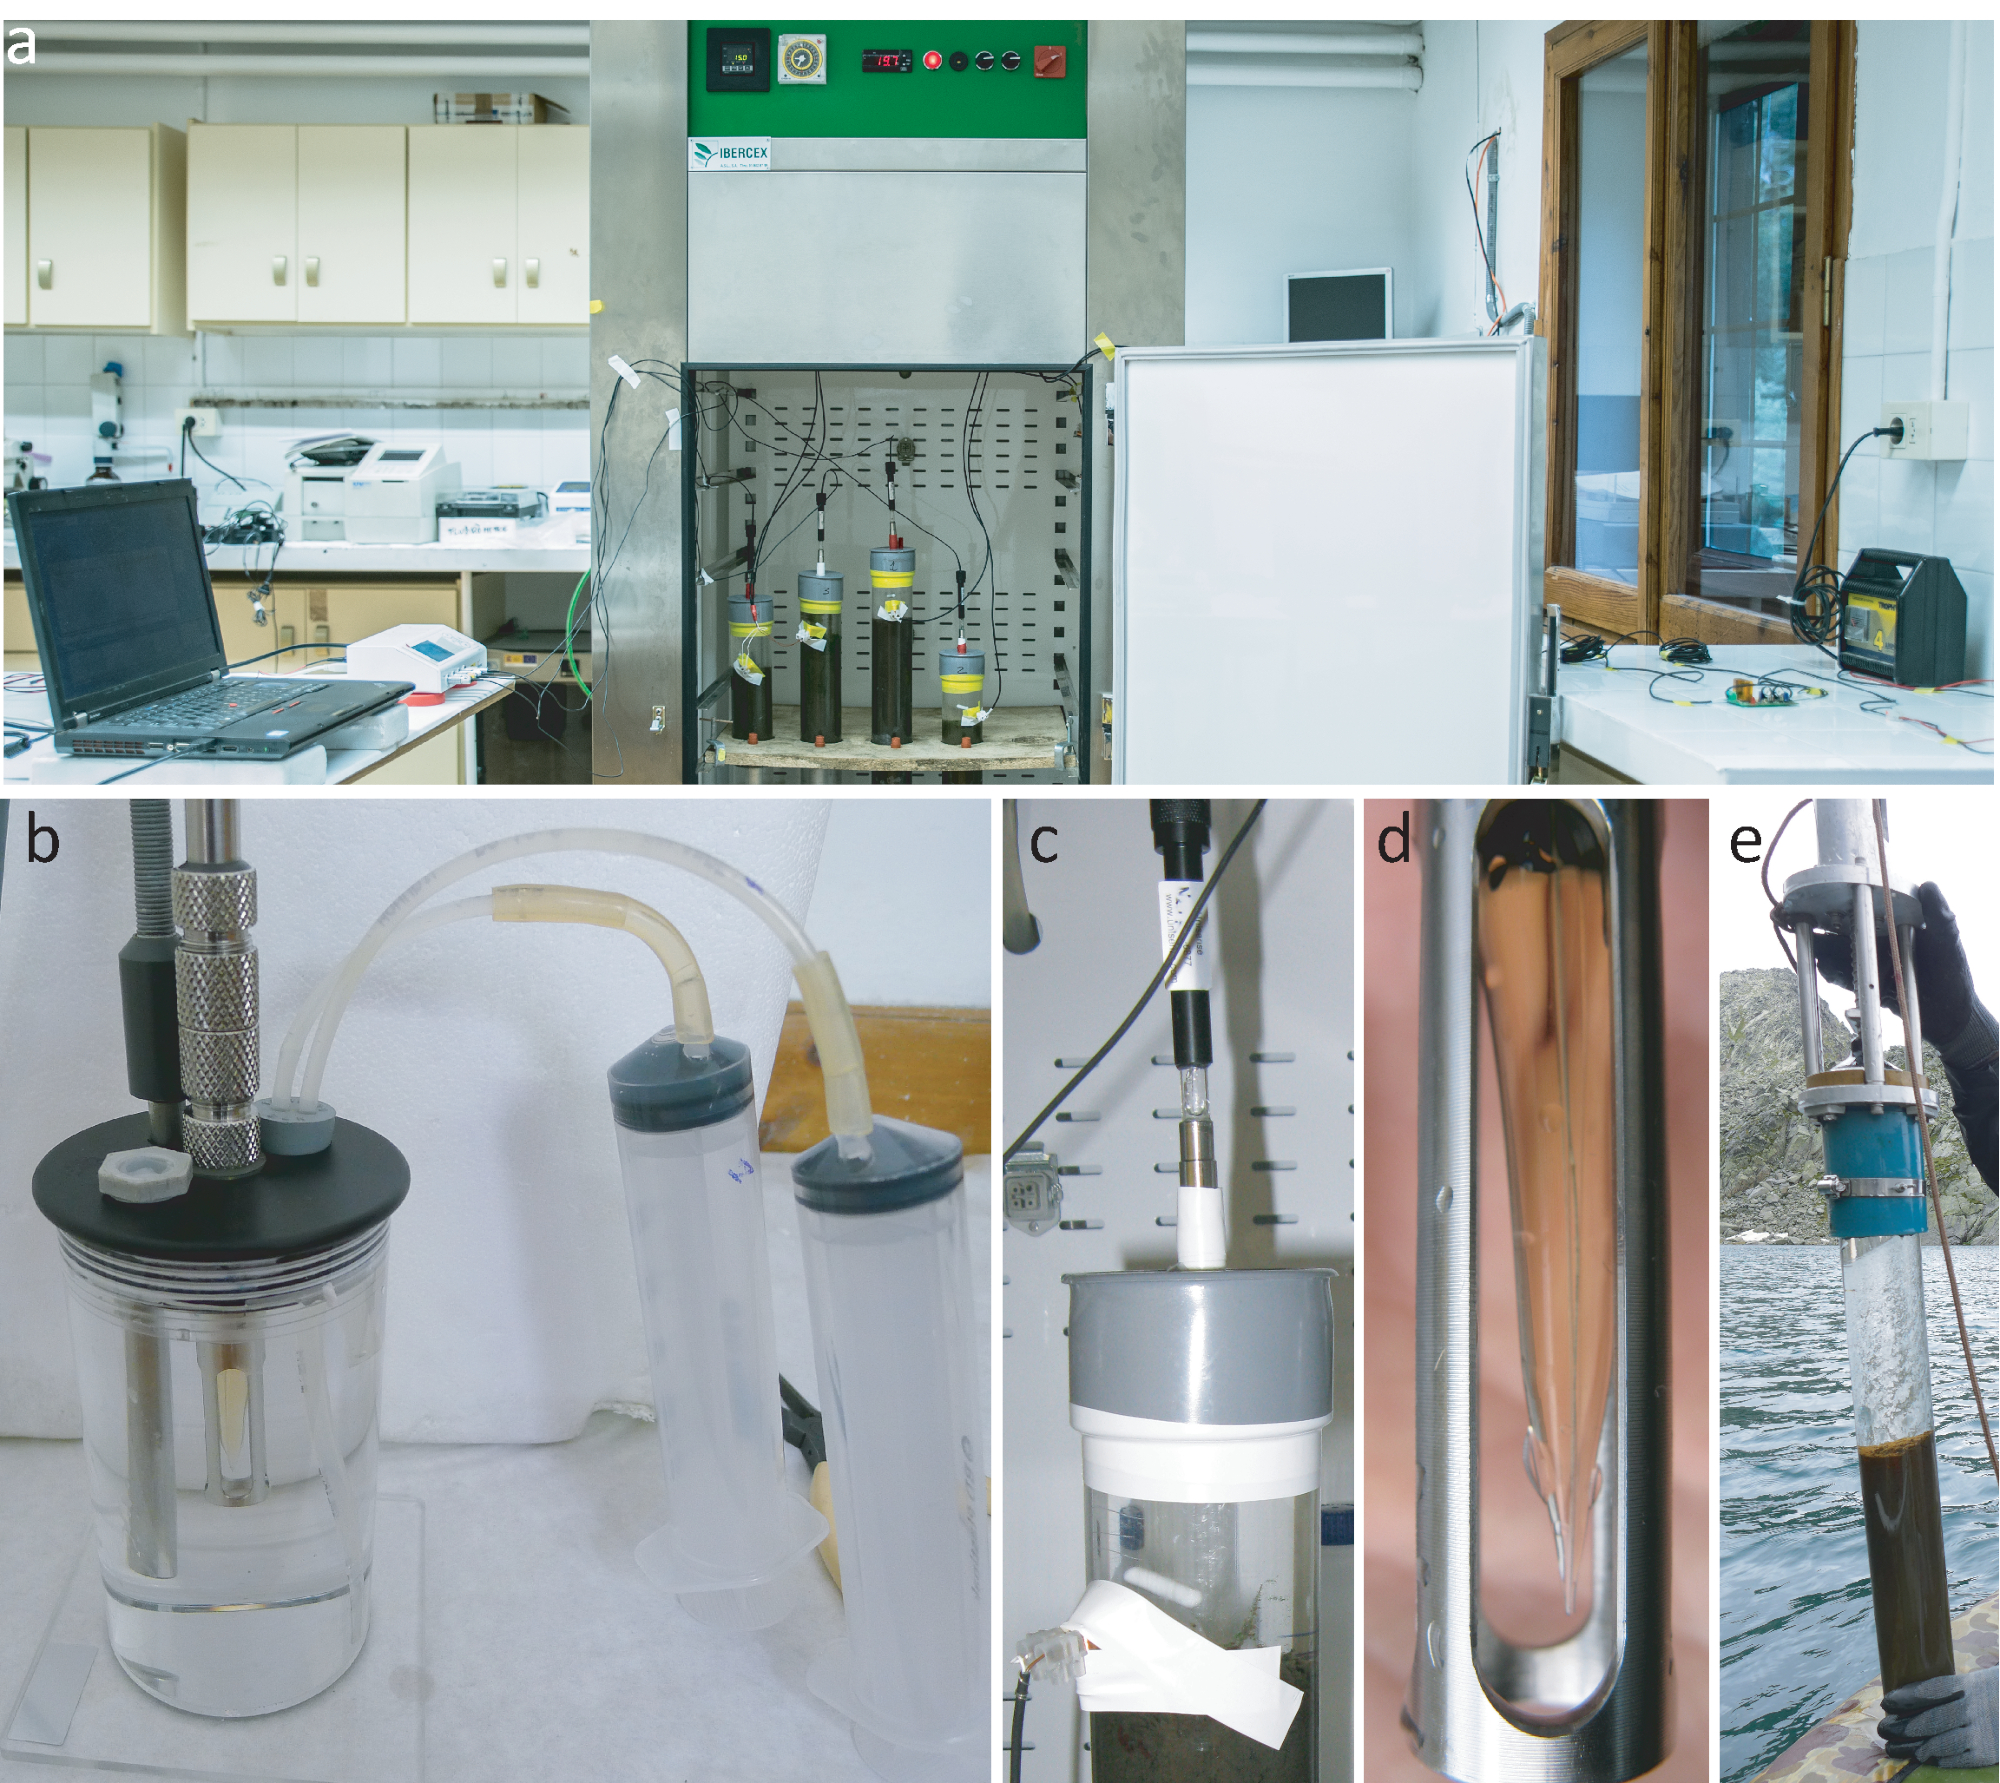
Figure 1: Experimental setup. (a) General experimental setup to estimate sediment denitrification rates using cores and N2O microsensors. The incubation chamber ensures darkness and controlled-temperature (±0.3 °C) conditions. Five intact sediment cores can be processed simultaneously using their respective N2O sensors. (b) N2O sensor calibration chamber. We adapted it with rubber stoppers and syringes to mix the N2O water (see protocol step 3.4.3). There is a thermometer to control the water temperature. (c) Close-up of a sediment core sample with the sensor inserted into the central hole of the PVC cover and the joints sealed with adhesive tape. The stirrer is hanging in the water, and the electromagnet is close to it and fixed to the external part of the acrylic tube. (d) Close-up of the N2O microsensor tip protected by a metal piece. (e) A sediment core that has just been recovered. It was sampled from a boat in a deep lake; the acrylic tube with the core is still fixed to the messenger-adapted gravity corer19. See the Table of Materials for all the items needed to perform this method. Please click here to view a larger version of this figure.
Protokół
1. Preparation
NOTE: Begin this on the day before the measurements are taken.
- Assemble the measurement setup (Figure 1a, see the Table of Materials).
NOTE: To ensure a constant and high-quality power supply, the measurement device is connected to the grip via an uninterruptible power supply (UPS) that can also act as a backup. In the case of a long-duration power failure, a car battery serve as an extra power source. - Start the sensor's software and apply a -0.8 V voltage to polarize the N2O microsensors. The signal shows a rapid descent and a subsequent rise, then it finally decreases until it is low and stable.
NOTE: The microsensor manufacturer recommends polarization at least overnight (or longer) to ensure the stability of the sensor's signal. Another recommendation is to keep the sensor polarized if measurements are planned for multiple or consecutive days18. - Switch on the incubation chamber and adjust the experimental conditions (e.g., selected light off and temperature set to be similar to that expected in the field). Place a container with deionized water inside the chamber so that water is available later at the measurement temperature for calibration of the sensors.
NOTE: This step can be done the same day of the planned measurements, before the departure to collect the cores. For standard measurements, it is advisable to use dark conditions. - Pack the field core collection materials: corer device, sampling tubes, rubber stoppers, polyvinyl chloride (PVC) taps, screwdriver, global positioning system (GPS) unit, thermometer, handheld sounder, wader, and inflatable boat (see the Table of Materials). Use a checklist to ensure that all materials are included.
2. Sediment Core Collection
- Depending on the water depth, follow 2.1.1 or 2.1.2.
- For deep water bodies
- Use a messenger-adapted gravity corer19 from a boat or a platform (Figure 1e).
- Fix the sampling tube (acrylic, ø 6.35 cm, length ≥ 50 cm) to the corer with a screwdriver.
- Select the sampling point according to the investigation aims. Take note of the position (e.g., using GPS coordinates) and measurement depth (e.g., using a handheld sounder). If sampling from a boat, use an anchor (e.g., a bag with stones) to avoid drifting during core collection.
- Deploy the coring system until the sampling tube is ~1 m from the sediment. Use a rope with regular marks (e.g., intervals of 1 m) to control the depth position of the sampling equipment.
- Stabilize the sampling equipment for 60 s (e.g., to minimize the movement of the boat). This will ensure the correct sediment penetration and recovery of a scarcely disturbed sediment core.
- Release ~1 m more rope so that the sampling tube penetrates the sediment. Be aware that if the sampling tube penetrates too much, it can disturb the water/sediment interface.
- Release the messenger while trying to keep tension in the rope so that the corer remains fixed and in a vertical position. When the messenger impacts the corer, a small difference can be felt in the tension of the rope. At that time, close the corer to generate the vacuum that allows for recovery of the sediment core.
- Recover the corer by pulling the rope constantly and gently.
- Once the core is close to the surface but still entirely submerged (including the rubber part of the corer that ensures the vacuum), place a rubber stopper at the bottom of the sampling tube. Inspect the water/sediment interface; it should be clear and not visibly disturbed (Figure 1e). If this is not the case, discard the core, clean the tube, and repeat steps 2.1.1.4-9.
- Uplift the entire coring system from the water. Release the sampling tube from the corer and place a PVC cover on the top. Seal it with adhesive tape. Avoid the formation of air space.
- For littoral habitats and shallow water bodies
- Dress in a wader for sampling in very shallow waters (<0.6 m).
- Use snorkeling or scuba gear for deeper sampling (up to 3 m).
- Select the sampling point according to the investigation aims. Take note of the position (e.g., GPS coordinates). Manually, insert the sampling tube (e.g., acrylic, ø 6.35 cm) into the sediment.
- Place a rubber stopper in the top side of the sampling tube to obtain a vacuum.
- Remove the core from the sediment and quickly introduce another rubber stopper at the tube bottom.
NOTE: It is necessary to work with the tube underwater at all times; at very shallow sites, we recommend shortening the tube down to 20 cm. Sometimes the sediment has a high water content and drains when the tube is removed from the sediment bed. In this case, it is necessary to introduce the bottom stopper without uplifting the core outside the sediment. To do this, manually immerse the stopper in the sediment around the tube and place it carefully to close the bottom of the tube. - Out of the water, substitute the topside rubber stopper with a PVC cover and seal the junction with adhesive tape.
- For deep water bodies
- Protect the core during its transfer to the laboratory by minimizing rotations and shaking.
3. Calibration of the Nitrous Oxide (N2O) Microsensors
- Using the computer (strip chart, sensor software), check that the sensor's signal is stable and low (<20 mV).
- Create a new file (e.g., with the date and the sampling site (130903_Redon_Lake)) to record the calibration values and sensor signals.
NOTE: The sensor signals are sensitive to temperature (Figure 4). Use the same temperature for the measurements and the sensor calibration. The sensor responds linearly between 0%-2.5% N2O20. Therefore, a two-point calibration is sufficient18. - For the calibration value with zero nitrous oxide, read the sensor signal keeping the sensor tip submersed in N2O-free water (deionized).
- Calibrate with N2O water at the desired concentration.
NOTE: Prepare water with a defined N2O concentration, which will slightly exceed the maximum concentration expected during incubation. We use ~25 µM N2O as the calibration value. Be aware of not exceeding the maximum sensor range concentration of 500 N2O µM.- Obtain N2O-saturated water by bubbling N2O in deionized water for a few minutes.
NOTE: The N2O water solubility depends on temperature and salinity21; see the table in the appendix of the sensor manual18. - Dilute the N2O saturated water by adding a certain volume of saturated N2O water to a volume of deionized water. For example, at 20 °C, add 0.3 mL of saturated N2O water, which has a concentration of 28.7 mM N2O, to a total of 375 mL of water to obtain a 22.9 µM N2O concentration. Note that 375 mL is the total volume of the calibration chamber (Figure 1b).
- After gently mixing the N2O saturated water with deionized water in the calibration vessel to dilute it to the desired concentration, read the sensor signal when it is constant. This reading is the calibration value with X µM N2O water. When mixing the solution, be careful not to generate bubbles, as this would eliminate N2O from the calibration solution.
NOTE: Be aware that the N2O in the water will slowly escape into the air; thus, the prepared calibration solution can only be used for a few minutes.
- Obtain N2O-saturated water by bubbling N2O in deionized water for a few minutes.
4. Core Preparation and Acetylene Inhibition
- Change the PVC cover located at the top of each sediment core by another cover with a hole in the center and a hanging magnetic stirrer. Re-seal the junction with adhesive tape.
- Reduce the water phase of each sample to an approximate height of 12 cm (volume ≈ 380 mL). For this, first insert a silicone tube in the central hole.Then, put the sediment core in a cylinder and push the bottom stopper to create pressure. The stopper and sediment sample go up, and the excess water passes through the tube. Collect the water in a recipient vessel.
NOTE: Samples with coarse granularity can be problematic during this step. Sediment particles placed between the stopper and the tube can deform the stopper and open a hole through which air bubbles can pass and disturb the sample. To avoid this problem, put the cylinder in the center of the bottom stopper and try to push with a constant force. The joint between the silicone tube used to evacuate the excess water and the PVC cover consists of a solid part (e.g., a 5 mL pipette tip without its narrowest end) inserted in the silicone tube. - Perform the acetylene inhibition by bubbling with acetylene gas in the water phase of the core for approximately 10 min . Avoid resuspending the sediment.
NOTE: As a possible modification of the method, add a substrate (nitrate) through a concentrated liquid medium before bubbling acetylene for potential denitrification measurements (e.g., as in Figure 3b, c).
5. Denitrification (N2O accumulation measure)
- Fill all the air space in the sample with the previous leftover water. Place the sensor in the sediment core through the central hole of the topside PVC cover. The tip of the sensor should be located in the water phase above the stirrer (Figure 1c).
NOTE: All the joints of the acrylic sampling tube must be sealed to avoid gas and water leaks during the measurement (Figure 1a, c). In the bottom part of the tube, the rubber stopper is sufficient for this. Sealing the topside part is more difficult. The PVC cover must be tuned. It must be heated with a torch; then, when the material becomes flexible but is not scorched, the cover is placed in the tube so that its shape can be molded. After cooling, the cover needs more modifications (with the exception of the cover used to transport the samples to the laboratory in steps 2.1.1.10 or 2.1.2.6). The central hole where the sensor is inserted must be drilled. The stirrer can be held with a fishing line, which in turn is adhered with glue to the inside of the cover so that the stirrer hangs on the fishing line in the water (Figure 1c). Also, all the joints (PVC cover tube and PVC cover sensor) are sealed with adhesive tape. Place elastic adhesive tape to adjust the diameter of the sensor in order to seal the contact surface between the central hole of the PVC cover and the sensor (Figure 1c). - Switch on the electromagnetic pulse circuit that is part of the stirring system.
NOTE: The stirring system prevents the stratification of the water phase without disturbing (resuspending) the sediment. The stirring system consists of a circuit that switches on/off the electromagnet that attracts/releases the magnetic stirrer (see the Table of Materials for a detailed description). - Move the electromagnet around the external part of the acrylic tube until the stirrer moves continuously, and then fix it in place using adhesive tape (Figure 1c).
- Close the incubation chamber to ensure a constant temperature (e.g., variation of ±0.3 °C).
- Press the record button (sensor software) to start recording the sensor signal. Readings are typically recorded every 5 min.
- Press the stop button at the end of the measurement period.
6. Final Measurement Steps
- Wait at least ~10 min with the sensor's tip submerged in free-N2O water (deionized) before reading the signal of the zero N2O calibration measure.
- Perform a final sensor calibration. For this, repeat the sensor calibration, following Section 3 but starting with step 3.3.
- Save the file (sensor software).
7. Denitrification Rate Calculations
- Start with the tabulated output file generated by the sensor software that contains the record of the sensor's signal in mV and µM N2O, and the calibration data.
- Plot the sensor signal against time to visualize the N2O accumulation trend (e.g., Figure 2a).
- Use only the time range with a linear accumulation, excluding the initial acclimation period of the sample and a possible final saturation due to substrate limitation (e.g., Figure 2b). Create a linear model of the sensor signal (µM) over time (h) .
Note: The slope is the denitrification rate (µM N2O core-1 h-1), which, if divided by the area of the core (πr2), transforms into the rate in µM N2O m-2 h-1, and when multiplied by the water volume (πr2h, where h is the height of the water phase and r is the inner radius of the acrylic tube, in this case 0.12 m and 0.03175 m, respectively) transforms into the rate in µmol N2O m-2 h-1.
Wyniki
A total of 468 denitrification rates were estimated using the protocol above in sediments from Pyrenean mountain lakes over the period 2013-2014. We show some of these results to illustrate the procedure (Figure 2 and Figure 3). In general, the linear model between the N2O concentration and time has good correlation (R2 ≥ 0.9). The slope of the relationship provides an estimate of the denitrificat...
Dyskusje
The main advantages of the described method are the use of minimally disturbed sediment core samples and the continuous recording of the N2O accumulation. These allow estimation of relatively low denitrification rates that are likely similar to those occurring in situ. Nonetheless, some aspects concerning the coring, sensor performance, and potential improvements are discussed.
An apparently simple but critical step of the method is good core recovery. The sediment/water in...
Ujawnienia
The authors have nothing to disclose.
Podziękowania
The Spanish Government provided funds through the Ministerio de Educación as a predoctoral fellowship to C.P-L. (FPU12-00644) and research grants of the Ministerio de Economia y Competitividad: NitroPir (CGL2010-19737), Lacus (CGL2013-45348-P), Transfer (CGL2016-80124-C2-1-P). The REPLIM project (INRE - INTERREG Programme. EUUN - European Union. EFA056/15) supported the final writing of the protocol.
Materiały
| Name | Company | Catalog Number | Comments |
| Messenger-adapted gravity corer | - | - | Reference in the manuscript. Made by Glew, J. |
| Sampling tube | - | - | Acrylic. Dimensions: 100 cm (h) × 6.35 cm (d) × 6.50 cm (D). Sharpen the edge of the sampling tube that penetrates into the sediment to minimize the disturbance in the recovered sediment core sample. |
| Handheld sounder | Plastimo | 38074 | Echotest II Depth Sounder. |
| Rubber stopper | VWR | DENE1012114 | With two holes, used to mix the N2O-water in the calibration chamber. Dimensions: 20 mm (h) × 14 mm (d) × 18 mm (D) (3 mm hole (D)). |
| Rubber stopper | VWR | 217-0125 | To seal the bottom part of the methacrylate tube and to sample in shallow water bodies. Dimensions: 45 mm (h) × 56 mm (d) × 65 mm (D). |
| Rubber stopper | VWR | 217-0126 | Place the rubber stopper in the top side of the sampling tube to obtain a vacuum for sampling in littoral zones and shallow water bodies. Dimensions: 50 mm (h) x 60 mm (d) x 70 mm (D). |
| PVC cover | - | - | To seal the top side part of the acrylic tube. Dimensions: 45 mm (h) × 56 mm (d) × 65 mm (D). Dimensions: 65 mm (D). |
| Adhesive tape | - | - | Waterproof. To ensure all joints (PVC cover sampling tube and PVC cover sensor) and to avoid water leaks. |
| Thermometer | - | - | Portable and waterproof, to measure the temperature in the water overlying the sediment just after sampling the cores. |
| GPS | - | - | To save the location of a new sampling site or to arrive at a previous site. |
| Wader | - | - | For littoral or shallow site samplings. |
| Boat | - | - | An inflatable boat is the best option for its lightness if the sampling site is not accessible by car. |
| Rope | - | - | Rope with marks showing its length (e.g., marked with a color code to distinguish each meter). |
| N2O gas bottle and pressure reducer | Abelló Linde | 32768-100 | Gas bottle reference. |
| C2H2 gas bottle and pressure reducer | Abelló Linde | 32468-100 | Gas bottle reference. |
| Tube used to evacuate the excess of water | - | - | Consists of a solid part (e.g., a 5 ml pipette tip without its narrowest end) inserted in a silicone tube. |
| Nitrous Oxide Minisensor w/ Cap | Unisense | N2O-R | We use 4 sensors at a time. |
| Microsensor multimeter 4 Ch. 4 pA channels | Unisense | Multimeter | Picoammeter logged to a laptop. The standard device allows for 2 sensor picoammeter connections (e.g., N2O sensor), one pH/mV and a thermometer. We ordered a device with four picoammeter connections, allowing the use of 4 N2O sensors simultaneously. |
| SensorTrace Basic 3.0 Windows software | Unisense | Sensor data acquisition software. | |
| Calibration Chamber incl. pump | Unisense | CAL300 | Calibration chamber. We tuned it with rubber stoppers and syringes to mix the N2O-water without making bubbles. |
| Incubation chamber | Ibercex | E-600-BV | Indispensable equipment for working at a constant temperature (±0.3 °C). It also allows control of the photoperiod. |
| Electric stirrer | - | - | Part of the stirring system. It hangs in the water, overlying the sediment subject, by a fishing line that is hooked to the PVC cover. |
| Electromagnet | - | - | Part of the stirring system. It is fixed to the outside of the acrylic tube, approximately at the same level as the stirrer. It is activated episodically (ca. 1 on-off per s) by a circuit, attracting the stirrer when it is on and releasing it when it is off, thereby generating the movement that agitates the water. |
| Electromagnetic pulse circuit | - | - | Part of the stirring system. It is connected by wires to the electromagnet and sends pulses of current that turn the electromagnet on and off. |
| Uninterruptible power supply (UPS) | - | - | It improves the quality of the electrical energy that reaches the measurement device, filtering the highs and low of the voltage, thereby ensuring a more constant and stable N2O sensor signal. |
Odniesienia
- Rockstrom, J., et al. A safe operating space for humanity. Nature. 461 (7263), 472-475 (2009).
- Erisman, J. W., Galloway, J., Seitzinger, S., Bleeker, A., Butterbach-Bahl, K. Reactive nitrogen in the environment and its effect on climate change. Current Opinion in Environmental Sustainability. 3 (5), 281-290 (2011).
- Gruber, N., Galloway, J. N. An Earth-system perspective of the global nitrogen cycle. Nature. 451 (7176), 293-296 (2008).
- Tiedje, J. M., Zehnder, A. J. B. Ch. 4. Ecology of denitrification and dissimilatory nitrate reduction to ammonium. Environmental Microbiology of Anaerobes. Vol. 717. , 179-244 (1988).
- Seitzinger, S., et al. Denitrification across landscapes and waterscapes: A synthesis. Ecological Applications. 16 (6), 2064-2090 (2006).
- Contribution of Working Group I to the fifth assessment report of the intergovernmental panel on climate change. . IPCC. Climate Change 2013: The Physical Science Basis. , (2013).
- Ravishankara, A. R., Daniel, J. S., Portmann, R. W. Nitrous Oxide (N2O): The Dominant Ozone-Depleting Substance Emitted in the 21st Century. Science. 326 (5949), 123-125 (2009).
- Balderston, W. L., Sherr, B., Payne, W. Blockage by acetylene of nitrous oxide reduction in Pseudomonas perfectomarinus. Applied and Environmental Microbiology. 31 (4), 504-508 (1976).
- Yoshinari, T., Knowles, R. Acetylene inhibition of nitrous-oxide reduction by denitrifying bacteria. Biochemical and Biophysical Research Communications. 69 (3), 705-710 (1976).
- Groffman, P. M., et al. Methods for measuring denitrification: Diverse approaches to a difficult problem. Ecological Applications. 16 (6), 2091-2122 (2006).
- Sorensen, J. Denitrification rates in a marine sediment as measured by the acetylene inhibition technique. Applied and Environmental Microbiology. 36 (1), 139-143 (1978).
- Revsbech, N. P., Nielsen, L. P., Christensen, P. B., Sorensen, J. Combined oxygen and nitrous-oxide microsensor for denitrification studies. Applied and Environmental Microbiology. 54 (9), 2245-2249 (1988).
- Jorgensen, K. S. Annual pattern of denitrification and nitrate ammonification in estuarine sediment. Applied and Environmental Microbiology. 55 (7), 1841-1847 (1989).
- Laverman, A. M., Van Cappellen, P., van Rotterdam-Los, D., Pallud, C., Abell, J. Potential rates and pathways of microbial nitrate reduction in coastal sediments. FEMS Microbiology Ecology. 58 (2), 179-192 (2006).
- Ambus, P. Control of denitrification enzyme-activity in a streamside soil. FEMS Microbiology Ecology. 102 (3-4), 225-234 (1993).
- Christensen, P. B., Rysgaard, S., Sloth, N. P., Dalsgaard, T., Schwærter, S. Sediment mineralization, nutrient fluxes, denitrification and dissimilatory nitrate reduction to ammonium in an estuarine fjord with sea cage trout farms. Aquatic Microbial Ecology. 21 (1), 73-84 (2000).
- Palacin-Lizarbe, C., Camarero, L., Catalan, J. Denitrification Temperature Dependence in Remote, Cold, and N-Poor Lake Sediments. Water Resources Research. 54 (2), 1161-1173 (2018).
- . . Nitrous Oxide sensor user manual. , (2011).
- Glew, J. Miniature gravity corer for recovering short sediment cores. Journal of Paleolimnology. 5 (3), 285-287 (1991).
- Andersen, K., Kjaer, T., Revsbech, N. P. An oxygen insensitive microsensor for nitrous oxide. Sensors and Actuators B-Chemical. 81 (1), 42-48 (2001).
- Weiss, R. F., Price, B. A. Nitrous oxide solubility in water and seawater. Marine Chemistry. 8 (4), 347-359 (1980).
- . . Nitrous Oxide Microsensors Specifications. , (2018).
- Koike, I., Revsbech, N. P., Sørensen, J. Ch. 18. Measurement of sediment denitrification using 15-N tracer method. Denitrification in Soil and Sediment 10.1007/978-1-4757-9969-9 F.E.M.S. Symposium Series. , 291-300 (1990).
- Hvorslev, M. J. . Subsurface Exploration and Sampling of Soils for Civil Engineering Purposes. , 521 (1949).
- Glew, J. R., Smol, J. P., Last, W. M., Last, W. M., Smol, J. P. Ch. 5. Sediment Core Collection and Extrusion. Tracking Environmental Change Using Lake Sediments: Basin Analysis, Coring, and Chronological Techniques. 1, 73-105 (2001).
- Behrendt, A., de Beer, D., Stief, P. Vertical activity distribution of dissimilatory nitrate reduction in coastal marine sediments. Biogeosciences. 10 (11), 7509-7523 (2013).
- Laverman, A. M., Meile, C., Van Cappellen, P., Wieringa, E. B. A. Vertical distribution of denitrification in an estuarine sediment: Integrating sediment flowthrough reactor experiments and microprofiling via reactive transport modeling. Applied and Environmental Microbiology. 73 (1), 40-47 (2007).
- Melton, E. D., Stief, P., Behrens, S., Kappler, A., Schmidt, C. High spatial resolution of distribution and interconnections between Fe- and N-redox processes in profundal lake sediments. Environmental Microbiology. 16 (10), 3287-3303 (2014).
- . . SensorTrace BASIC 3.0 user manual. , (2010).
- Schwing, P. T., et al. Sediment Core Extrusion Method at Millimeter Resolution Using a Calibrated, Threaded-rod. Journal of visualized experiments. (114), 54363 (2016).
- Bernhardt, E. S. Ecology. Cleaner lakes are dirtier lakes. Science. 342 (6155), 205-206 (2013).
- Finlay, J. C., Small, G. E., Sterner, R. W. Human influences on nitrogen removal in lakes. Science. 342 (6155), 247-250 (2013).
- Seitzinger, S. P. Denitrification in fresh-water and coastal marine ecosystems- ecological and geochemical significance. Limnology and Oceanography. 33 (4), 702-724 (1988).
- Seitzinger, S. P., Nielsen, L. P., Caffrey, J., Christensen, P. B. Denitrification measurements in aquatic sediments - a comparison of 3 methods. Biogeochemistry. 23 (3), 147-167 (1993).
- Christensen, P. B., Nielsen, L. P., Revsbech, N. P., Sorensen, J. Microzonation of denitrification activity in stream sediments as studied with a combined oxygen and nitrous-oxide microsensor. Applied and Environmental Microbiology. 55 (5), 1234-1241 (1989).
- Peter, N. L. Denitrification in sediment determined from nitrogen isotope pairing. FEMS Microbiology Ecology. 9 (4), 357-361 (1992).
- Risgaard-Petersen, N., Nielsen, L. P., Rysgaard, S., Dalsgaard, T., Meyer, R. L. Application of the isotope pairing technique in sediments where anammox and denitrification coexist. Limnology and Oceanography-Methods. 1, 63-73 (2003).
Przedruki i uprawnienia
Zapytaj o uprawnienia na użycie tekstu lub obrazów z tego artykułu JoVE
Zapytaj o uprawnieniaThis article has been published
Video Coming Soon
Copyright © 2025 MyJoVE Corporation. Wszelkie prawa zastrzeżone