
Aby wyświetlić tę treść, wymagana jest subskrypcja JoVE. Zaloguj się lub rozpocznij bezpłatny okres próbny.
Method Article
Measurement of the Directional Information Flow in fNIRS-Hyperscanning Data using the Partial Wavelet Transform Coherence Method
W tym Artykule
Podsumowanie
This protocol describes partial wavelet transform coherence (pWTC) for calculating the time-lagged pattern of interpersonal neural synchronization (INS) to infer the direction and temporal pattern of information flow during social interaction. The effectiveness of pWTC in removing the confounds of signal autocorrelation on INS was proved by two experiments.
Streszczenie
Social interaction is of vital importance for human beings. While the hyperscanning approach has been extensively used to study interpersonal neural synchronization (INS) during social interactions, functional near-infrared spectroscopy (fNIRS) is one of the most popular techniques for hyperscanning naturalistic social interactions because of its relatively high spatial resolution, sound anatomical localization, and exceptionally high tolerance of motion artifacts. Previous fNIRS-based hyperscanning studies usually calculate a time-lagged INS using wavelet transform coherence (WTC) to describe the direction and temporal pattern of information flow between individuals. However, the results of this method might be confounded by the autocorrelation effect of the fNIRS signal of each individual. For addressing this issue, a method termed partial wavelet transform coherence (pWTC) was introduced, which aimed to remove the autocorrelation effect and maintain the high temporal-spectrum resolution of the fNIRS signal. In this study, a simulation experiment was performed first to show the effectiveness of the pWTC in removing the impact of autocorrelation on INS. Then, step-by-step guidance was offered on the operation of the pWTC based on the fNIRS dataset from a social interaction experiment. Additionally, a comparison between the pWTC method and the traditional WTC method and that between the pWTC method and the Granger causality (GC) method was drawn. The results showed that pWTC could be used to determine the INS difference between different experimental conditions and INS's directional and temporal pattern between individuals during naturalistic social interactions. Moreover, it provides better temporal and frequency resolution than the traditional WTC and better flexibility than the GC method. Thus, pWTC is a strong candidate for inferring the direction and temporal pattern of information flow between individuals during naturalistic social interactions.
Wprowadzenie
Social interaction is of vital importance for human beings1,2. For understanding the dual-brain neurocognitive mechanism of social interaction, the hyperscanning approach has recently been extensively used, showing that the patterns of interpersonal neural synchronization (INS) can well characterize the social interaction process3,4,5,6,7,8,9,10,11,12,13,14. Among recent studies, an interesting finding is that the role difference of individuals in a dyad may lead to a time-lagged pattern of INS, i.e., INS occurs when the brain activity of one individual lags behind that of another individual by seconds, such as that from listeners to speakers5,9, from leaders to followers4, from teachers to students8, from mothers to children13,15, and from women to men in a romantic couple6. Most importantly, there is a good correspondence between the interval of the time-lagged INS and that of social interaction behaviors, such as between teachers questioning and students answering8 or between parenting behaviors of mothers and compliance behaviors of children15. Thus, time-lagged INS may reflect a directional information flow from one individual to another, as proposed in a recent hierarchical model for interpersonal verbal communication16.
Previously, the time-lagged INS was mainly calculated on the functional near-infrared spectroscopy (fNIRS) signal because of its relatively high spatial resolution, sound anatomical localization, and exceptionally high tolerance of motion artifacts17 when studying naturalistic social interactions. Moreover, to precisely characterize the correspondence between the neural time lag and the behavioral time lag during social interaction, it is essential to obtain the INS strength for each time lag (e.g., from no time lag to a time lag of 10 s). For this purpose, previously, the wavelet transform coherence (WTC) procedure was extensively applied after shifting the brain signal of one individual forward or backward relative to that of another individual5,6,18. When using this traditional WTC procedure for fNIRS signals, there is a potential challenge because the observed time-lagged INS may be confounded by the autocorrelation effect of the fNIRS signal for an individual19,20,21. For example, during a dyadic social interaction process, the signal of participant A at time point t may be synchronized with that of participant B at the same time point. Meanwhile, the signal of participant A at time point t may be synchronized with that of participant A at a later time point t+1 because of the autocorrelation effect. Therefore, a spurious time-lagged INS may occur between the signal of participant A at time point t and that of participant B at time point t+1.
Mihanović and his colleagues22 first introduced a method termed partial wavelet transform coherence (pWTC), and then applied it in marine science23,24. The original purpose of this method was to control the exogenous confounding noise when estimating the coherence of two signals. Here, to address the autocorrelation issue in the fNIRS hyperscanning data, the pWTC method was extended to calculate time-lagged INS on the fNIRS signal. Precisely, a time-lagged INS (and a directional information flow) from participant A to participant B can be calculated using the equation below (Equation 1)23.

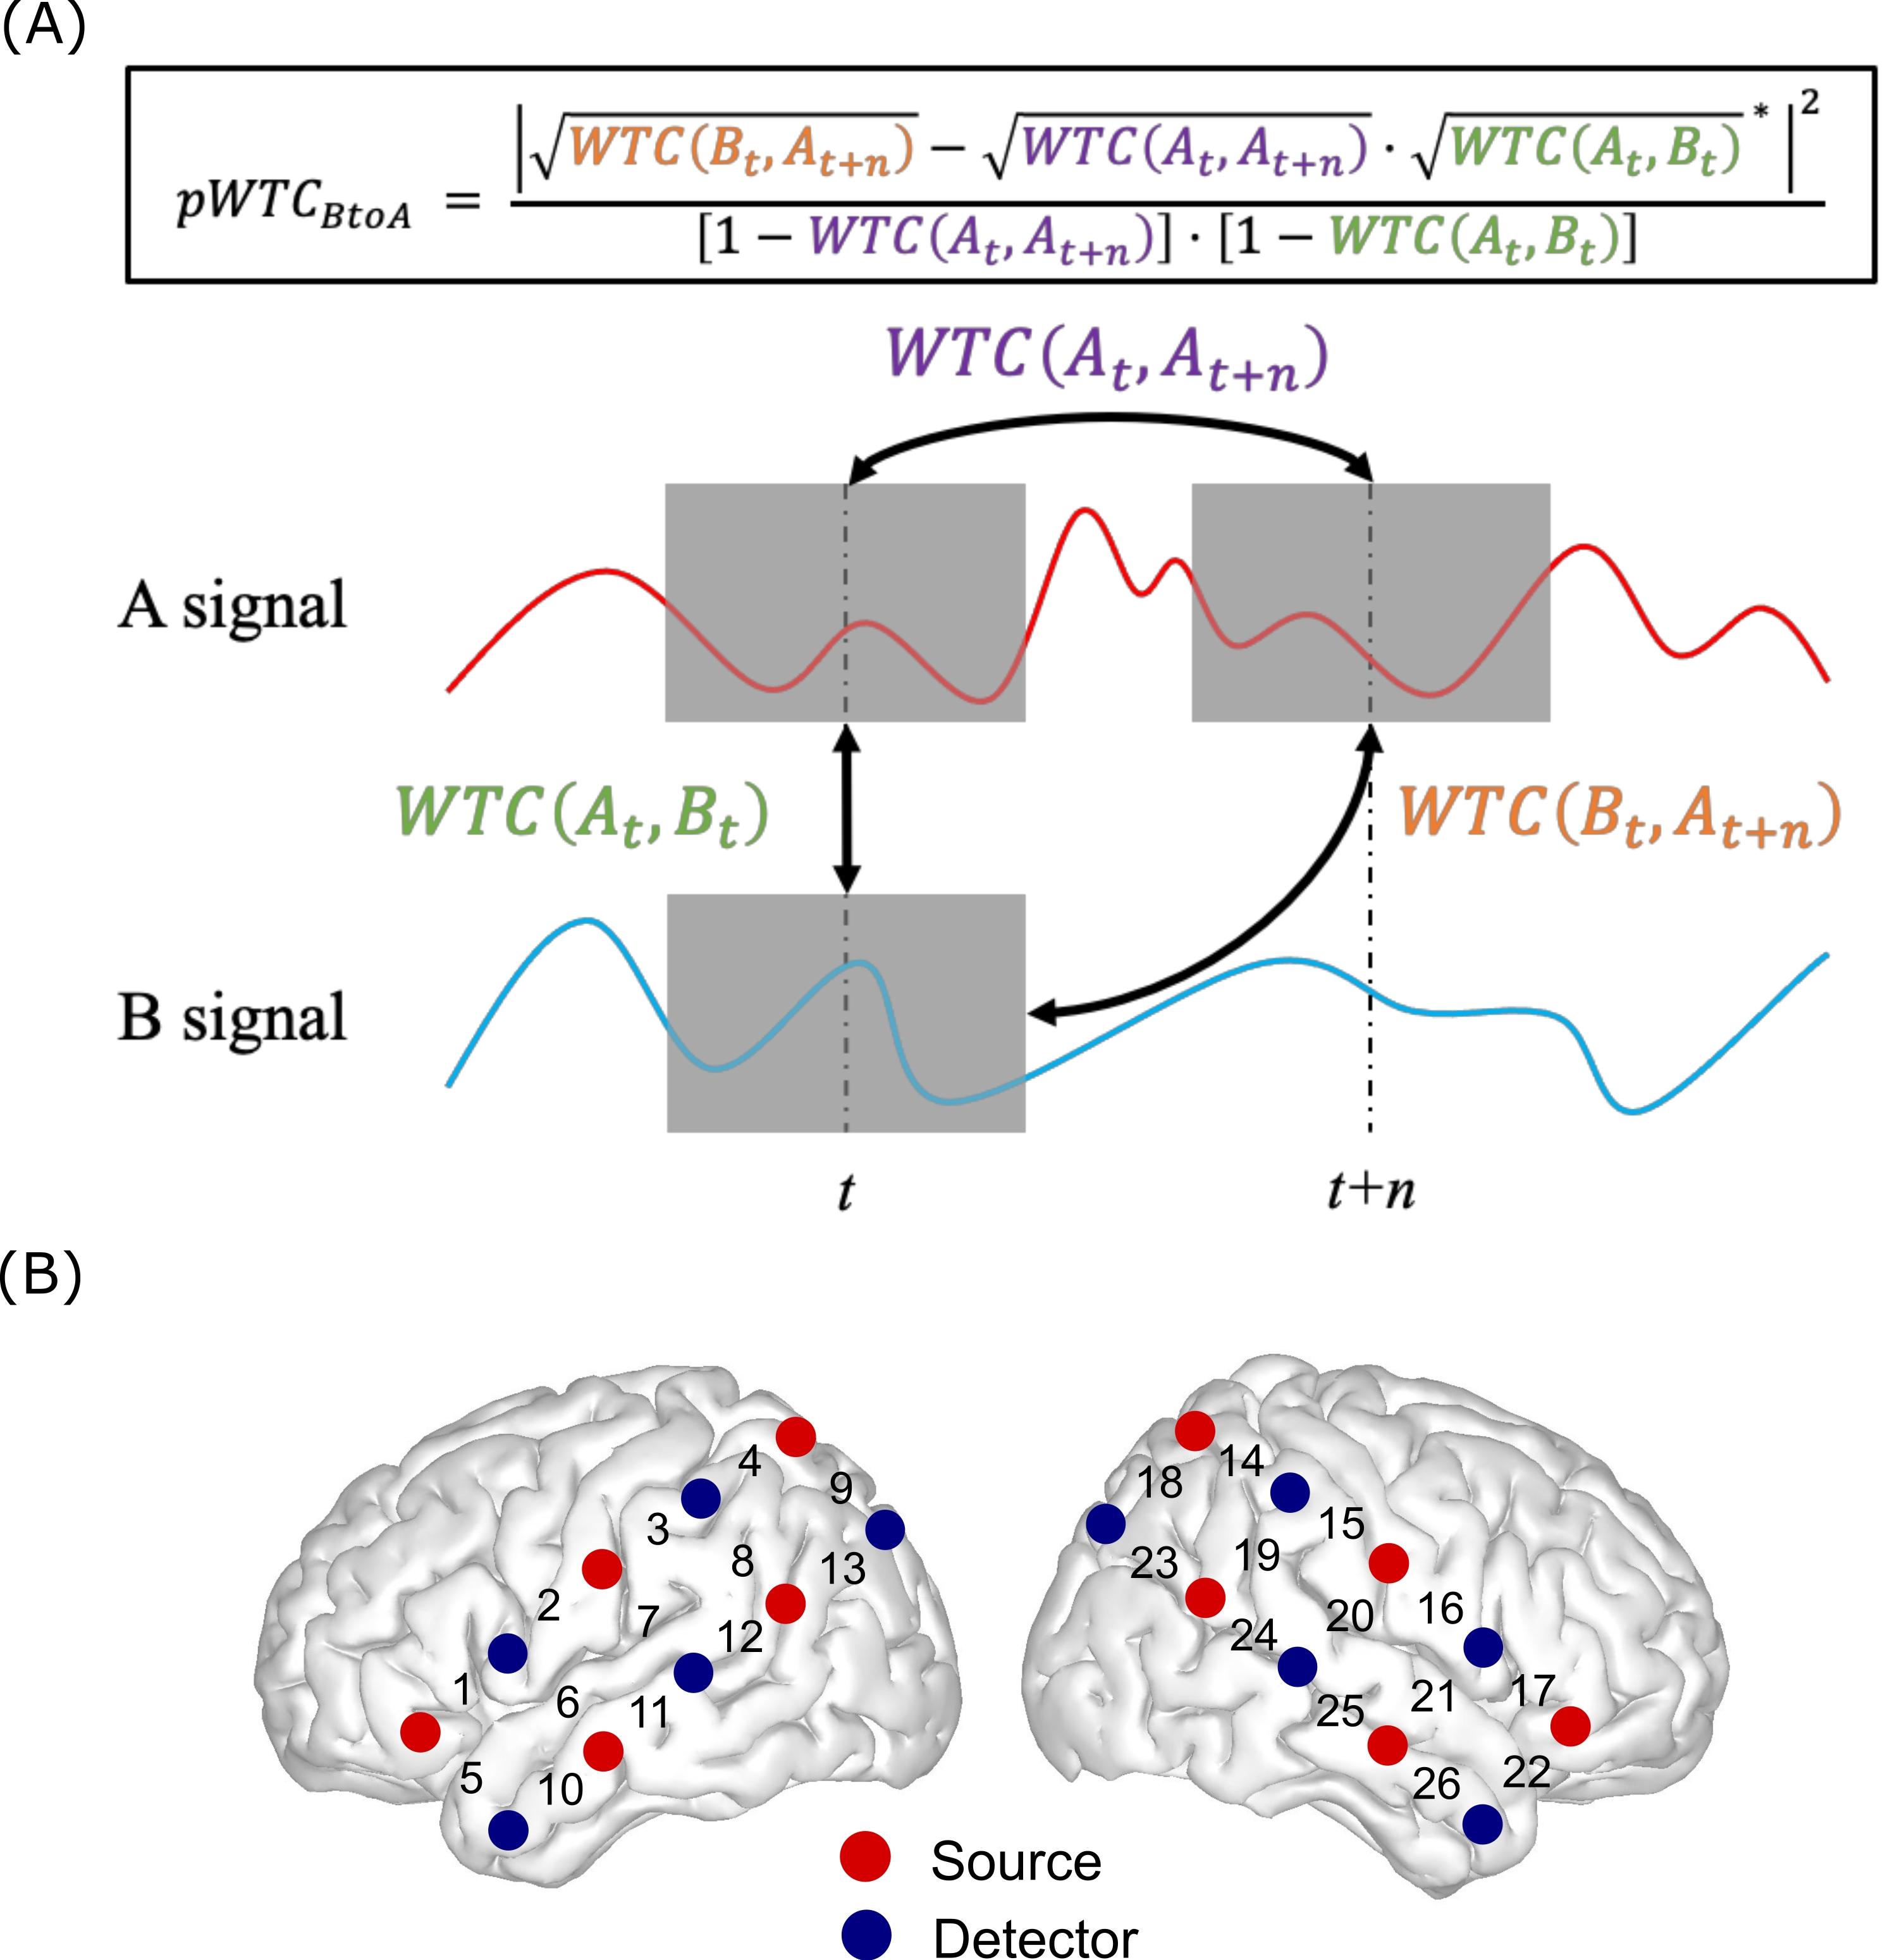
Here, it is assumed that there are two signals, A and B, from participants A and B, respectively. The occurrence of signal B always precedes that of signal A with a time lag of n, where WTC (At, Bt+n) is the traditional time-lagged WTC. WTC (At, At+n) is the autocorrelated WTC in participant A. WTC (At, Bt) is the time-aligned WTC at time point t between participant A and B. * is the complex conjugate operator (Figure 1A).

Figure 1: Overview of pWTC. (A) The logic of the pWTC. There are two signals A and B, within a dyad. The occurrence of A always follows that of B with a lag n. A gray box is a wavelet window at a certain time point t or t+n. Based on the pWTC equation (represented in the figure), three WTCs need to be calculated: the time-lagged WTC of At+n and Bt; the autocorrelated WTC in participant A of At and At+n; and the time-aligned WTC at timepoint t, At and Bt. (B)The layout of optode probe sets. CH11 was placed at T3, and CH25 was placed at T4 following the international 10-20 system27,28. Please click here to view a larger version of this figure.
This protocol first introduced a simulation experiment to demonstrate how well the pWTC resolves the autocorrelation challenge. Then, it explained how to conduct pWTC in a step-by-step way based on an empirical experiment of naturalistic social interactions. Here, a communication context was used to introduce the method. This is because, previously, the time-lagged INS was usually calculated in a naturalistic communication context3,4,6,8,13,15,18. Additionally, a comparison between the pWTC and the traditional WTC and validation with the Granger causality (GC) test were also conducted.
Access restricted. Please log in or start a trial to view this content.
Protokół
The human experiment protocol was approved by the Institutional Review Board and Ethics Committee of the State Key Laboratory of Cognitive Neuroscience and Learning at Beijing Normal University. All participants gave written informed consent before the experiment began.
1. The simulation experiment
- Generate two time series of signals that correlate with each other, with one signal having autocorrelation at a 4 s time lag. Set the correlation coefficient of r between the two signals to 0.4.
- Furthermore, generate two time series of signals without any correlation but with autocorrelation in one signal.
- Calculate values of traditional 4 s time-lagged INS with Equation 2 based on the generated signals with or without correlation, which can be named time-lagged INSWTC with autocorrelation and time-lagged baseline INSWTC with autocorrelation.
NOTE: Here, the traditional time-lagged WTC is expressed by the following equation (Equation 2)25

where, C denotes the continuous wavelet transform operator at different scales i and time points t. S denotes the smoothing operator. * denotes the complex conjugate operator. W and M indicate two individual time series of signals. - Remove autocorrelation from the generated signals. Then, calculate the values of traditional 4 s time-lagged INSWTC with Equation 2 based on the generated signals with or without correlation, which can be named time-lagged INSWTC without autocorrelation and time-lagged baseline INSWTC without autocorrelation.
- Calculate the values of 4 s time-lagged pWTC with Equation 3 based on the generated signals with or without correlation, named time-lagged INSpWTC and time-lagged baseline INSpWTC.
NOTE: The pWTC can be calculated based on the following equation (Equation 3)23

where, WTC (Wt, Mt+n) is the traditional time-lagged WTC. WTC (Mt, Mt+n) is the autocorrelated WTC of one individual. WTC (Wt, Mt) is the time-aligned WTC. * is the complex conjugate operator. - Repeat the above procedures 1000 times.
- After subtracting the baseline INS, compare the results of time-lagged INSWTC with autocorrelation, time-lagged INSWTC without autocorrelation, and time-lagged INSpWTC using the analyses of variance (ANOVA) method.
NOTE: Here, it is expected that the time-lagged INSWTC with autocorrelation will be significantly higher than the time-lagged INSWTC without autocorrelation and the time-lagged INSpWTC, and no significant difference is expected between the time-lagged INSWTC without autocorrelation and the time-lagged INSpWTC.
2. The empirical experiment
- Participants and procedure
- Recruit appropriate participants.
NOTE: In this study, twenty-two pairs of close opposite-sex friends (mean age of women = 20.95, standard deviation (SD) = 1.86; mean age of men = 20.50, SD = 1.74) were recruited through advertising from undergraduates of universities in Beijing. All participants were right-handed and had normal or corrected-to-normal vision. Furthermore, no participants had any language, neurological, or psychiatric disorders. - Ask each pair of participants to sit face-to-face during the experiment. Ask them to communicate freely on a supportive topic in one session and on a conflict topic in the other session.
NOTE: The topics were used to induce the intended positive or negative emotional valence. Each communication session lasted 10 min, and the order of topics was counterbalanced. - Ask the participants to report about the supportive and the conflict topics as a standard set-up rule. Ask each partner to rate the positive or negative valence level that might have been induced on a definite point scale. Then, rank the reported topics according to the rating.
NOTE: In this work, the topics were selected with the following three steps. First, for the supportive topics, each participant was required to report 1-3 personal issues related to what she/he wanted to improve in her/his life. Each participant was required to report 1-3 cases that had induced or would induce conflict between them or that might endanger their relationship for the conflict topics. Second, each partner was required to rate the level of positive or negative valence each topic might induce on a 7-point scale (1 = not at all, and 7 = very much). Third, the reported topics were ranked according to the rating. The first two topics in the list of supportive topics and conflict topics were selected.
- Recruit appropriate participants.
- fNIRS data collection
- Use 26-channel fNIRS topography system (see Table of Materials) to collect fNIRS data.
NOTE: Two customized optode probes set covered the bilateral frontal, temporal, and parietal cortices (Figure 1B). - Precisely, ask each participant to wear a cap with two customized probe sets (see Table of Materials).
- Align the nasion, inion, and ear mastoids with Fpz, Opz, T7, and T8, which are typical landmarks of 10-20 international system26.
- Align channel (CH) 11 to T3 and CH25 to T4 following the international 10-20 system for the two probe sets27,28.
- Validate the anatomical locations of probe sets by scanning magnetic resonance imaging (MRI) data from a typical participant with a high-resolution T1-weighted magnetization-prepared rapid gradient-echo sequence (TR = 2530 ms; TE = 3.39 ms; flip angle = 7°; slice thickness = 1.3 mm; voxel size = 1.3 x 1 x 1.3 mm).
- Use Statistical Parametric Mapping 12 (SPM12) to normalize the image to standard Montreal imaging institute coordinate (MNI coordinate) space29. Then, use the NIRS_SPM toolbox (see Table of Materials) to project the MNI coordinates of the probes to the automated anatomical labeling (AAL) template.
- Collect the optical density data of near-infrared light at three wavelengths (780, 805, and 830 nm) at a sampling rate of 55.6 Hz (equipment default parameters).
- Test the signal quality by using fNIRS topography system built-in equipment software (see Table of Materials).
- Begin signal recording.
NOTE: Some published protocols have demonstrated how to collect fNIRS signals with various equipment and systems30,31,32.
- Use 26-channel fNIRS topography system (see Table of Materials) to collect fNIRS data.
- fNIRS data preprocessing
- Export the data files from the equipment.
NOTE: In the current experiment, the built-in software automatically converted all-optical density data into oxyhemoglobin (HbO) concentration changes based on the modified Beer-Lambert law. - Remove the first and last 15 s of data for each session to avoid transient responses.
- Use the MATLAB decimate built-in function to downsample the data from 55.6 Hz to 11.1 Hz.
NOTE: The power spectrum patterns between 55.6 Hz and 11.1 Hz are quite similar (Supplementary Figure 1). - Use the built-in MATLAB application function (Homer3, see Table of Materials) with appropriate filtering function to apply the discrete wavelet transform filter method to correct motion artifacts.
- Use the MATLAB pca built-in function to remove global physiological noise. Remove the top 80% of the variance from the signals.
- Remove physiological noise based on the previous studies33. Precisely, remove frequency bands of each signal above 0.7 Hz to avoid aliasing of high-frequency physiological noise (e.g., cardiac activity).
- Then, remove frequency bands of each signal below 0.01 Hz to filter out very-low-frequency fluctuations.
- Finally, remove frequency bands of each signal within 0.15-0.3 Hz to exclude the potential impact of respiratory activity.
- Export the data files from the equipment.
- First-level fNIRS Data Processing
- First, calculate INS using traditional WTC (INSWTC).
NOTE: Here, a women-led time-lagged pattern of INSWTC was predicted to occur between the brain activity of women and that of men because previous studies have suggested different roles of women and men during a conversation34,35. The traditional WTC calculated this pattern of INSWTC by shifting the brain activity of men backward relative to that of women (see Equation 2). - Calculate the women-led 2 s-lagged INSWTC value after removing the initial 2 s of data from women and the last 2 s of data from men with Equation 2. Similarly, after removing the initial 2 s of data from men and the last 2 s of data from women, calculate the men-led 2 s-lagged INSWTC value with Equation 4.
NOTE: Here, the wcoherence function, which is a built-in function of the wavelet toolbox of MATLAB, was used (see Table of Materials). - Repeat this procedure with different time lags n, i.e., n = 2 s, 4 s, 6 s, 8 s across all potential CH pairs (e.g., CH2 in women and CH10 in men, 676 pairs in total). Additionally, calculate the strength of men-led time-lagged INSWTC the same way (Equation 4).

- Second, calculate INS using pWTC (INSpWTC).
NOTE: pWTC was calculated based on Equation 3. The calculation of INSpWTC was repeated with different time lags n, i.e., n = 2 s, 4 s, 6 s, 8 s across all potential channel pairs (e.g., CH2 in women and CH10 in men, 676 pairs in total). Additionally, the strength of the men-led time-lagged INSpWTC was calculated the same way (Equation 5).

- Generate time-lagged time series of fNIRS signals at different time lags.
- Calculate the values of the time-lagged WTC at different time lags.
- Generate autocorrelated time series of fNIRS signals at different time lags. To calculate the 2 s-autocorrelated value for men, remove the first 2 s of data from the men and the last 2 s data from the men.
- Calculate the autocorrelated WTC values at different time lags.
- Generate time-aligned time series of fNIRS signals at different time lags. To calculate the 2 s time-aligned WTC, remove the first 2 s of data from the men and the women's first 2 s of data.
- Calculate the time-aligned WTC values.
- Enter time-aligned WTC, time-lagged WTC, and autocorrelated WTC values at different time lag into Equation 3 and Equation 5-the equation of pWTC, generating INSpWTC.
- Finally, calculate INS using the GC method (INSGC).
NOTE: To further validate the pWTC method and evaluate its advantages and disadvantages, GC-based INS was calculated using the GC method (INSGC). - Based on the pWTC result, bandpass filters the HbO signal of each individual at the SMC (i.e., 0.4-0.6 Hz, see Representative Results).
- Conduct a GC test (Econometric toolbox, MATLAB) within each dyad in the supportive and conflict topics separately.
NOTE: Four groups of F-values are obtained for INSGC: (1) from women to men on the supportive topic (W2M_supp); (2) from men to women on the supportive topic (M2W_supp); (3) from women to men on the conflict topic (W2M_conf); and (4) from men to women on the conflict topic (M2 W_conf). The F-values are used to index the INSGC.
- First, calculate INS using traditional WTC (INSWTC).
- Second-level fNIRS data processing
- Transform INS with Fisher-z transformation, and then average INS at the temporal dimension.
NOTE: Here, Fisher-z transformation was conducted using a custom MATLAB script with Equation 636:

where, r is the value of the WTC or pWTC, and z is the Fisher-z transformed value of the WTC or pWTC. - For the averaged INS at each time lag, conduct a paired two-sample t-test (supportive vs. conflict) on each CH pair across the frequency range. Then, identify all significant frequency clusters (P < 0.05).
- Conduct a cluster-based permutation test to establish a threshold for the results.
- Reassign dyadic relationships by randomly assigning the participants to new two-member pairs, i.e., the participants of a dyad that had never communicated with one another. Recalculate the INS at each time lag, perform paired t-tests again in the new sample, and identify significant frequency clusters again.
- Select the cluster with the largest summed t-value. Repeat the above procedures 1000 times to generate a null distribution of the maximum false-positive t-values.
NOTE: The distribution is served as the chance level. The familywise error rate (FWER) is controlled at q = 0.05, which means that only the top 5% of the null distribution of the false-positive t-values exceeds the threshold (R*). - Compare the summed t-value of each identified frequency cluster in the original sample with the null distribution to obtain significant statistical results.
- Conduct a context (supportive, conflict) x direction (women to men, men to women) analysis of variance (ANOVA) to test the difference in INS direction between different conditions (i.e., topics) (p < 0.05).
- Conduct a paired two-sample two-tailed t-test between the results of WTC (Wt, Mt + n) and WTC (Mt, Mt + n) to test the potential impact of autocorrelation on INS.
NOTE: The INS of WTC (Mt, Mt + n) reflects autocorrelation.
- Transform INS with Fisher-z transformation, and then average INS at the temporal dimension.
Access restricted. Please log in or start a trial to view this content.
Wyniki
Simulation results
The results showed that the time-lagged INSWTC with autocorrelation was significantly higher than the time-lagged INSWTC without autocorrelation (t(1998) = 4.696, p < 0.001) and time-lagged INSpWTC (t(1998) = 5.098, p < 0.001). Additionally, there was no significant difference between time-lagged INSWTC without autocorrelation and INSpWTC (t(1998) = 1.573, p = 0.114,
Access restricted. Please log in or start a trial to view this content.
Dyskusje
In hyperscanning studies, it is usually essential to describe the directional and temporal patterns of information flow between individuals. Most previous fNIRS hyperscanning studies have used traditional WTC25 to infer these characteristics by calculating the time-lagged INS. However, as one of the intrinsic features of the fNIRS signal20,21, the autocorrelation effect might confound the time-lagged INS. To address this issue, in the prot...
Access restricted. Please log in or start a trial to view this content.
Ujawnienia
The authors declare no competing financial interests.
Podziękowania
This work was supported by the National Natural Science Foundation of China (61977008) and the Young Top Notch Talents of Ten Thousand Talent Program.
Access restricted. Please log in or start a trial to view this content.
Materiały
| Name | Company | Catalog Number | Comments |
| fNIRS topography system | Shimadzu Corporation | Shimadzu LABNIRS systen | LABNIRS system contains 40 emitters and 40 detectors for fNIRS signals measurement. In this protocol we used these emitters and detectors created two customized 26-channels probe sets and attached to two caps accroding to 10-20 system. Further, LABNIRS system also contains built-in GUI softwares for data quality check, data convert and data export. |
| MATLAB | The MathWorks, Inc. | MATLAB 2019a | In this protocol, several toolboxs and functions bulit in MATLAB were used: SPM12 toolbox was used to normalize the valided MRI data through its GUI. NIRS_SPM toolbox was used to project the MNI coordinates of the probes to the AAL template through its GUI. Homer3 toolbox was used to remove motion artifacts through its function hmrMotionCorrectWavelet with default parameters. Wavelet toolbox was used to compute WTC and pWTC through its function wcoherence. |
| MRI scanner | Siemens Healthineers | TRIO 3-Tesla scanner | In this protocol, the MRI scanner was used to obtain MNI coordinates of each channel and optpde. Scan parameters are described in main text. |
| customized caps | In this protocol, we first marked two nylon caps with 10-20 system. Then, we made two 26-channels customized optode probes sets. Finally, we attached probes sets to caps aligned with landmarks. |
Odniesienia
- Hasson, U., Ghazanfar, A. A., Galantucci, B., Garrod, S., Keysers, C. Brain-to-brain coupling: A mechanism for creating and sharing a social world. Trends in Cognitive Sciences. 16 (2), 114-121 (2012).
- Hasson, U., Frith, C. D. Mirroring and beyond: Coupled dynamics as a generalized framework for modelling social interactions. Philosophical Transactions of the Royal Society B: Biological Sciences. 371, 20150366(2016).
- Jiang, J., et al. Neural synchronization during face-to-face communication. Journal of Neuroscience. 32 (45), 16064-16069 (2012).
- Jiang, J., et al. Leader emergence through interpersonal neural synchronization. Proceedings of the National Academy of Sciences of the United States of America. 112 (14), 4274-4279 (2015).
- Dai, B., et al. Neural mechanisms for selectively tuning in to the target speaker in a naturalistic noisy situation. Nature Communications. 9 (1), 1-12 (2018).
- Long, Y., et al. Interpersonal neural synchronization during interpersonal touch underlies affiliative pair bonding between romantic couples. Cerebral Cortex. 31 (3), New York, N.Y. 1647-1659 (2021).
- Liu, W., et al. Shared neural representations of syntax during online dyadic communication. NeuroImage. 198, 63-72 (2019).
- Zheng, L., et al. Enhancement of teaching outcome through neural prediction of the students' knowledge state. Human Brain Mapping. 39 (7), 3046-3057 (2018).
- Stephens, G. J., Silbert, L. J., Hasson, U. Speaker-listener neural coupling underlies successful communication. Proceedings of the National Academy of Sciences of the United States of America. 107 (32), 14425-14430 (2010).
- Hirsch, J., et al. Interpersonal agreement and disagreement during face-to-face dialogue: An fNIRS investigation. Frontiers in Human Neuroscience. 14, 606397(2021).
- Pan, Y., Cheng, X., Zhang, Z., Li, X., Hu, Y. Cooperation in lovers: An fNIRS-based hyperscanning study. Human Brain Mapping. 38 (2), 831-841 (2017).
- Cui, X., Bryant, D. M., Reiss, A. L. NIRS-based hyperscanning reveals increased interpersonal coherence in superior frontal cortex during cooperation. NeuroImage. 59 (3), 2430-2437 (2012).
- Piazza, E. A., Hasenfratz, L., Hasson, U., Lew-Williams, C. Infant and Adult Brains Are Coupled to the Dynamics of Natural Communication. Psychological Science. 31 (1), 6-17 (2020).
- Djalovski, A., Dumas, G., Kinreich, S., Feldman, R. Human attachments shape interbrain synchrony toward efficient performance of social goals. NeuroImage. 226, 117600(2021).
- Zhao, H., et al. How mother-child interactions are associated with a child's compliance. Cerebral Cortex. 31 (9), 4398-4410 (2021).
- Jiang, J., Zheng, L., Lu, C. A hierarchical model for interpersonal verbal communication. Social Cognitive and Affective Neuroscience. 16 (1-2), 246-255 (2021).
- Yan, W., et al. Bibliometric evaluation of 2000-2019 publications on functional near-infrared spectroscopy. NeuroImage. 220, 117121(2020).
- Zheng, L., et al. Affiliative bonding between teachers and students through interpersonal synchronisation in brain activity. Social Cognitive and Affective Neuroscience. 15 (1), 97-109 (2020).
- Dean, R. T., Dunsmuir, W. T. M. Dangers and uses of cross-correlation in analyzing time series in perception, performance, movement, and neuroscience: The importance of constructing transfer function autoregressive models. Behavior Research Methods. 48 (2), 783-802 (2016).
- Barker, J. W., Rosso, A. L., Sparto, P. J., Huppert, T. J. Correction of motion artifacts and serial correlations for real-time functional near-infrared spectroscopy. Neurophotonics. 3 (3), 031410(2016).
- Huppert, T. J. Commentary on the statistical properties of noise and its implication on general linear models in functional near-infrared spectroscopy. Neurophotonics. 3 (1), 010401(2016).
- Mihanović, H., Orlić, M., Pasarić, Z. Diurnal thermocline oscillations driven by tidal flow around an island in the Middle Adriatic. Journal of Marine Systems. 78, SUPPL. 1 157-168 (2009).
- Ng, E. K. W., Chan, J. C. L. Geophysical applications of partial wavelet coherence and multiple wavelet coherence. Journal of Atmospheric and Oceanic Technology. 29 (12), 1845-1853 (2012).
- Ng, E. K. W., Chan, J. C. L. Interannual variations of tropical cyclone activity over the north Indian Ocean. International Journal of Climatology. 32 (6), 819-830 (2012).
- Grinsted, A., Moore, J. C., Jevrejeva, S. Application of the cross wavelet transform and wavelet coherence to geophysical time series. Nonlinear Processes in Geophysics. 11, 561-566 (2004).
- Jurcak, V., Tsuzuki, D., Dan, I. 10/20, 10/10, and 10/5 systems revisited: Their validity as relative head-surface-based positioning systems. NeuroImage. 34 (4), 1600-1611 (2007).
- Homan, R. W., Herman, J., Purdy, P. Cerebral location of international 10-20 system electrode placement. Electroencephalography and Clinical Neurophysiology. 66 (4), 376-382 (1987).
- Koessler, L., et al. Automated cortical projection of EEG sensors: Anatomical correlation via the international 10-10 system. NeuroImage. 46 (1), 64-72 (2009).
- Penny, W., Friston, K., Ashburner, J., Kiebel, S., Nichols, T. Statistical Parametric Mapping: The Analysis of Functional Brain Images. , Academic Press. (2007).
- Shalinsky, M. H., Kovelman, I., Berens, M. S., Petitto, L. A. Exploring cognitive functions in babies, children & adults with near infrared spectroscopy. Journal of Visualized Experiments: JoVE. (29), e1268(2009).
- Xu, S. Y., Cheong, L. I., Zhuang, Y., Couto, T. A. P., Yuan, Z. Conducting concurrent electroencephalography and functional near-infrared spectroscopy recordings with a flanker task. Journal of Visualized Experiments: JoVE. (159), e6069(2020).
- Noah, J. A., et al. fMRI validation of fNIRS measurements during a naturalistic task. Journal of Visualized Experiments: JoVE. (100), e52116(2015).
- Tong, Y., Lindsey, K. P., Frederick, B. D. Partitioning of physiological noise signals in the brain with concurrent near-infrared spectroscopy and fMRI. Journal of Cerebral Blood Flow and Metabolism. 31 (12), 2352-2362 (2011).
- Buck, R., Miller, R. E., Caul, W. F. Sex, personality, and physiological variables in the communication of affect via facial expression. Journal of Personality and Social Psychology. 30 (4), 587-596 (1974).
- Walen, H. R., Lachman, M. E. Social support and strain from partner, family, and friends: Costs and benefits for men and women in adulthood. Journal of Social and Personal Relationships. 17 (1), 5-30 (2000).
- Chang, C., Glover, G. H. Time-frequency dynamics of resting-state brain connectivity measured with fMRI. NeuroImage. 50 (1), 81-98 (2010).
- Liu, H., et al. Inferring subsurface preferential flow features from a wavelet analysis of hydrological signals in the shale hills catchment. Water Resources Research. 56 (11), 0-3 (2020).
- Rhif, M., Abbes, A. B., Farah, I. R., Martínez, B., Sang, Y. Wavelet transform application for/in non-stationary time-series analysis: A review. Applied Sciences. 9 (7), Switzerland. 1345(2019).
- Molavi, B., Dumont, G. A. Wavelet-based motion artifact removal for functional near-infrared spectroscopy. Physiological Measurement. 33 (2), 259-270 (2012).
- Scholkmann, F., Spichtig, S., Muehlemann, T., Wolf, M. How to detect and reduce movement artifacts in near-infrared imaging using moving standard deviation and spline interpolation. Physiological Measurement. 31 (5), 649-662 (2010).
- Zhang, Y., Brooks, D. H., Franceschini, M. A., Boas, D. A. Eigenvector-based spatial filtering for reduction of physiological interference in diffuse optical imaging. Journal of Biomedical Optics. 10 (1), 011014(2005).
- Cui, X., Bray, S., Reiss, A. L. Functional near infrared spectroscopy (NIRS) signal improvement based on negative correlation between oxygenated and deoxygenated hemoglobin dynamics. NeuroImage. 49 (4), 3039-3046 (2010).
- Cooper, R. J., et al. A systematic comparison of motion artifact correction techniques for functional near-infrared spectroscopy. Frontiers in Neuroscience. 0, 147(2012).
- Brigadoi, S., et al. Motion artifacts in functional near-infrared spectroscopy: A comparison of motion correction techniques applied to real cognitive data. NeuroImage. 85, 181-191 (2014).
- Liu, Y., et al. Measuring speaker-listener neural coupling with functional near infrared spectroscopy. Scientific Reports. 7, 1-13 (2017).
- Li, Z., et al. Speaker-listener neural coupling reveals an adaptive mechanism for speech comprehension in a noisy environment. Cerebral Cortex. , (2021).
Access restricted. Please log in or start a trial to view this content.
Przedruki i uprawnienia
Zapytaj o uprawnienia na użycie tekstu lub obrazów z tego artykułu JoVE
Zapytaj o uprawnieniaPrzeglądaj więcej artyków
This article has been published
Video Coming Soon
Copyright © 2025 MyJoVE Corporation. Wszelkie prawa zastrzeżone