1. Stimulus design.
Choosing colors for a color working memory experiment is vital to the success of the experiment. It is important to choose colors that reside on the same mental color circle, so the colors all have the same luminance, in virtue of residing on the same plane, and the same contrast, in virtue of being equidistant from the background color. Physically, the color one perceives is related to a linear dimension, the wavelengths of light reflecting from a surface. But, perceptually, color space—the relationships in how colors are mentally represented—are non-linear. Even at the earliest ages, kids are taught to think about color “circles” and “rings.”
In this video, each experimental trial includes three parts (Figure 1): Part A, the sample phase, where one to eight of the 180 colors is selected randomly and presented in the display, each within a small square for 500 ms; Part B, the delay, where the samples disappear, and the participant faces a blank display for 900 ms; and Part C, the test, where an empty square appears, along with the full color ring. The participant’s task is to recall the color seen during the sample phase (Part A) and to click with the mouse that color on the ring.
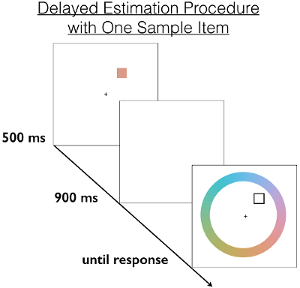
Figure 1. Delayed estimation procedure. In each trial, one of the 180 individual colors (the sample) is shown for 500 ms, the display becomes blank for 900 ms, and then the participant must report the remembered sample color via mouse click on the color ring.
- Choose a large set of individual colors to serve as stimuli from trial to trial.
- Make sure the colors have the same luminance (intensity of light) and the same contrast relative to the background in order to prevent any one color from being naturally more memorable than any other.
- When making the color choices, reference CIELAB, which is an internationally standardized way of describing perceptual color space in three dimensions. This makes it easier to select colors with the right properties.
- Select colors that form a circle together, with the background color as the center of that circle. Most experiments include 180 individual colors, each with the same luminance, but varying in hue (Figure 2).
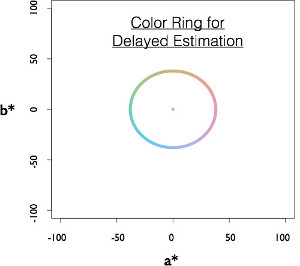
Figure 2. A color ring including 180 individual colors. The ring is shown rendered in CIELAB space. All samples have the same L* coordinate value, roughly meaning that they have the same luminance. The center point of the ring (shown accurately in grey) is an achromatic point, with the same luminance as the sample colors, but not chromatic value (i.e., with a* and b* coordinates equal to zero). The 180 individual color samples vary in terms of a* and b* values, specifying their proportional mixtures of blue/yellow and magenta/green to produce each individual color.
2. Procedure.
- Before beginning, instruct the participant to remember the stimuli and their colors. On each trial, show one to eight of the 180 colors in the display for 500 ms.
- Pick the colors on each trial randomly, and render each of the colors in a small square, occupying about 1° of visual angle. These squares are the sample stimuli.
- Make sure each trial has one to eight squares. Overall, the experiment should have 60 trials, each with 1, 2, 3, 4, 5, 6, 7, and 8 sample squares. This makes a total of 480 trials.
- In addition to the 480 experimental trials, start the experiment with 10 practice trials. The first five should have only 1-2 sample items to get the participant acclimated.
- At the start of the experiment, explain the instructions to the participant as follows: “In this experiment, we want to study how precisely people remember colors. On each trial, you will see a number of squares presented simultaneously in different colors. Your job is to try to remember the color of each square as precisely as you can. After about half a second, the squares will disappear. Keep them in mind. Then, the positions of one of the squares will be probed, and your job is to report the color of the square that was just in that position on a color wheel. We’ll do 10 practice trials to get you used to everything. Feel free to ask questions, if you have any. Do your best, and if you feel uncertain, just guess.”
- After the sample squares disappear, present an empty display for 900 ms. This is the delay period, during which the participant needs to maintain their memory for sample items just seen, since they are no longer present in the display.
- The delay period is followed by the test: start by randomly selecting one of the items from the sample display.
- In the place where it was originally, draw a black square outline. This is the probe. It tells the participant which item to recall from memory.
- Along with the probe, present the color ring that the colors were selected from.
- Instruct the participant to click on the ring as close to the color as they can remember for the probed sample item.
- In each test trial, present the ring in a different random rotation, so the participants can’t associate specific parts of the space with specific colors.
- Make sure to explain to the participant that if they feel unsure about the answer on any trial, they should guess. Leave the test display present until a response is made, with a trial ending whenever the participant clicks on the color ring.
- Store as much data as possible about each trial. A number of things are critical for the output file in this experiment:
- Create the output file on a spreadsheet. Each line in the sheet reflects a given trial.
- Critically, record the following: the number of sample items in the trial, the true color of the probed item, and the color the participant selected as a response. With these data, the angular difference between the true and responded color can be computed later.
3. Analysis.
- For each trial, compute the angular response error.
- Compute the number of colors between the correct response in each trial and the one given, and then multiply that number by 2, since 2° separate each of the colors. The result is the angular error in each trial.
- Make this a column in the spreadsheet.
- Average together the angular errors across all trials (under the assumption that there is no reason for any one color to produce average angular errors larger than any other). This results in a distribution of the frequency of different angular errors (Figure 3). Note that the mean of the distribution is zero, and it is normally distributed.
- From the distribution of angular errors, compute the precision of color working memory.
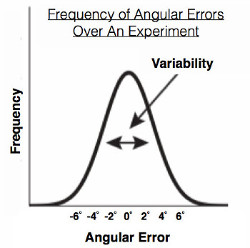
Figure 3. Frequency of angular errors, collapsed across all trials, over the course of an experiment. Errors should form a normal distribution, centered on zero— indicating the correct response as the average answer. The variability of the distribution, specifically, the standard deviation, can be used to estimate memory precision.
Experimental psychologists use the delayed estimation paradigm to assess the precision of visual memories, and how such memories degrade the more one tries to remember at once.
On one hand, human memory is constrained by the number of pieces of information an individual can remember-like how many items they need to restock the pantry-meaning that it is quantitatively limited.
Memory can also be limited in its precision. For example, a person can recognize their mother on the phone because they remember the sound of her voice. However, an individual's "stored" memory of their mother's voice may not perfectly match its actual, physical sound. Thus, memory can also be qualitatively limited.
The delayed estimation paradigm provides a way to evaluate the relationship between these quantitative and qualitative limits of memory.
This video demonstrates methods for investigating the precision of visual working memory, including how to design the stimulus and perform an experiment involving a delayed estimation paradigm, as well as how to analyze and interpret the results.
In this experiment, color provides an ideal stimulus to evaluate the precision of visual working memory, as it can be mentally represented in a continuous, non-linear spectrum known as a color ring.
Participants are asked to perform several trials during which they must remember a color stimulus. Each of these trials consists of three phases: sample, delay, and test.
During the sample phase, a randomly colored square appears onscreen for 500 ms. The square then disappears, leaving a blank screen.
Through this delay phase, participants are asked to focus on the empty screen for 900 ms, whereby the sample color must be remembered.
In the final test phase, a probe square-outlined in black and devoid of color-appears in the same position as the colored box shown previously.
Simultaneously, participants are shown a color ring consisting of 180 different colors and asked to select the region of the color ring that most closely resembles the original sample color.
Note that the color ring always appears in a random orientation, which ensures that participants can't associate specific areas onscreen with certain colors.
To increase task difficulty, the memory load-the number of colored boxes shown in each trial-is varied from one to eight.
The dependent variable then is the precision of color working memory-how accurately participants remember the color or colors shown during the sample phase.
For a given sample color, participants are expected to vary within the "true" color range, but rarely choose colors that are drastically different.
As memory load increases, the precision of color working memory is likely to decrease.
To begin, choose a set of 180 colors with varying hues, which together form a color ring. Check that these colors demonstrate the same light intensity and contrast relative to the background color on the screen; this ensures that no single color will be more memorable to participants during the trials.
When the participant arrives, direct them to a computer and explain the procedure of the experiment.
Emphasize that when a specific region of the screen is probed, only the color of the box that appeared earlier in that same position should be chosen. In addition, instruct the participant to guess if they are unsure of a probed sample color.
To assure that participants understand the task, allow them to perform ten practice trials.
Once the participant understands the instructions, have them complete 480 experimental trials, with equal numbers of trials for memory loads between one and eight.
For each trial, record the memory load, the true colors of the sample boxes, and the colors the participant chose after the delay period.
To analyze the data independent of color, for every sample box shown and probed in a trial, calculate the angular error-the distance in degrees between the true and chosen response colors on the color ring.
If the participant remembered the exact color of the sample box after the delay period, the angular error should be zero.
For each group of trials dealing with the same memory load, create a frequency distribution curve, where the angular error is plotted on the X axis and frequency on the Y axis.
Once frequency distribution curves have been generated, calculate the standard deviation-the spread of values around the mean-for each.
Take the inverse of the standard deviation to generate a value representing memory precision. If this value is large, this is indicative of memory being precise for a group of trials.
To visualize the data, plot the calculated memory precision values as a function of memory load. Notice that as load increases, memory precision tends to decline, suggesting a tradeoff between how many things a participant can remember at once, and how precisely they can store this information.
Now that you know how to design and perform an experiment using delayed estimation, let's look at how researchers are currently using this paradigm to tease apart different aspects of visual memory.
Until now, we've discussed how delayed estimation has been used to assess short-term working memory, in which a participant only has to briefly store a piece of color information for a single a trial. However, researchers could also investigate long-term color memory with this paradigm, evaluating it over much longer periods.
Furthermore, this paradigm can also be used to compare the precision of visual memory between different individuals, for example, visual-based professionals like interior designers, and potentially less-visual subjects, such as lawyers or doctors.
Finally, although researchers typically use the delayed estimation paradigm to evaluate memory for color, it can also be employed in neurocognitive assessments of other types of visual working memory-like that pertaining to shapes.
You've just watched JoVE's introduction to delayed estimation. We've reviewed how to perform this method, as well as collect and analyze participant color memory data. Importantly, we've noted how this technique can help understand how the qualitative limits of human color memory can be influenced by quantitative factors.
Thanks for watching!


