
Spatial Cueing
Przegląd
Source: Laboratory of Jonathan Flombaum—Johns Hopkins University
Attention refers to the limited human ability to select some information for processing at the expense of other stimuli in the environment. Attention operates in all sensory modalities: vision, hearing, touch, even taste and smell. It is most often studied in the visual domain though. A common way to study visual attention is with a spatial cueing paradigm. This paradigm allows researchers to measure the consequences of focusing visual attention in some locations and not others. This paradigm was developed by psychologist Michael Posner in the late 70s and early 80s in a series of papers in which he likened attention to a spotlight, selectively illuminating some portion of a scene.1,2 This video demonstrates standard procedures for a spatial cueing experiment to investigate visual attention.
Procedura
1. Equipment
- The experiment requires a computer and experiment implementation software such as E-Prime, or a programming environment such as MATLAB or PsychoPy.
2. Stimulus and Experiment Design
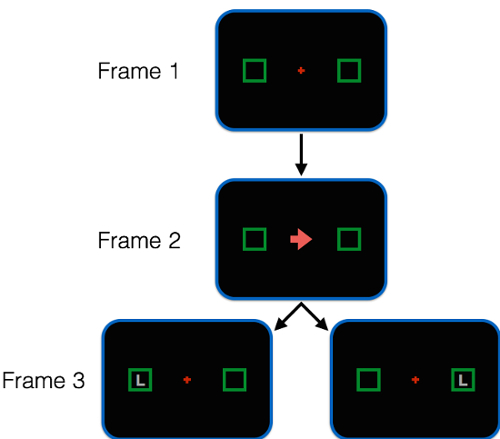
- The experiment involves short trials in which participants must detect and report a brief visual target. Each trial comprises three frames. Figure 1 depicts the frames.
.css-f1q1l5{display:-webkit-box;display:-webkit-flex;display:-ms-flexbox;display:flex;-webkit-align-items:flex-end;-webkit-box-align:flex-end;-ms-flex-align:flex-end;align-items:flex-end;background-image:linear-gradient(180deg, rgba(255, 255, 255, 0) 0%, rgba(255, 255, 255, 0.8) 40%, rgba(255, 255, 255, 1) 100%);width:100%;height:100%;position:absolute;bottom:0px;left:0px;font-size:var(--chakra-fontSizes-lg);color:#676B82;}
Wyniki
Figure 4 shows average reaction time for a group of participants, comparing congruent and incongruent trials. Participants were, on average, about 200 ms faster to respond in congruent trials. This shows the advantages associated with the location where one attends and the costs to other locations. The arrow gave participants 80% reliable information about where the letter would appear in each trial, so participants directed visual attention to the positions pointed to by the arrow. When the letter then
Wniosek i Podsumowanie
Since it was introduced in the late 1970s, the spatial-cueing task has been used widely by researchers, for example, in order to identify the kinds of stimuli that might automatically cause attention to shift. For example, researchers have investigated whether bright flashes and loud sounds automatically cause attention to shift. In these experiments the letters that need to be identified are sometimes preceded by unexpected lights and sounds. Researchers can then compare detection speeds when a bright flash, for instanc
Tagi

Przejdź do...
Filmy z tej kolekcji:

Now Playing
Spatial Cueing
Sensation and Perception
15.0K Wyświetleń

Color Afterimages
Sensation and Perception
11.2K Wyświetleń

Finding Your Blind Spot and Perceptual Filling-in
Sensation and Perception
17.5K Wyświetleń

Perspectives on Sensation and Perception
Sensation and Perception
11.9K Wyświetleń

Motion-induced Blindness
Sensation and Perception
7.0K Wyświetleń

The Rubber Hand Illusion
Sensation and Perception
18.6K Wyświetleń

The Ames Room
Sensation and Perception
17.6K Wyświetleń

Inattentional Blindness
Sensation and Perception
13.4K Wyświetleń

The Attentional Blink
Sensation and Perception
16.1K Wyświetleń

Crowding
Sensation and Perception
5.8K Wyświetleń

The Inverted-face Effect
Sensation and Perception
15.7K Wyświetleń

The McGurk Effect
Sensation and Perception
16.1K Wyświetleń

Just-noticeable Differences
Sensation and Perception
15.4K Wyświetleń

The Staircase Procedure for Finding a Perceptual Threshold
Sensation and Perception
24.4K Wyświetleń

Object Substitution Masking
Sensation and Perception
6.6K Wyświetleń
Copyright © 2025 MyJoVE Corporation. Wszelkie prawa zastrzeżone