The Use of Carboxyfluorescein Diacetate Succinimidyl Ester (CFSE) to Monitor Lymphocyte Proliferation
In This Article
Summary
CFSE covalently labels long-lived intracellular molecules with the fluorescent dye, carboxyfluorescein. As such, when a CFSE-labeled cell divides, its progeny have half the amount of fluorescence, which can thereby be used to assess cell division. This article describes the procedures typically used for labeling mouse lymphocytes with CFSE.
Abstract
Carboxyfluorescein succinimidyl ester (CFSE) is an effective and popular means to monitor lymphocyte division1-3. CFSE covalently labels long-lived intracellular molecules with the fluorescent dye, carboxyfluorescein. Thus, when a CFSE-labeled cell divides, its progeny are endowed with half the number of carboxyfluorescein-tagged molecules and thus each cell division can be assessed by measuring the corresponding decrease in cell fluorescence via Flow cytometry. The capacity of CFSE to label lymphocyte populations with a high fluorescent intensity of exceptionally low variance, coupled with its low cell toxicity, make it an ideal dye to measure cell division. Since it is a fluorescein-based dye it is also compatible with a broad range of other fluorochromes making it applicable to multi-color flow cytometry. This article describes the procedures typically used for labeling mouse lymphocytes for the purpose of monitoring up to 8 cell divisions. These labeled cells can be used both for in vitro and in vivo studies.
Protocol
1) Reagent Setup
1.1) CFSE stock solution
The CFSE dye is purchased as carboxyfluorescein diacetate succinimidyl ester (CFDA, SE) (MW 557.47 g/mole), typically in 25 mg vials. Dissolve the 25 mg in 8.96 mL DMSO for a final stock solution of 5 mM (store as 50-100 μL aliquots at -20 °C for several months). CFDA, SE will react with aqueous solution so it is critical that such exposure be avoided during storage.
1.2) Lymphocytes
Isolate lymphocytes from spleen and or lymph nodes from mice and resuspend in 1 mL of culture medium (e.g. RPMI) with 5% heat-inactivated (HI) fetal calf serum (FCS), with a cell concentration of between 0.5 x 10⁶ - 10 x 107/mL.
2) CFSE Labeling
2.1) Routine method:
- Thoroughly resuspend cells in the 1 mL volume of medium and place carefully in the bottom of a fresh (non-wetted) 10 mL conical tube.
- Lay the tube horizontally (using a non-wetted tube will prevent the 1 mL-cell suspension from moving and prematurely mixing with the CFDA, SE solutions).
- Carefully add 110 μL of PBS to the non-wetted portion of the plastic at the top of the tube ensuring it does not make contact with the cell solution.
- Resuspend 1.1 μL of the 5 mM stock of CFDA, SE in the 110 μL PBS.
- Quickly cap the tube and invert and vortex well to get quick uniform mixing of the solutions. Note that the CFSE dye is at a final concentration of 5 μM, however, the optimum concentration may have to be determined for each batch prepared, and then checked every 6 months to ensure it is effective.
- Incubate cells for 5 min at room temperature. Note that upon conversion of CFDA, SE to CFSE (see discussion) the dye becomes fluorescent and thus prone to bleaching by exposure to excessive light. Thus, it is advisable to protect the tube from light from this point on, for example by covering it with aluminum foil.
- Wash cells by diluting in 10 volumes of 20 °C PBS containing 5 % HI FCS, sedimenting by centrifugation at 300 x g for 5 min at 20 °C and discarding the supernatant. Repeat wash twice more.
2.2) Alternative method, which is also appropriate for higher cell numbers (10 - 30 x 107):
- Prepare a 2 x (10 μM) CFDA, SE solution by adding 2 μL of the 5 mM stock to 1 mL of PBS and quickly add this to 1 mL of thoroughly resuspended cells, then quickly cap the tube and invert and vortex well to get quick uniform mixing.
- Incubate the cells for 5 min at room temperature and wash as in steps 2.1(f) and 2.1(g).
2.3) Cells can then be applied to a protocol of interest for induction of cell division. Labeled cells can be used in both in vitro and in vivo assays.
2.4) At the completion of the proliferation assay, cells are harvested and analyzed by flow cytometry (see below for representative examples).
3) Representative Results
To assess lymphocyte proliferation by CFSE dilution, it is useful to know the fluorescence of undivided cells (i.e. maximum fluorescence) and non-labeled cells (i.e. minimum fluorescence). Therefore, your experimental design should take these controls into account. Below are examples of in vitro and in vivo assays using CFSE to measure CD8+ T cell division by flow cytometry.
3.1) In vitro stimulation
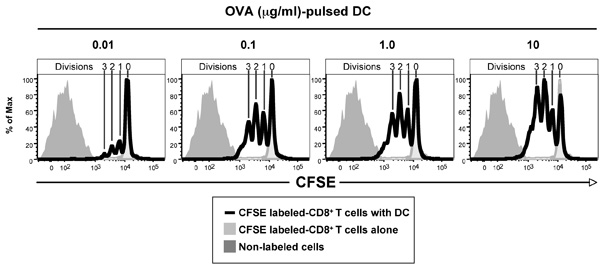
Figure 1 shows the CFSE profiles of CFSE-labeled ovalbumin (OVA)-specific T cell receptor transgenic CD8+ OT-I T cells after 3 days culture with dendritic cells pulsed with various amounts of OVA. CD8+ T cells purified from the spleen and lymph nodes of OT-I mice were labeled with CFSE and 1 x 10⁵ cells cultured with 3.3 x 10⁴ DC. DC where pulsed with OVA for 1 hr at 37 °C and washed twice prior to culture. After 3 days, cells where harvested and labeled with anti-CD8-APC antibodies and Hoechst 33258 and then analyzed by flow cytometry (50,000 events collected). Live (Hoechst 33258-) CD8+ cells are shown. As controls, CD8+ T cells cultured alone, shows the CFSE intensity of non-divided cells, while the non-labeled cells shows the auto-fluorescence of the cells and the limits of detectable cell divisions. Note that 4 CFSE peaks can be seen in each of the panels in this example, indicating that the cells have undergone up to 3 divisions.
3.2) In vivo stimulation
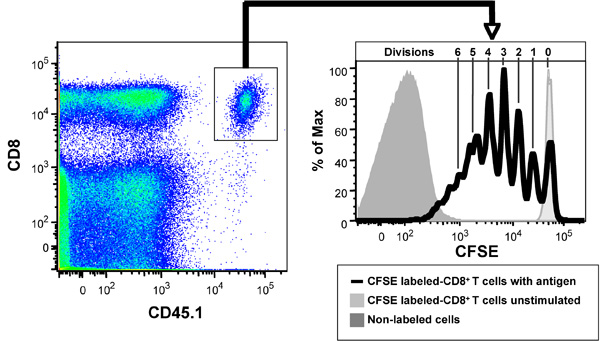
Figure 2 shows the CFSE profiles of CFSE-labeled OVA-specific T cell receptor transgenic CD8+ OT-I T cells after 3 days in vivo in the presence of 20 μg OVA. CD8+ T cells purified from the spleen and lymph nodes of CD45.1 congenic OT-I mice were labeled with CFSE and 5 x 10⁶ cells injected i.v. into the lateral tail vein of C56BL/6J (CD45.2+) mice. After 2 hr mice were injected i.v. with 20 μg of OVA. After 3 days, spleens from the mice were collected, made into a single cell suspension, labeled with anti-B220-PerCP, anti-CD8-APC-Cy7 and anti-CD45.1-PE-Cy7 antibodies and Hoechst 33258 and then analyzed by flow cytometry (1,000,000 events collected). Live (Hoechst 33258-) B220- cells are shown in left panel and gated CD8+ CD45.1+ cells shown in right panel. As controls, unstimulated CFSE-labeled CD8+ T cells, shows the CFSE intensity of non-divided cells, while the non-labeled cells shows the auto-fluorescence of the cells and the limits of detectable cell divisions. Note that the use of the CD45 allotypic difference is vital in resolving the transferred CD8+ T cells from host, as they are a minor subset of the total CD8+ T cells (left panel). Note that most cells fall within 7 CFSE peaks in this example (right panel), indicating that the cells have undergone up to 6 divisions.

Figure 1. Ability of CFSE-labeled ovalbumin (OVA)-specific T cell receptor transgenic CD8+ OT-I T cells to respond in vitro to DC pulsed with different concentrations of OVA, data shown being after 3 days culture. Note non-divided population of CD8+ T cells in the absence of antigen (light grey histogram) and auto-fluorescence of non-labeled population (dark grey histogram). The Figure depicts CD8+ T cells that have divided 1-3 times based on CFSE dilution peaks, with more T cells dividing at the higher antigen concentrations.

Figure 2. Ability of CFSE-labeled ovalbumin (OVA)-specific T cell receptor transgenic CD8+ OT-I T cells, when adoptively transferred into C57BL/6 mice to respond to OVA, data shown 3 days after adoptive transfer. Left panel: CD8+, CD45.1+ OT-1 T cells in recipient mice. Right panel: CFSE proliferation profile. Note non-divided population of CD8+ T cells in recipient mice not receiving antigen (light grey histogram) and auto-fluorescence of non-labeled lymphocytes (dark grey histogram). The Figure depicts CD8+ T cells that have divided 1-6 times based on CFSE dilution peaks.

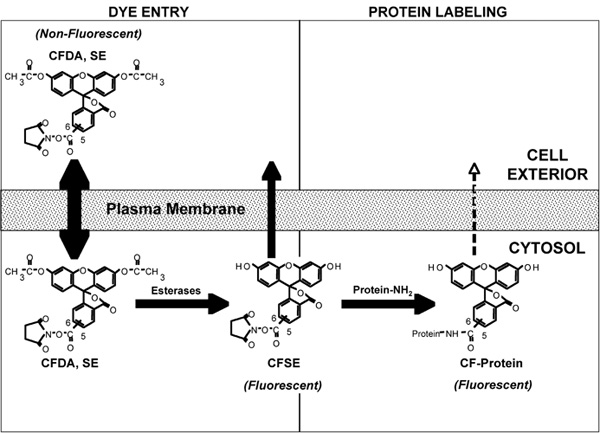
Figure 3. A representation of the various molecular events that occur during the labeling of cells with carboxyfluorescein diacetate succinimidyl ester (CFDA, SE). For details of the process see Discussion text. Note: The generic acronym 'CFSE', not CFDA, SE, is used to describe the labeling reagent and the labeling procedure in general. Figure based on Parish4.
Discussion
In order to appreciate how CFSE works and why rapid uniform labeling is required for its use in proliferation analysis, it is useful to understand the molecular basis of CFSE cell labeling. This can be divided into two phases, 1) Cell entry and 2) Protein labeling (Figure 3). 1) Cell entry: Entry of the dye in to the cell is mediated by the diacetylated form of the dye, carboxyfluorescein diacetate succinimidyl ester (CFDA, SE). The acetates make the dye highly membrane permeant allowing its rapid flux across the plasma membrane. Esterases, present within the cell, cleave the acetates from CFDA, SE and thereby give rise to the CFSE form of the dye which is much less membrane permeant, thus concentrating the dye within the cell. 2) Protein labeling: While both CFDA, SE and CFSE have amino-reactive succinimidyl side chains, only the CFSE is fluorescent. The high intracellular concentration of CFSE facilitates rapid and high level intracellular labeling of proteins. CFSE labeling of cells must be performed quickly in order to obtain a homogenously labeled population of cells, which is critical for resolving cells that have undergone several divisions as shown in the representative results (Figure 1 and 2).
Disclosures
No conflicts of interest declared.
Acknowledgements
The work reported in this article was supported by a National Health and Medical Research Council (NHMRC) of Australia Program Grant (CRP) and a NHMRC Project Grant (CRP and BJCQ). Also BJCQ is a NHMRC Peter Doherty Postdoctoral Fellow.
Materials
| Material Name | Type | Company | Catalogue Number | Comment |
|---|---|---|---|---|
| Name | Company | Catalog Number | Comments | |
| CFDA,SE | Molecular Probes | |||
| DMSO | Cambridge Isotope Laboratories Inc. | |||
| Lymphocytes | eg mouse or human | |||
| RPMI | Gibco | |||
| FCS | SAFC Biosciences | |||
| 10-15ml conical tubes | Falcon, Becton Dickinson | |||
| PBS | Gibco | |||
| Aluminium foil | Capral Aluminium | |||
| Vortex | Scientific Industries | |||
| Centrifuge | Eppendorf (5810 R) | |||
| Flow cytometer | LSR-II (BD Biosciences) |
References
- Lyons, A. B., Parish, C. R. Determination of lymphocyte division by flow cytometry. J. Immunol. Methods. 171, 131-137 (1994).
- Parish, C. R., Glidden, M. H., Quah, B. J., Warren, H. S., Coligan, J. E. Use of the intracellular fluorescent dye CFSE to monitor lymphocyte migration and proliferation. Current protocols in immunology. , (2009).
- Quah, B. J., Warren, H. S., Parish, C. R. Monitoring lymphocyte proliferation in vitro and in vivo with the intracellular fluorescent dye carboxyfluorescein diacetate succinimidyl ester. Nature Protocols. 2, 2049-2056 (2007).
- Parish, C. R. Fluorescent dyes for lymphocyte migration and proliferation studies. Immunol Cell Biol. 77, 499-508 (1999).
Reprints and Permissions
Request permission to reuse the text or figures of this JoVE article
Request PermissionThis article has been published
Video Coming Soon
Copyright © 2025 MyJoVE Corporation. All rights reserved