
Thermal Imaging to Study Stress Non-invasively in Unrestrained Birds
In This Article
Summary
There is a need for a non-invasive assessment of stress. This paper describes a simple protocol using thermal imaging to detect a significant response in eye-region temperature in wild blue tits to a mild acute stressor.
Abstract
Stress, a central concept in biology, describes a suite of emergency responses to challenges. Among other responses, stress leads to a change in blood flow that results in a net influx of blood to key organs and an increase in core temperature. This stress-induced hyperthermia is used to assess stress. However, measuring core temperature is invasive. As blood flow is redirected to the core, the periphery of the body can cool. This paper describes a protocol where peripheral body temperature is measured non-invasively in wild blue tits (Cyanistes caeruleus) using infrared thermography. In the field we created a set-up bringing the birds to an ideal position in front of the camera by using a baited box. The camera takes a short thermal video recording of the undisturbed bird before applying a mild stressor (closing the box and therefore capturing the bird), and the bird’s response to being trapped is recorded. The bare skin of the eye-region is the warmest area in the image. This allows an automated extraction of the maximum eye-region temperature from each image frame, followed by further steps of manual data filtering removing the most common sources of errors (motion blur, blinking). This protocol provides a time series of eye-region temperature with a fine temporal resolution that allows us to study the dynamics of the stress response non-invasively. Further work needs to demonstrate the usefulness of the method to assess stress, for instance to investigate whether eye-region temperature response is proportional to the strength of the stressor. If this can be confirmed, it will provide a valuable alternative method of stress assessment in animals and will be useful to a wide range of researchers from ecologists, conservation biologists, physiologists to animal welfare researchers.
Introduction
Stress is a central concept in biology, describing the emergency response of an organism in response to an environmental challenge attempting to restoring homeostasis 1,2. Under stress, blood glucose, fatty acids and amino acids levels, heart rate, respiratory rate and metabolic rate all increase, and blood is diverted from the periphery to the core organs 2. This generic pattern of physiological changes primes the animal to be able to respond quickly and adaptively to an array of social and physiological challenges. Whilst recognizing and understanding stress is at the heart of both pure and applied animal research, assessing stress in unrestrained animals remains a challenge.
A widely used physiological marker of stress is an increase in the levels of circulating glucocorticoid hormones, such as cortisol and corticosterone 1,2. A great strength of this approach is that their concentrations increase in proportion to stressor intensity, allowing stress to be quantified. However, glucocorticoids are not ‘stress’ hormones per se, but mobilisers of energy stores 2. As such glucocorticoid levels change also with energy requirements, time of day, age and reproductive status 3,4, as well as in response to apparently positive situations, such as mating opportunity 5. Glucocorticoid levels, therefore, must be interpreted cautiously and within a context. Measuring the glucocorticoid response to acute stress has also some limitations. An acute stressor triggers a dynamic response of initially increasing glucocorticoid levels and subsequently returning to a baseline level 1,2. Glucocorticoid samples are typically obtained invasively, by blood sampling which is a stressor in itself and therefore can affect the measured glucocorticoid levels 6. Moreover glucocorticoid levels can only be measured at one or very few time points, which may not capture variation in peak levels and timing or response duration, limiting our ability to examine change through time of the dynamic stress response within individuals. Non-invasive methods of hormone sampling, such as from feces 7, hair or feathers 8, measure average glucocorticoid levels over a longer time scale, of days or months, although useful to study chronic stressors, are not applicable to the study of acute stress. As even the best established methods offer only a limited perspective on variation in acute stress amongst individuals there is a need for an alternative methodology in physiological stress measurements.
As the stress response involves a number of physiological effects there are other candidates that could indicate stress. Among others, sympathetically-mediated vasoconstriction channels blood from the periphery to the body core. This concentration of blood and hence heat, along with various forms of stress-induced thermogenesis, warms the core 9. As such, core warming, termed stress-induced hyperthermia (SIH) has also been used as a marker of acute stress in pharmaceutical research 10. SIH typically raises core body temperature by 0.5–1.5 °C within 10–15 min of an acute stressor 10. It is a relatively well documented phenomenon that a commonly applied experimental stressor of catching and handling an animal can raise core body temperature in a range of mammal and bird species 11–17. Importantly, SIH correlates with other established indicators of stress, such as heart rate 18, glucocorticoid levels 19 and behavior 20,21. And like glucocorticoid levels, core temperature has been linearly related to stress level in some species 22. However, as with blood sampling, the measurement of core temperature is invasive in itself, requiring the insertion or implantation of a probe 10. Baseline core temperature gradually increases each time when the stress-inducing handling or probe insertion must be repeated 23. Recent developments in temperature recording equipment that allow accessing data remotely may provide a solution, at least for large animals 24.
Within the same mechanism that generates SIH, though, lies yet another potential marker of stress: the peripheral vasoconstriction that moves blood, and with it heat, to the core simultaneously cools the skin 17. Unlike core temperature, skin temperature can be measured completely non-invasively, by infrared thermography (IRT). IRT converts the infrared radiation emitted from the surface of an object into temperature 25. As an animal’s surface typically has few bare patches from which skin temperature can be derived directly, it requires access to naturally exposed skin (e.g., area around the eye) or creating a bare patch by trimming fur or feathers. Provided access to a suitable exposed area of skin and the animal can be kept in the field of view of the camera, IRT cameras may be used to collect continuous skin temperature measurements remotely, possibly allowing the complete temperature response to be filmed and compared between individuals. While it has already been shown in chickens that surface temperature responds to acute stress 26, the novelty of this study is that it measures surface body temperature of wild animals in a finer temporal resolution than previous studies and also shows that the expected skin temperature drop can be detected in the field where temperature, humidity and weather are variable. The aim of this paper is to describe the necessary methodology to measure skin temperature of an unconstrained animal using thermal imaging. We use capture to induce a mild acute stress in free-living blue tits (Cyanistes caeruleus, Linnaeus 1758) and describe how to capture suitable imagery, analyze the images and process the data to produce temperature response curves against time that demonstrate a significant cooling of the birds’ skin temperature in response to the mild stressor. This can provide a valuable alternative method to assess stress in wild and captive animals useful to a wide range of researchers from ecologists, conservation biologists and physiologists to animal welfare researchers.
The study was carried out in the period between 17th December 2013, and 4th January 2014 in a deciduous oak (Quercus spp.) forest at the Scottish Centre for Ecology and the Natural Environment (SCENE), University of Glasgow at the eastern shore of Loch Lomond, west central Scotland (56.13°N, 4.13°W). The protocol involves three main steps: (1) Setting up suitable conditions under which to capture thermal images from a free-ranging animal, (2) applying an acute stressor while taking a thermal video, and (3) extracting and processing data from the thermal images that then can be used to characterize the animal’s response to the acute stressor. In our case we attracted a free-living passerine, the blue tit to a feeding box (filming set-up) where conditions for thermal image capture were optimized, and then applied a capture stress by closing the feeding box remotely when the bird was inside. The description of thermal image capture and data extraction is specific to the equipment we used, and may vary between thermal imaging systems. Data processing is described using an open-source software.
Protocol
Ethics Statement:
The work involved a routine trapping method of free-living small passerines approved by the British Trust for Ornithology and the capture protocol eliciting a mild stress in the bird was carried out under UK Home Office licenses.
1. Set-up for Filming
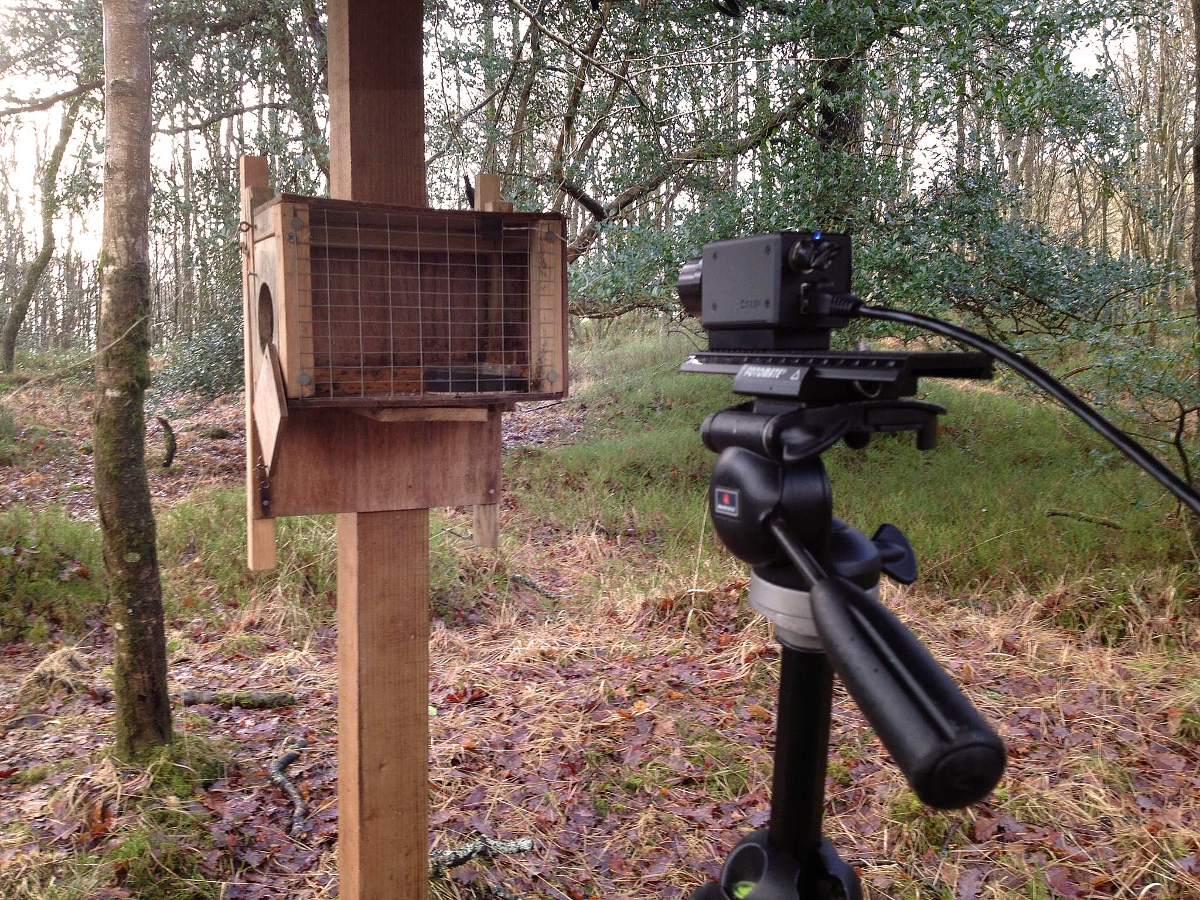
- Create a filming set-up where birds are encouraged to position themselves in front of the camera (Figure 1). The bird enters the set-up through a hole in one end wall and has access to food close to the opposite end wall.
- In order to habituate the birds to the set-up, provide a suitable food (e.g., peanut kernels) at the feeder for several weeks prior to recording. Apart from provision of the food, leave the set-up undisturbed. During this period, place a dummy tripod in front of the feeder to allow the birds to also habituate to the camera.
- On the day of recording, reduce the availability of peanut kernels in the set-up by removing all remaining food from the feeder and replacing it with food contained in a transparent container with only a small hole at the center on the top through which birds can access the food. Position this food container in the center of the cage at the end opposite to the entrance hole.
- Place a small square of black insulation tape of known emissivity to that of natural integument in one of the corners of the mesh of the box so it appears in all images. Attach the black insulation tape to a thermocouple connected with a temperature logger that records the temperature of the black insulation tape with a resolution of 0.1 °C every 1 sec.
- Place the thermal imaging camera 50 cm from the center of the box trap so that all of the box fits within the camera’s field of view, and birds feeding from the clear container will be positioned in the camera’s zone of focus. Connect the camera to a laptop, set the camera to record images at on average of 7.5 frames per second (with a time stamp), and send images to the laptop’s hard disk to be saved there.
- Attach a fishing line to the rotating door of the set-up and roll it out to a position where the experimenter is hidden from view of the birds, but the set-up can still be observed — about 20 m from the set-up.
2. Filming the Bird’s Response to a Mild Acute Stress
- Once a bird enters the feeding box, leave the bird undisturbed in the box for ca. 5 sec.
- Pull the fishing line after the bird had spent ca. 5 sec in the box to close the feeding box. Take care that the bird is still at the far end of the box in order to minimize the risk of injury to the bird.
- Immediately approach the feeding box and stand motionless behind the camera for approximately 3 min. Then retrieve the bird from the box and let it go.
3. Extraction of Eye-region Temperature from Thermal Images
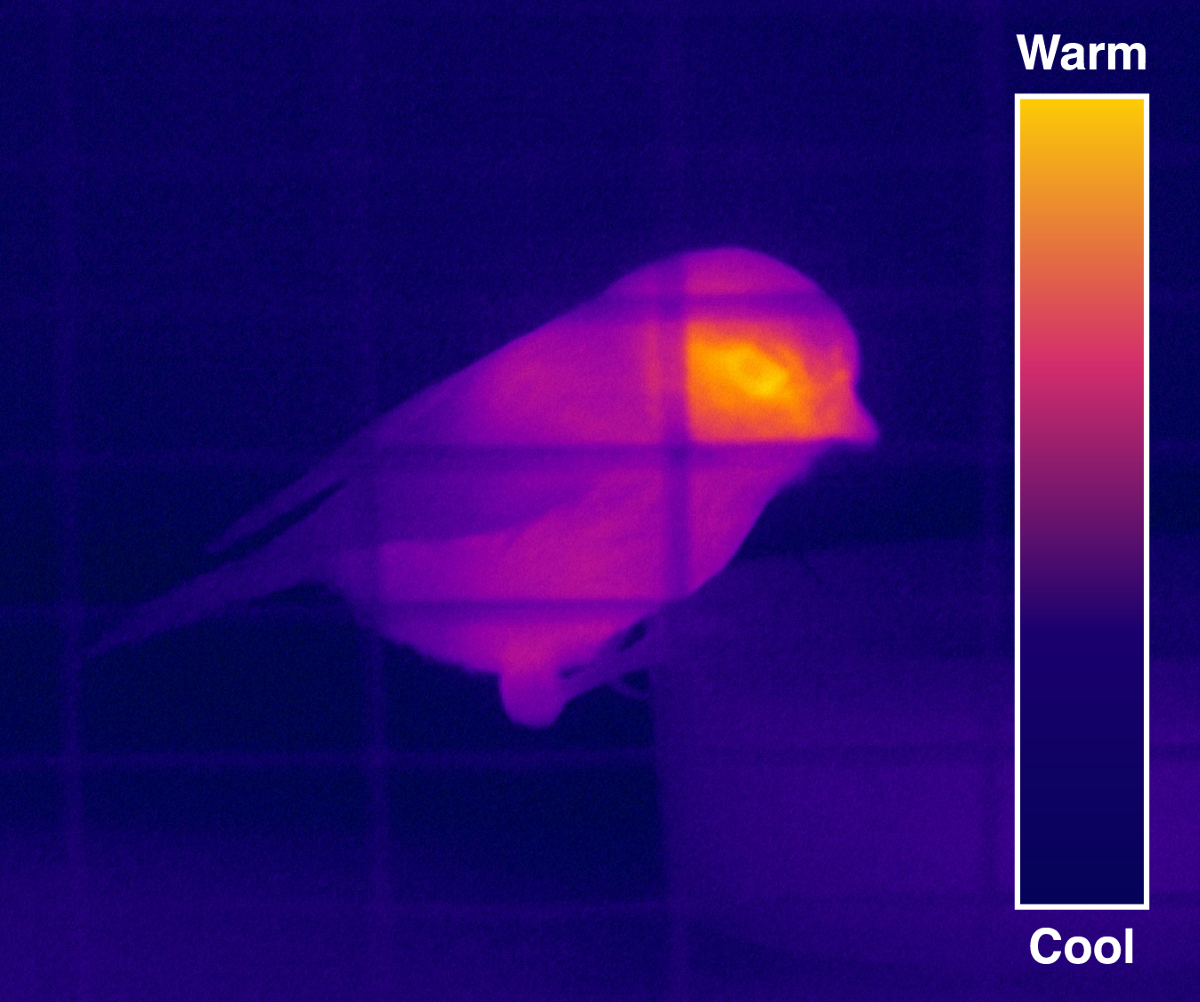
- Extract maximum temperature from each frame. Note: The maximum temperature was virtually always recorded from within the region around the eye, bounded by the exposed skin of the periophthalmic ring (Figure 2), and is hereafter referred to as eye-region temperature.
- In the Thermal Imaging Analysis Software right click on image, ‘add’ a new plot for the image maximum. Then, right click on the plot that exports the data (eye-region temperature and the time the frame was taken) to a CSV file.
- Delete from the CSV file all lines from frames where the eye-region of the bird was not visible.
- Plot maximum temperature against time in R 27, identify manually points where temperature spikes > +0.2 ºC between two successive readings when the nictitating membrane was pulled over the eye (blinking) and points with low values outside the range of body temperatures for birds 28 (i.e., when the eye-region was visible but blurred through motion for multiple frames) and then remove the relevant lines from the CSV data file produced during step 3.1.
- Measure ambient temperature.
- Download the data (time and logger temperature) from the temperature logger onto a computer and export into a spreadsheet.
- To get the ambient temperature from the thermal image, in the Thermal Image Analysis Software draw a square over the black insulation tape that covered the temperature logger probe, then right click on the square and select ‘add new plot' for the square's average temperature.
- Then, right click that plot, to export the data (time and IRT temperature) to a CSV file. Merge the two resulting temperature time series for temperature logger and thermal image matching for time into one spreadsheet.
- Correct eye-region temperature against ambient temperature. Export the spreadsheet created in step 3.4 into the CSV file matching for time. To each retained eye-region temperature add the difference between the temperature logger and the thermal imaging-derived temperature values (logger temp – IRT temp) measured at the same time.
- Carry out automated filtering to remove less accurate low eye-region temperature values using the peak search algorithm (see Supplemental Code File) to extract the highest (and therefore most accurate) points in the data automatically.
Note: The peak search algorithm reorganizes the temperature data into a vector with a user-defined width (span), recommended span = 3, extracting the central value in rows where the numbers either side are lower, i.e., the peaks. - Use linear interpolation to close the gaps left by sequences when no peak was extracted, and when the eye-region wasn't visible. Use the command na.approx (zoo package v1.7-11 in R 27) to give a single temperature value per second for each individual.
- In the CVS data file, add a value of 0.2 to each eye-region temperature to correct for the effect of taking the images through a mesh.
Note: Tests showed that when a black body, heated to approximate mean bird body temperature of ~41 ºC in its active phase 28, was imaged through the mesh window with the same mesh size as used in the filming set-up, temperatures recorded by the thermal imaging camera in areas not obscured by the wires were 0.2 ºC lower than values obtained without the intervening mesh (mean difference = -0.2 ºC ± 0.085 SD, n = 30, temperature range of black body = 41.6–42.5 ºC).
Note: This is the correction factor specific to the conditions in this study and is likely to vary with instrument make, and type and width of the mesh between the animal and the camera, and in each situation needs to be established for the specific study conditions. - From the maximum eye-region temperatures recorded from before the box was closed select the highest value, which will constitute the baseline eye-region temperature of the undisturbed bird. Add this baseline eye-region temperature as a new column to the CVS file (baseline). Then subtract the baseline value from each retained maximum eye-region temperature value, generating a new column in the CVS data file.
Note: This new value now express the bird’s response to mild acute stress as deviation from its undisturbed baseline temperature. - Plot the deviations in maximum eye-region temperature from the baseline eye-region temperature of all individuals from after the trap was closed using the command ggplot (package ggplot2 v1.0.0 in R 27). Generate bootstrapped 95% confidence intervals using the option mean_cl_boot (package ggplot2 v1.0.0 in R 27). For details see the Supplemental Code File.
Representative Results
Results from 9 free-living blue tits are presented that illustrate the information that can be obtained from thermal imaging and demonstrate that the predicted signal of stress in the bird’s eye-region temperature can be detected in free-ranging animals. Each bird was filmed for an average of 5.1± 0.9 sec (n=9) before the box’ door was closed. This allowed the calculation of the undisturbed bird’s eye-region temperature (baseline temperature) to which all subsequent measures can be referred to. In tests conducted on 20 sec thermal video clips of undisturbed blue tits arriving and feeding within a trap (n=9 birds different from the ones used for the application of a mild stressor), correlations of r > 0.7 were found to exist between the maximum eye-region temperature recorded during the first 5 sec, and the maximum recorded in the first 10, 15 and 20 sec (Figure 3). This was interpreted as indicating that the maximum value recorded in the initial few seconds after trap entry was representative of the longer-term level, and the mean eye-region temperature during approximately 5 sec immediately preceding box closure were used as the baseline value. The blue tits in this sample had a mean baseline eye-region temperature of 38.4 ± 0.5 °C (mean ± SE) and ranged from 35.8 to 39.9 °C (n=9). Once the bird fed for 5 sec to allow the calculation of the baseline eye-region temperature, the box door was closed by the experimenter. All birds noticed the closure of the box as evidenced by their attempted escape flights.
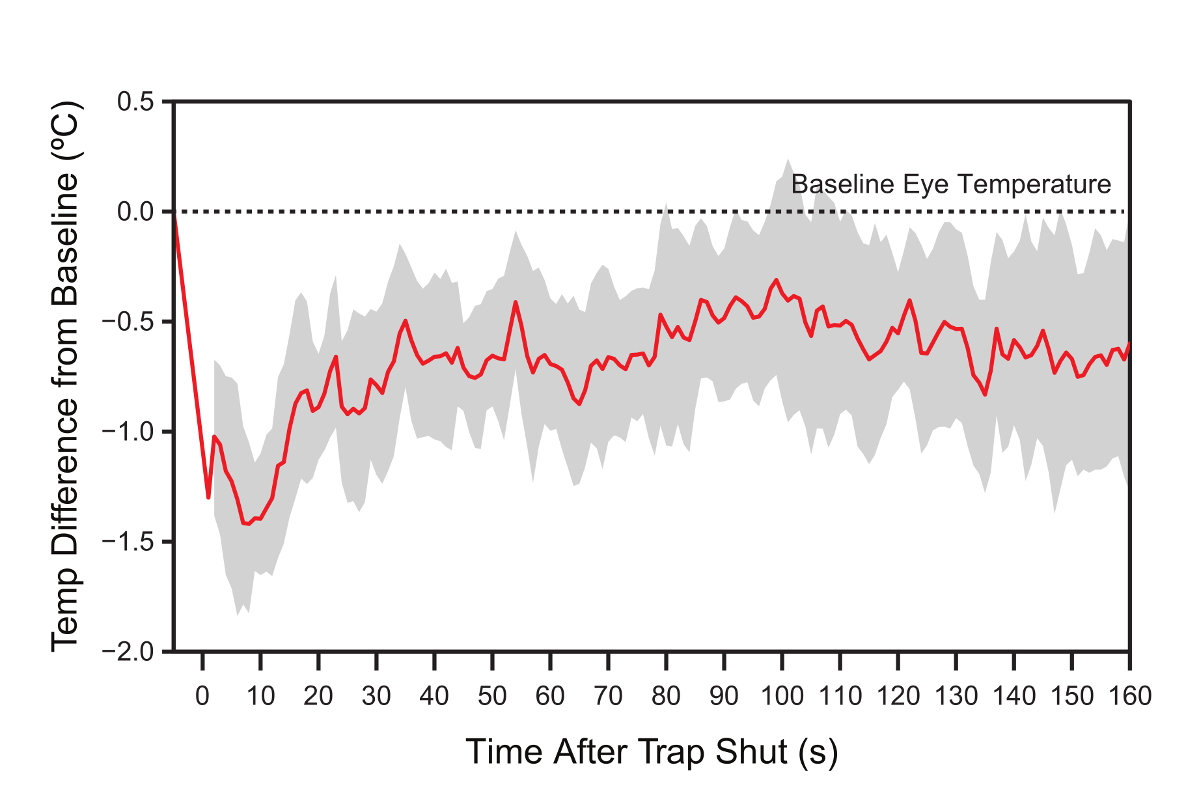
Upon closure of the trap, the eye-region temperature dropped rapidly and reached a minimum eye-region temperature ~1.3 °C below the baseline temperature after ~10 sec (Figure 4). Figure 4 shows the composite curve based on the maximum eye-region temperature of all nine individuals average for every second. As the timing and the magnitude of the eye-region temperature drop varies between individuals the composite curve masks the true extent of the temperature response. The mean temperature drop calculated for each individual separately is 2.0 ± 0.2 °C and the lowest point is reached after 9.4 ± 2.8 sec (mean ± SE). From then on, eye-region temperature gradually returned towards baseline eye-region temperature over the following 2-3 min but did not quite reach the baseline by the end of the trial.

Figure 1. The filming arena. The set-up in the field was designed to attract the birds to the field of view of the camera where a mild acute stressor could be applied, using a feeding box. The set-up consisted of a 25 by 14 cm and 16.5 cm high box built from plywood, with a front panel of galvanized wire mesh with an aperture size of 1 by 2.5 cm. The mesh allows infrared radiation to pass through, making it possible to film birds whilst inside the set-up. Wire mesh was chosen, as glass and most plastics do not transmit infrared radiation. A hole of 60 mm diameter was cut in the left end wall to allow bird entering the set-up and gain access to the food placed at the right end of the box. A temperature logger probe sandwiched between two squares of black insulation tape (marked by black arrow) is attached to the top right corner of the front panel to record a reference temperature. The mild acute stressor is applied to the bird inside by closing the box. Pulling on a fishing line attached to a rotating door at the entrance hole allowed the experimenter to close the box when a bird is inside. The thermal imaging camera set in front of the trap records the whole sequence of events. Please click here to view a larger version of this figure.

Figure 2. Thermal Image of a Blue Tit. The majority of a passerine’s body is well insulated by feathers (or to a lesser extent by leg scales), but the skin around the eye is exposed and radiates most heat under normal circumstances, and is surrounded by cooler integument or background. This is shown in this thermal image by the yellow color (highest temperature) around the eye, the orange, red, purple and blue color signify cooler and cooler temperatures. Please click here to view a larger version of this figure.

Figure 3. Repeatabilities of baseline temperature measured over different periods of time. Correlation coefficients between the maximum temperature recorded in the first 1-8 sec of a clip and the ‘mean of the maximums’ within 0.5º of the highest value recorded for the first 10, 15 and 20 sec of the clip (represented by red, blue and green lines, respectively). All clips were 20 sec in duration (n=9). During initial analysis using a larger dataset, a number of the ‘means of the maximums’ were calculated from just 1 value, and gave the same value for rho across all comparisons. These clips were removed from the analysis, leaving only those where means were calculated from more than 3 measurements. Please click here to view a larger version of this figure.

Figure 4. Response of the eye-region temperature to trapping. There is a very clear and pronounced signal of the trapping event reflected in the change of eye-region temperature over time. To compare across individuals that vary in their baseline temperature, residual eye-region temperature, as the difference of the actual temperature and that individual’s baseline temperature, is plotted on the vertical axis. This is plotted against time with the closure of the trap set as 0 and the bird removed from the trap after 3 min. The red line shows the average residual temperature and the grey band represents the 95% confidence interval. Please click here to view a larger version of this figure.
Discussion
The aim of this paper is to describe the necessary methodology to measure changes in skin temperature of a free-living animal in response to an acute stressor. This study demonstrated that rapid changes in skin temperature associated with an acute stress response in wild birds can be captured non-invasively using IRT. This procedure involved five important stages (1) design of appropriate field set-up using a highly portable thermal imaging system, (2) measurement of baseline temperature, (3) application of a mild stressor involving capturing the bird in the set-up, (4) post hoc automated sampling of eye-region temperature and (5) calibration of extracted temperature data. The methodology described here was applied to the capture of wild blue tits. Representative baseline eye-region temperatures could be captured in as little as 5 sec. The estimated time required to record one bird in the field was about 1 hr, with a further hour required to process the 3 min thermal video sequence.
Collecting good data on an animal’s skin temperature requires high quality thermal images. Thermal imaging cameras only differ fundamentally from visible light cameras in terms of the wavelength of the electromagnetic radiation that they detect, and thus many of the concepts that apply in photography (e.g., field of view, depth of field) also apply in thermography. As commonly practiced by wildlife photographers, any location that an animal visits predictably, where natural (e.g., nest sites) or artificial (e.g., feeders), could be used for collecting thermal images. Attracting animals to the camera rather than attempting to follow them though their habitat has the advantage of allowing us to set up the camera in advance, to collect high-quality image with minimal disturbance as soon as the animal comes into view. However, with this approach, it is vital to examine or account for the effects of that specific context of measurement on stress or skin temperature. For example, here, birds were measured in a feeding context, and food was used to actively lure blue tits into the set-up. Research on chickens suggests that acute positive experiences, such as the anticipation and consumption of a food reward in an associative learning trial can also lower eye temperature 29. As such, ‘baseline levels’ of individuals entering this particular set up may be influenced by the association of this act with reward. This possibility warrants further investigation, though if present, would be expected to enhance the drop from baseline levels already observed. Moreover, thermogenesis occurs with the digestion of food, though the specific effects of food consumed during baseline measurement are not expected to significantly elevate temperature within the 3 min trapping period 30.
This limitation considered, measuring all animals within the same context is also a great strength of this approach. The representative results showed that there was a large variation in eye-region temperature between individuals before the acute stressor was applied (baseline eye-region temperature). The variation in baseline eye temperature (coefficient of variation = 3.9%) could be partly due to measurement error or a true reflection of between-individual differences. The period the IRT camera recorded temperature of the black insulation tape over 5 sec when the tape's temperature did not change, the mean coefficient of variation was 0.26% (range 0.08% to 0.59%). Although measurement error is likely to be larger in a moving bird it nonetheless indicates that most of this variation in baseline eye-region temperature is indeed between individuals. The notion of relatively small measurement error on moving birds is further supported by the high repeatability of eye-region temperature over 20 sec during the baseline measurements (Figure 3). By controlling for context, we can ensure that all birds were engaging in the same activity. We can also minimize environmental contributions at the time of measurement to between-individual variation in skin temperature, For example, by ensuring that the locality is protected from confounding incident radiation that would, for thermal imaging, lead to an overestimation of the animal’s surface temperature. This can be done with working in the shade or by strategically placed shades, including most transparent plastics that block infra-red wavelength. The protocol presented here shows a simple set-up that could be easily applied to the situation of wintering blue tits. The blue tit was filmed while in a feeding box with a solid roof which avoided the exposure to direct sunlight. This set-up might also be applied to many other passerines that regularly come to artificial feeders at certain times of the year. As blue tits are comparatively small animals, they need to be filmed close-up to capture a good level of detail. As with photographic cameras, getting close to the subject — both in terms of actual distance, and magnification — dramatically reduces depth of field. To have the birds as large as possible in the field of view required filming them from the camera’s minimum focus distance, which in this case was 500 mm and reduced depth of field to 40 mm. Therefore, all features of the filming set-up need to be designed to encourage the animals to display their head within the relatively narrow zone of sharp focus of the particular camera used.
In response to a well-established acute mild stressor to an animal we expected rapid changes in the pattern of blood flow, from the periphery to the core via sympathetically mediated vasoconstriction that reduces skin temperature 17. The periorbital region was chosen as this provided the only region of the body that was uninsulated and is associated with a rich intermingled network of small blood vessels, the rete ophthalmicum that can affect the heat loss from the eye 31. The fast frame rate of the thermal videoing technique was able to show a drop in eye-region temperature of approximately 2 °C in 10 sec followed by a subsequent rise in temperature to within 0.5 °C of baseline within 3 min. Although peripheral cooling in response to mild stress has been recorded previously at around 1 min intervals 17,26, 32, the technique here showed that maximum drop in temperature may be extremely rapid. With lower time resolution the magnitude of this effect may be missed. This may be important when comparing differences in the stress response of different individuals. The re-warming of the bird after the rapid ‘fight or flight’ response did not return to baseline level as the bird remained within the box indicating that the bird remained physiologically stressed. The birds were released from the experimental set-up after an arbitrarily chosen cut-off point of ca. 3 min to minimize the period of restraint of a free-living animal. However, in future, trials may need to be longer to record the complete temperature response until the animal’s eye-region temperature has returned to baseline level, if logistically possible.
This new protocol involving a series of images collected before and after the stressor was applied now allows detailed study of the dynamic of the response to acute stress, and comparisons of multiple time-points between individual animals. Repeating this trial within individuals over different seasons or environmental conditions may allow the effects of environment on baseline or post-acute stress skin temperature to be disentangled, as a possible avenue into chronic stress assessment as well. .
Skin temperature of a bird is dependent not only on metabolic heat production and blood flow but also on heat exchange from solar radiation, wind speed and wetting 25. This precludes wet and windy conditions from accurate thermographic recordings. The eye-region temperature recorded by a thermal imaging camera can at times either be underestimated (negative error) or overestimated (positive error). Substantial positive error would require energy input, but this was avoided by the bird in the feeding box being shielded from the sun. One other source of positive error included when the bird blinked. Occasionally the bird briefly pulls its nictitating membrane over the eye-region and as it is stored internally at a temperature closer to that of the body core, blinking gives an anomalously high temperature reading when it covers the eyeball. This is, however, easily detected as it leaves a very marked signature and the affected frame can be removed. The main reason for a negative error in our records was motion blur. Any movement too swift to be captured sharply by the frame rate of the camera confounds the data captured from the small warm eye-region of the image with that of the surrounding cool area (motion blur), resulting in an underestimation of eye-region temperature. Thus after removing positive errors this makes the maximum temperature measured from the eye-region the most accurate measurement and an automated filtering using the peaks function command removes the less likely lower values of maximum eye-region temperatures.
In addition, as infrared radiation is absorbed by water vapor, surface temperature recorded will be influenced by the relative humidity of the environment. This can be accounted for by entering air temperature, relative humidity and distance to object into the analytical Thermal Image Analysis Software. However, a more accurate and efficient approach (as undertaken here) is to include a reference body of known temperature and emissivity within the field of view. In our case this was a square of black insulation tape with an emissivity of 0.97, which is approximately equivalent to that of natural integument 33. This allows calibrating the eye-region temperature by using the difference between the actual and thermal imaging-derived temperature values measured for the insulation tape. The surface temperature of the blackbody can then be used to calibrate images continuously throughout the measurement period.
Thanks to the technological advances in the development in the thermal cameras they can now be deployed as small lightweight cameras able to collect many frames per second over extended periods of time. Although thermal imaging is a widely used technique in avian research 25, size and expense of thermal imaging systems have restricted its use in the wild. In this study the system was highly portable, cost approx. £6,000 and provided high resolution thermal video capable of non-invasively capturing accurate temperature data from free-living animals without the need of handling birds. Recording at multiple frames per second allows measurements of high resolution time series of peripheral temperature and thus provides the possibility to explore the dynamic of the acute stress response. This is difficult to achieve with the conventional glucocorticoid sample that is constrained by the number of samples that can be taken within a period of time. Here we have extracted a time series of eye-region temperature with an interval of 1 sec, which was sufficient to demonstrate the eye-region temperature response to an acute stressor (capture), but higher temporal resolution would also be possible. The accumulation of a large number of images, however, requires some level of automation in the extraction of information from the images. The protocol describes a simple semi-automated process to extract the maximum temperature from each image. We were able to do this as the region of interest, the eye-region, was always the warmest spot in the image. Analysis could be more problematic if regions of interest are more complex and may require custom designed pattern recognition software (e.g.,34). In this study some manual filtering was required for situations where the eye-region temperature was over- or under-estimated but these were easily detected, but of course further automation is desirable. The measurements of stress-induced peripheral cooling by thermal imaging provides a valuable addition to other physiological measures of stress and the non-invasive aspect of this technique is highly advantageous for further studies involving captive and wild animals.
Capturing the complete stress response, infrared thermography clearly has great potential as a tool for stress assessment. To become a non-invasive alternative to established hormonal and core temperature assays though, it will be necessary to cross-validate amongst these measures and determine if skin temperature shows the same proportionality with stressor intensity, i.e., the extent of the skin temperature response can reflect the strength of the stressor. Future research should also address whether skin temperature captures chronic stress. Whilst SIH in response to an acute stressor is expected to be transient, recurrent exposure to physical or psychological acute stressors can generate chronic elevation in core body temperature 35,36. Whether ongoing vasoconstriction contributes to this core elevation has not been tested explicitly. However, correlative studies on humans suffering from chronic stress-related illness do show reduced finger temperatures 37. A final attribute to explore is valence: the ability to distinguish positive from negative events. Hormonal assays cannot distinguish valence 5, with glucocorticoid levels appearing to reflect level of excitation rather than stress specifically. Research on comb temperature in domestic chickens exposed to aversive and positive stimuli suggest skin temperature may be similarly akin to general arousal 22,29. However, in humans, different emotional states elicit regionally specific changes in skin temperature, for example periorbital warming and cheek cooling when startled 38, but overall decreased skin temperature when laughing 39. Comparisons between different regions may yet reveal emotional state. Using the recommendations laid out in this paper, it will be possible to address all of these questions, and validate skin temperature as a non-invasive marker of stress.
Disclosures
The authors declare that they have no competing financial interests.
Acknowledgements
This work was supported by a BBSRC project grant to DMcK, DMcC and RGN (BB/K002775/1) and a PhD studentship [to JP, BB/J013854/1]. We gratefully acknowledge the fantastic advice on technical equipment and field techniques that we received throughout the project from Nozrat Mirzai (Bioelectronics Unit University of Glasgow), Ross McLeod and Matthew Clavey (ThermalVision Research) as well as SCENE for all their logistic support of the field work. We would also like to thank Debbie Kelton at Veracity for generously providing equipment used to power the thermal imaging camera in the field.
Materials
| Name | Company | Catalog Number | Comments |
| Thermal Imaging Camera | FLIR | A65 (f=25mm) | Compact (106 × 40 × 43 mm) & low cost |
| Thermal Image Analysis Software | FLIR | ResearchIR v3.4 | Allows high speed thermal video recording and thermal pattern analysis |
| Temperature logger | Gemini Data Loggers | Tinytag Talk 2 TK-4023-PK | Monitors from -40 to +125°C using accompanying temperature probe |
References
- Romero, L. M., Dickens, M. J., Cyr, N. E. The reactive scope model - A new model integrating homeostasis, allostasis, and stress. Hormones and Behavior. 55, 375-389 (2009).
- McEwen, B. S., Wingfield, J. C. The concept of allostasis in biology and biomedicine. Hormones and Behavior. 43, 2-15 (2003).
- Rensel, M. A., Schoech, S. J. Repeatability of baseline and stress-induced corticosterone levels across early life stages in the Florida scrub-jay (Aphelocoma coerulescens). Hormones and Behavior. 59, 497-502 (2011).
- Wingfield, J. C. Comparative endocrinology, environment and global change. General and Comparative Endocrinology. 157, 207-216 (2008).
- Buwalda, B., Scholte, J., de Boer, S. F., Coppens, C. M., Koolhaas, J. M. The acute glucocorticoid stress response does not differentiate between rewarding and aversive social stimuli in rats. Hormones and Behavior. 61, 218-226 (2012).
- Romero, L. M., Reed, J. M. Collecting baseline corticosterone samples in the field: Is under 3 min good enough. Comparative Biochemistry and Physiology - A Molecular and Integrative Physiology. 140, 73-79 (2005).
- Harper, J. M., Austad, S. N. Fecal glucocorticoids: a noninvasive method of measuring adrenal activity in wild and captive rodents. Physiological and Biochemical Zoology. 73, 12-22 (2000).
- Bortolotti, G. R., Marchant, T. A., Blas, J., German, T. Corticosterone in feathers is a long-term, integrated measure of avian stress physiology. Functional Ecology. 22, 494-500 (2008).
- Oka, T., Oka, K., Hori, T. Mechanisms and mediators of psychological stress-induced rise in core temperature. Psychosomatic Medicine. 63, 476-486 (2001).
- Bouwknecht, A. J., Olivier, B., Paylor, R. E. The stress-induced hyperthermia paradigm as a physiological animal model for anxiety: a review of pharmacological and genetic studies in the mouse. Neuroscience and Biobehavioral Reviews. 31, 41-59 (2007).
- Moe, R. O., Bakken, M. Effects of Handling and Physical Restraint on Rectal Temperature, Cortisol, Glucose and Leucocyte Counts in the Silver Fox (Vulpes vulpes). Acta Veterinaria Scandinavica. 38, 29-39 (1997).
- Cabanac, M., Aizawa, S. Fever and tachycardia in a bird (Gallus domesticus) after simple handling. Physiology, and Behavior. 69, 541-545 (2000).
- Cabanac, A. J., Guillemette, M. Temperature and heart rate as stress indicators of handled common eider. Physiology, and Behavior. 74, 475-479 (2001).
- Carere, C., van Oers, K. Shy and bold great tits (Parus major): body temperature and breath rate in response to handling stress. Physiology, and Behavior. 82, 905-912 (2004).
- Gray, D. A., Maloney, S. K., Kamerman, P. R. Restraint increases afebrile body temperature but attenuates fever in Pekin ducks (Anas platyrhynchos). American Journal of Physiology. Regulatory, Integrative and Comparative Physiology. 294, R1666-R1671 (2008).
- Meyer, L. C. R., Fick, L., Matthee, A., Mitchell, D., Fuller, A. Hyperthermia in captured Impala (Aepyceros melampus.): A fright not flight response. J. Wildl. Dis. 44, 404-416 (2008).
- Busnardo, C., Tavares, R. F., Resstel, L. B. M., Elias, L. L. K., Correa, F. M. Paraventricular nucleus modulates autonomic and neuroendocrine responses to acute restraint stress in rats. Autonomic Neuroscience: Basic, and Cinical. 158, 51-57 (2010).
- Kramer, K., et al. Effect of conditioning on the increase of heart rate and body temperature provoked by handling in the mouse. ATLA Alternatives to Laboratory Animals. 32, 177-181 (2004).
- Lowe, T. E., Cook, C. J., Ingram, J. R., Harris, P. J. Changes in ear-pinna temperature as a useful measure of stress in sheep (Ovis aries). Animal Welfare. 14, 35-42 (2005).
- Ahola, L., Harri, M., Kasanen, S., Mononen, J., Pyykönen, T. Effect of family housing of farmed silver foxes ( Vulpes vulpes ) in outdoor enclosures on some behavioural and physiological parameters. Canadian Journal of Animal Science. 80, 427-434 (2000).
- Harri, M., Mononen, J., Ahola, L., Plyusnina, I., Rekilä, T. Behavioural and physiological differences between silver foxes selected and not selected for domestic behaviour. Animal Welfare. 12, 305-314 (2003).
- Van Bogaert, M. J. V., Groenink, L., Oosting, R. S., Westphal, K. G. C., Van Der Gugten, J., Olivier, B. Mouse strain differences in autonomic responses to stress. Genes, Brain and Behavior. 5, 139-149 (2006).
- Van Der Heyden, J. A. M., Zethof, T. J. J., Olivier, B. Stress-induced hyperthermia in singly housed mice. Physiology and Behavior. 62, 463-470 (1997).
- Singer, C., Ruf, T., Schober, F., Fluch, G., Paumann, T., Arnold, W. A versatile telemetry system for continuous measurement of heart rate, body temperature and locomotor activity in freeranging ruminants. Methods in Ecology and Evolution. 1, 75-85 (2010).
- McCafferty, D. J. Applications of thermal imaging in avian science. Ibis. 155, 4-15 (2013).
- Edgar, J. L., Nicol, C. J., Pugh, C. A., Paul, E. S. Surface temperature changes in response to handling in domestic chickens. Physiology, and Behavior. 119, 195-200 (2013).
- R Core Team. R: A language and environment for statistical computing. R Foundation for Statistical Computing. , (2014).
- Prinzinger, R., Pressmar, A., Schleucher, E. Body temperature in birds. Comparative Biochemistry and Physiology. 99, 499-506 (1991).
- Moe, R. O., Stubsjøen, S. M., Bohlin, J., Flø, A., Bakken, M. Peripheral temperature drop in response to anticipation and consumption of a signaled palatable reward in laying hens (Gallus domesticus). Physiology, and Behavior. 106, 527-533 (2012).
- Secor, S. M. Specific dynamic action: a review of the postprandial metabolic response. Journal of Comparative Physiology B. 179, 1-56 (2009).
- Midtgård, U. Scaling of the brain and the eye cooling system in birds: A morphometric analysis of the ophthalmicum. Journal of Experimental Zoology. 225, 197-207 (1983).
- Edgar, J. L., Lowe, J. C., Paul, E. S., Nicol, C. J. Avian maternal response to chick distress. Proceedings. Biological Sciences / The Royal Society. 278, 3129-3134 (2011).
- Hammel, H. T. Infrared emissivity of some Arctic fauna. Journal of Mammalogy. 37, 375-378 (1956).
- Khaliq, I., Hof, C., Prinzinger, R., Böhning-Gaese, K., Pfenninger, M. Global variation in thermal tolerances and vulnerability of endotherms to climate change. Proceedings. Biological Sciences / The Royal Society. 281, 20141097 (2014).
- Kant, G. J., Ra Bauman, ., Pastel, R. H., Myatt, C. A., Closser-Gomez, E., D’Angelo, C. P. Effects of controllable vs. uncontrollable stress on circadian temperature rhythms. Physiology, and Behavior. 49, 625-630 (1991).
- Endo, Y., Shiraki, K. Behavior and body temperature in rats following chronic foot shock or psychological stress exposure. Physiology and Behavior. 71, 263-268 (2000).
- Lin, H. P., Lin, H. Y., Lin, W. L., Huang, A. C. W. Effects of stress, depression, and their interaction on heart rate, skin conductance, finger temperature, and respiratory rate: Sympathetic-parasympathetic hypothesis of stress and depression. Journal of Clinical Psychology. 67, 1080-1091 (2011).
- Pavlidis, I., Eberhardt, N. L., Levine, J. A. Seeing through the face of deception. Nature. 415, 35 (2002).
- Nakanishi, R., Imai-Matsumura, K. Facial skin temperature decreases in infants with joyful expression. Infant Behavior and Development. 31, 137-144 (2008).
Reprints and Permissions
Request permission to reuse the text or figures of this JoVE article
Request PermissionThis article has been published
Video Coming Soon
ABOUT JoVE
Copyright © 2025 MyJoVE Corporation. All rights reserved