
A subscription to JoVE is required to view this content. Sign in or start your free trial.
Method Article
Implementation of a Coherent Anti-Stokes Raman Scattering (CARS) System on a Ti:Sapphire and OPO Laser Based Standard Laser Scanning Microscope
In This Article
Summary
Coherent anti-Stokes Raman scattering (CARS) microscopy based on inherent vibration of molecule bonds permits label-free chemically selective live cell imaging. This work presents the implementation of a complementary microscopy technique on a standard multiphoton laser scanning microscope based on a femtosecond Ti:sapphire laser and an OPO laser.
Abstract
Laser scanning microscopes combining a femtosecond Ti:sapphire laser and an optical parametric oscillator (OPO) to duplicate the laser line have become available for biologists. These systems are primarily designed for multi-channel two-photon fluorescence microscopy. However, without any modification, complementary non-linear optical microscopy such as second-harmonic generation (SHG) or third harmonic generation (THG) can also be performed with this set-up, allowing label-free imaging of structured molecules or aqueous medium-lipid interfaces. These techniques are well suited for in-vivo observation, but are limited in chemical specificity. Chemically selective imaging can be obtained from inherent vibration signals based on Raman scattering. Confocal Raman microscopy provides 3D spatial resolution, but it requires high average power and long acquisition time. To overcome these difficulties, recent advances in laser technology have permitted the development of nonlinear optical vibrational microscopy, in particular coherent anti-Stokes Raman scattering (CARS). CARS microscopy has therefore emerged as a powerful tool for biological and live cell imaging, by chemically mapping lipids (via C-H stretch vibration), water (via O-H stretch vibrations), proteins or DNA. In this work, we describe the implementation of the CARS technique on a standard OPO-coupled multiphoton laser scanning microscope. It is based on the in-time synchronization of the two laser lines by adjusting the length of one of the laser beam path. We present a step-by-step implementation of this technique on an existing multiphoton system. A basic background in experimental optics is helpful and the presented system does not require expensive supplementary equipment. We also illustrate CARS imaging obtained on myelin sheaths of sciatic nerve of rodent, and we show that this imaging can be performed simultaneously with other nonlinear optical imaging, such as standard two-photon fluorescence technique and second-harmonic generation.
Introduction
Optical microscopy has become a major technique for nondestructive visualization of dynamic processes in living biological systems with a subcellular resolution. Fluorescence microscopy is currently the most popular imaging contrast used in live cells due to its high specificity and sensitivity1. A large palette of fluorescent probes has emerged (exogenous dyes, genetically encoded proteins, semiconductor nanoparticles). Various sample illumination fluorescent-based techniques have flourished (such as confocal or two-photon microscopy) to perform 3D imaging and to reduce a main drawback of this technique which is photobleaching2. Other limitations include the requirement of fluorophore labeling because most of molecular species are not intrinsically fluorescent and therefore these fluorophores have to be artificially introduced in the imaged sample. This artificial manipulation may be disruptive especially for small molecules or induces potential photo-toxicity. These reasons make fluorescence microscopy not well suited for in-vivo observations. Hence, the use of optical imaging techniques with high sensitivity and specific molecular contrasts without the use of fluorescent molecules is highly desirable in biomedical science.
Several nonlinear optical imaging techniques without labeling or staining have emerged, including second-harmonic generation (SHG)3,4 and third-harmonic generation (THG)5. SHG microscopy has been used to image structural arrangements at the supramolecular level such as microtubules or collagen6. THG is generated from optical heterogeneities such as interface between an aqueous medium and lipids7. THG was also demonstrated to image myelin8,9. Both techniques can be implemented on a two-photon fluorescence microscope and require only one laser beam. However they require high power laser intensity (typically 50 mW at 860 nm for SHG10, 25 - 50 mW at 1,180 nm for THG9), which is deleterious in living samples, and do not provide the chemical specificity that is required to unambiguously image specific biological structures.
Chemically selective imaging can be obtained from inherent molecular vibration signals based on Raman scattering. When a beam of light hits matter, photons can be absorbed and scattered by atoms or molecules. Most of the scattered photons will have the same energy, i.e., frequency, as the incident photons. This process is called Rayleigh scattering. However, a small number of photons will be scattered at an optical frequency different from the frequency of the incident photons, i.e., with an inelastic scattering process called Raman scattering. The difference in energy originates from excitation of vibrational modes depending on molecular structure and environment. Therefore, spontaneous Raman scattering provides chemically selective imaging as different molecules have specific vibrational frequencies. However it is limited because of its extremely weak signal. Confocal Raman microscopy has been developed and provides 3D spatial resolution, but it requires high average power and long acquisition time11. To overcome these difficulties, recent advances in laser technology have allowed the rise of nonlinear optical vibrational microscopy, in particular coherent anti-Stokes Raman scattering (CARS)11,12,13.
CARS is a third-order nonlinear optical process. Three laser beams, composed of a pump beam at frequency ωP, a Stokes beam at frequency ωS and a probe beam (most often being the pump) are focused in a sample and generate an anti-Stokes beam at frequency ωAS= (2ωP - ωS)14. The anti-Stokes signal can be significantly enhanced when the frequency difference between the pump and the Stokes beams is tuned to a Raman molecular vibration ΩR=(ωP - ωS). CARS signal is based on multiple photon interaction. It generates therefore a coherent signal orders of magnitude stronger than spontaneous Raman scattering.
CARS microscopy was first experimentally demonstrated by Duncan et al.15. Zumbusch et al. improved then the technique, by using two focused near-infrared femtosecond laser beams with an objective lens of high numerical aperture, allowing the phase matching condition of CARS and avoiding the two-photon non-resonant background16. CARS microscopy has therefore emerged as a powerful tool for live cell and tissues imaging, by chemically detecting molecules such as lipids (via C-H stretch vibration)17,18, water (via O-H stretch vibrations), proteins, DNA in live cells19,20 but also deuterated chemical compounds for pharmaceutical21 and cosmetic applications22.
The major limitation of nonlinear microscopy originates from the complexity and the cost of the optical sources. A CARS system requires two wavelength tunable lasers with short pulse durations and with temporally and spatially synchronized pulse trains. Early CARS microscopes were based on two synchronized picosecond Ti:sapphire lasers20. CARS imaging was also obtained from a single femtosecond Ti:sapphire laser generating a supercontinuum light source23. Recently, laser sources composed of a single femtosecond Ti:sapphire laser pumping a tunable optical parametric oscillators (OPO) have been used for CARS microscopy. This set-up allows intrinsically temporally synchronized beams with a difference of frequency between the pump and the Stokes beam covering the full molecular vibrational spectrum24. In addition, laser scanning microscopes based on a turn-key fs laser and an OPO, primarily used for two-photon fluorescence (TPF) are now available for non-physicists. The potential of such set-ups can be greatly enhanced without requiring supplementary investment by the incorporation of other nonlinear optical imaging, since each nonlinear (NLO) imaging modality is sensitive to specific structures or molecules. Multimodal NLO imaging therefore capitalizes the potential of NLO microscopy for complex biological samples25. The coupling of these techniques has allowed the investigation of many biological questions, in particular on lipid metabolism, skin or cancer development26, skeletal muscle development27, atherosclerotic lesions28. Moreover, the implementation of laser beam scanning with CARS gives the capability of high-rate imaging, i.e., an appealing tool to study dynamical processes in vivo.
The aim of this work is to show each step to implement the CARS technique on a standard multiphoton laser scanning microscope. The microscope is based on a fsec Ti:sapphire laser and an OPO (pumped by the Ti:sapphire laser) operated by a software for biologists. The integration was performed by adjusting the length of one of the laser beam path in order to synchronize in time the two beams. We describe the step-by-step implementation of this technique which requires only basic background in experimental optics. We also illustrate CARS imaging obtained on myelin sheaths of sciatic nerve of rodents, and we show this imaging can be performed simultaneously with other nonlinear optical imaging, such as standard two-photon fluorescence technique and second-harmonic generation.
Access restricted. Please log in or start a trial to view this content.
Protocol

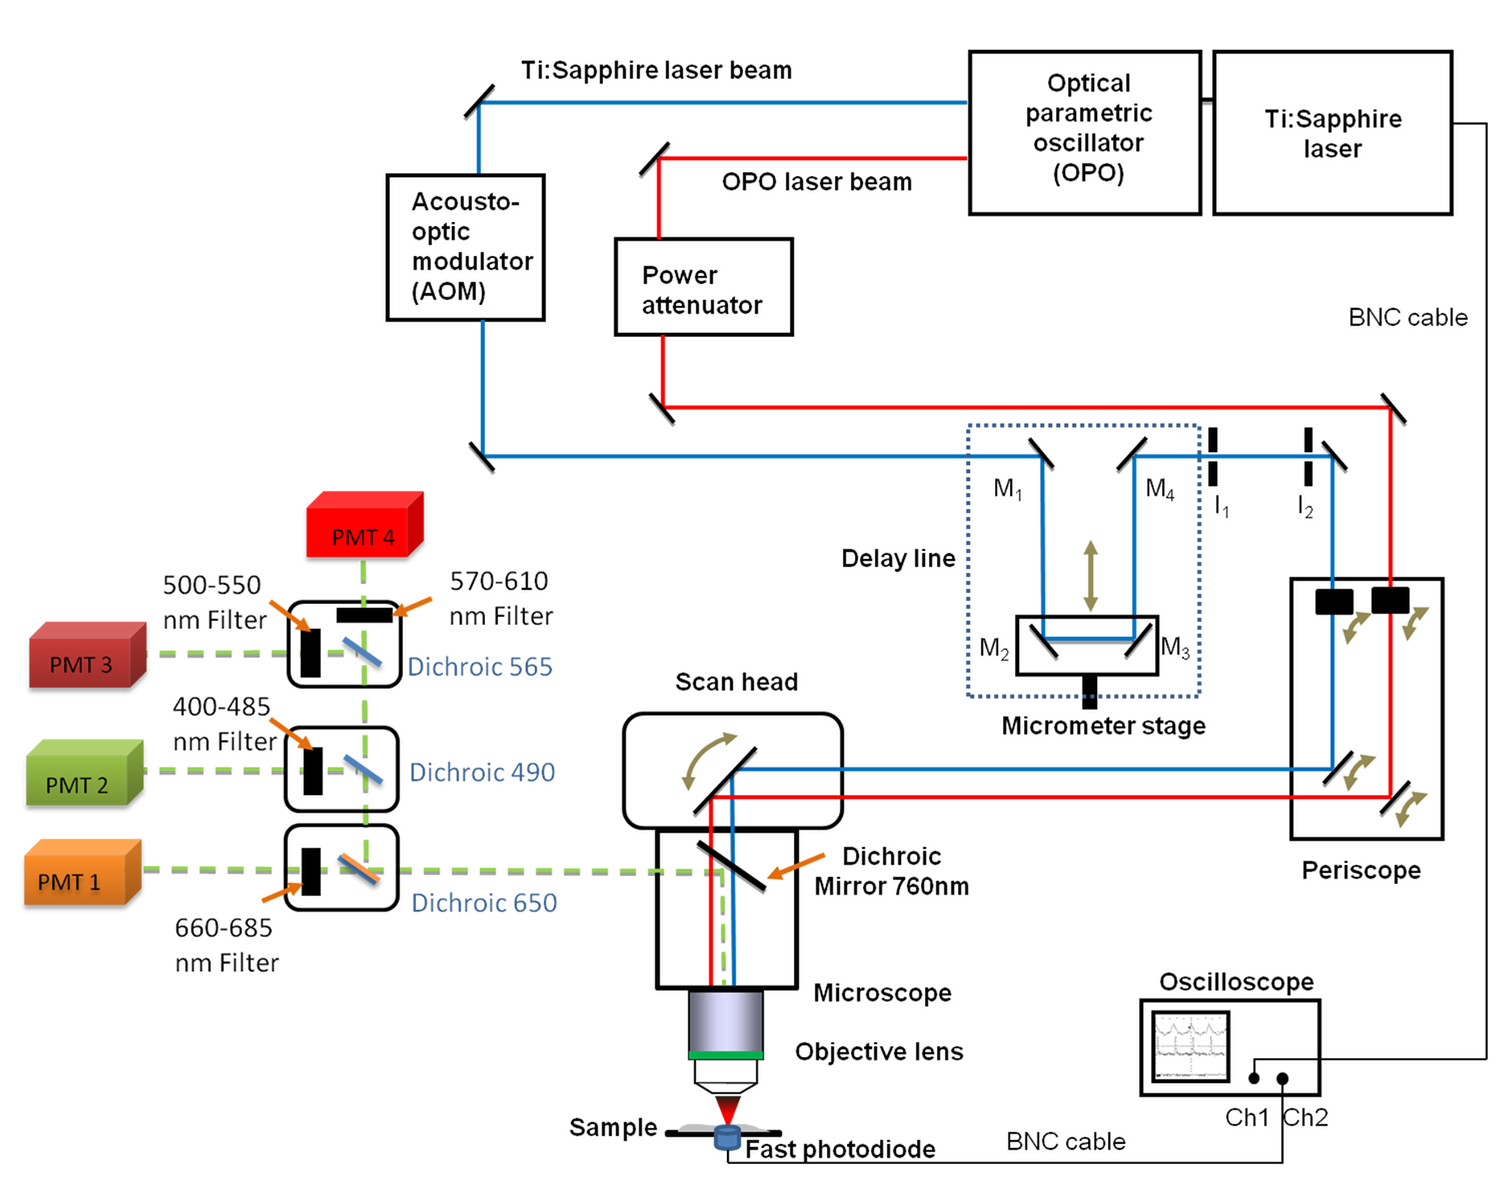
Figure 1. Schematic view of the general set-up. It includes the Ti:sapphire (680 - 1,080 nm) and the OPO (1,050 - 1,300 nm) lasers, the delay line with the 4 mirrors (M1 to M4), the fast oscilloscope, the photodiode and two fixed iris diaphragms I1 and I2. Mirrors M2 and M3 are fixed on a linear translation stage enabling to change the delay line length with a micrometer resolution. A 660 - 685 nm band pass filter was positioned in front of the PhotoMultiplier Tube (PMT) used for CARS imaging. Please click here to view a larger version of this figure.
1. Startup of the Laser System
- Verify that the Ti:sapphire wavelength is set to 800 nm or define this wavelength on the Ti:sapphire power supply controller. Turn the key from Standby to On to switch on the Ti:sapphire laser.
- Turn on the OPO laser at the back of the OPO controller and open the Ti:sapphire shutter on the Ti:sapphire power supply controller.
- Switch on the tablet computer to pump up the OPO. Click on the OPO Connected and Remote Connected icons on the tablet. Wait for 30 - 40 min for warming up.
- Switch on the microscope computer and turn on the "Microscope Components" switches. Start the software by double clicking the icon on the desktop.
- Into the software Acquisition tab, open the Laser tool in the Setup Manager to operate both lasers from the software. Select Ti:sapphire laser On and OPO laser On. Check the value of the optical laser power (typical values of 3,700 mW at 800 nm and 700 mW at 1,000 nm).
- To configure the beam path and lasers, open the Light Path tool in the Setup Manager tool group and check box the first Photomultiplier tube (PMT).
- To check the Ti:sapphire laser spot at the output of the objective, open the Channels tool in the Acquisition Parameter tool group. Select the Ti:sapphire power at low value (around 1%), reduce the gain to 0 (no image is needed at this stage) and click on the Continuous button to start the scanning procedure to launch the laser beam through the microscope objective. Check the presence of a red spot by direct observation by positioning the IR laser viewing card at the output of the air microscope objective (10X).
- To check the OPO laser spot, stop the scan of the Ti:sapphire laser by clicking on the Stop button. Select the OPO power at low value in the Channels window and click on the Continuous button.
2. Microscope Settings
- Manually place the dichroic mirror with a cutoff wavelength at 760 nm in the sideport slider in the infinity space above the objective nosepiece to launch the light up to 760 nm from the sample into the PMTs in non-descanned detection (NDD) mode.
- Set the narrow band pass filter at 660 - 685 nm in the NDD reflector cube in front of PMT1 to record only the CARS signal at 670 nm to reproduce the results presented in this work.
- Place a narrow band filter ranging from 500 to 550 nm in the NDD reflector cube in front of PMT3 for fluorescence observation of the myelin. Place a narrow band filter ranging from 565 to 610 nm in the reflector cube in front of PMT4 for SHG observation.
- To select in the software the recording of the signal on the detector with the ad hoc band pass filter, open the Light Path tool in the Setup Manager menu in the Acquisition tab. Activate the desired PMT (check box) and select a color for this channel. In this work, the green was chosen for CARS, red for fluorescence and magenta for SHG.
3. Temporal Synchronization
Note: The two laser beams originate from the same Ti:sapphire laser but the OPO beam is delayed when it is generated so the two beams are not synchronized in time when they reach the microscope. The goal here is to delay one of the two beams to re-synchronize them in time before they reach the microscope.
- Connect with BNC cables the input channel CH1 of the oscilloscope to the electrical BNC laser output (Sync. Out). Connect the input channel CH2 of the oscilloscope to the photodiode and choose the CH1 channel as the trigger channel by pressing TRIGGER MENU, then the main-menu button Source and then the side-menu button that corresponds to the channel selected CH1.
- Position and fix with optical mounting posts the photodiode in the focal plane of an air microscope objective (10X) or in the beam path of the microscope after removing the objective. Note: If necessary, remove the condenser and its carrier.
- In the Channels tool (Acquisition Parameter tool group), define the Ti:sapphire laser wavelength at 830 nm at low power (i.e., less than 1% of the full power). In the Acquisition Mode tool, reduce the scan area to one point in order to illuminate the photodiode with the tiniest beam. Switch on the laser scan by clicking on the Continuous button.
- Press AUTOSET on the oscilloscope front panel and manually move the position of the photodiode to get the pulse trains on the screen. Press RUN/STOP button to freeze the display.
- To save a copy of the oscilloscope display, insert a 3.5 inch floppy disk in the floppy disk drive or connect the GPIB port on the rear panel to a computer. Then press SHIFT HARDCOPY MENU, press FORMAT (main) to select TIFF image format and specify in the Port menu the output channel. Press HARDCOPY button to record the oscilloscope display of the pulse trains of the Ti:sapphire laser.
- Switch off the Ti:sapphire laser scan by clicking on the Stop button. By clicking Channels tool define the OPO signal at 1,107 nm and low power. Switch on the OPO laser scan and record the pulse trains of the OPO laser on the oscilloscope. Switch off the OPO laser scan.
- Compare the temporal shift between the Ti:sapphire and the OPO signals.
NOTE: The temporal shift tshift gives the length of the delay line LDelayLine which has to be implemented following the equation: LdelayLine = c × tshift where c is the speed of light. - Choose one of the laser lines.
NOTE: In this work, the Ti:sapphire laser line was chosen because free space was available near this laser line. In addition, this choice allows to achieve the re-alignment of the laser line with a visible laser light. - Open the laser line by removing the protective tubes at the position where the delay line will be implemented.
Caution! Wear appropriate safety goggles and remove chain bracelets or watch from wrists. - Select a wavelength in the visible range in order to be able to easily observe the laser beam (700 nm for instance, at low power in the Channels tool of the software). Switch on the laser scan.
- Place and set with optical mounting posts two iris diaphragms along the open laser line. Position one iris at the exit of the delay line and place the other iris at the entrance of the periscope.
NOTE: The periscope controls by two motorized mirrors piloted by the software the angle of entrance of the laser beam into the scanning head of the laser scanning microscope. - Decrease the iris diaphragm aperture and adjust the diaphragm positions to fit the laser beam path. Fix them on the optical table. Adjust the vertical position of a third mobile iris diaphragm, to check the height of the laser beam while successively positioning the four mirrors of the delay line.
NOTE: These iris diaphragms will serve as control for the re-alignment procedure by showing the path to follow. - Place the mirror M1 mounted on a compact kinematic mirror mount at the entrance of the delay line (as shown in Figure 1) and adjust its position and its orientation to maintain the beam height with the use of the mobile iris diaphragm. Place mirrors M2 and M3 (also mounted on compact kinematic mirror mounts) at 90° onto the translation stage which will be positioned at midcourse. Position them to fit the delay line length as previously calculated.
- Adjust the orientation of M2 and M3 with the use of the mobile iris diaphragm. Set M4 (also fixed on a compact mount) at the exit of the delay line (just before iris I1 as shown in Figure 1) and carefully adjust its position and angle to fit the laser beam path through the two fixed iris diaphragms.
- Position the laser viewing card at the output of the microscope objective and check the laser beam profile by clicking on Continuous to turn on the laser scan. Observe a uniform bright disk. If necessary, slightly adjust the orientation of M4.
- Position again the fast photodiode under the laser beam in the sample focus plane of the microscope. Observe the temporal shift between the Ti:sapphire laser beam and the OPO beam on the oscilloscope.
Note: If necessary, change the delay line length by moving the whole system M2, M3 mounted on the translation stage (without changing the translation stage tuning) to synchronize both pulses. Changes of few centimeters can be required.
4. Spatial Overlap of the Beams
Note: To produce a CARS signal, the spatial overlapping of the two laser beams is required. The alternate illumination of both beams on the same beads stained throughout with two different fluorescent dyes can be used to indicate the spatial shift. Fine adjustments of the mirror positions can then minimize the shift.
- Use pre-mounted fluorescent microspheres. Or mount microspheres in suspension on clean microscope slides as described below:
- Before sampling, mix (on a cortex mixer or by sonicating) the beads solution to be sure that the beads are uniformly suspended.
- Apply 5 μl of the bead suspension to the surface of a slide and spread with the pipette tip. Wait for the droplet to dry and then apply 5 μl of mounting medium, such as glycerol, water or immersion oil over the dry sample of beads. Cover the sample with a coverslip and seal the coverslip with quick-drying glue or melted paraffin.
- Place the fluorescent polystyrene beads fixed on a microscope slide under the 20X water objective. Add few drops of water to immerse the objective.
- To achieve the focus on the beads, open the Locate tab in the software to switch from the laser scanning mode to the direct observation of the sample with the eye, by pressing the Online button. Open the Ocular tool to select the ad hoc filter and switch on the halogen lamp by clicking on icons.
- Manually remove the dichroic mirror in the sideport slider in infinity space and use the focusing drive of the microscope to focus the sample plane by observing the beads with the oculars. Replace the dichroic mirror.
- In the Locate tab, switch to the laser scanning mode by pressing the Offline button. Go to the Acquisition tab to define the parameters for scanning: select the frame size to 512 pixels, a scan speed of 9, an averaging of 1, a bit depth of 8 bit and increase the scan area to the maximum.
- In the Channels tool of the Acquisition tab, add a Track (Track 1) if not already created. Select the wavelength at 830 nm and low power for the Ti:sapphire laser beam. Tick the color to green in the Track 1 box from the Channels window and in the PMT3 or the PMT4 box from the Light Path window.
- In the Channels tool of the Acquisition tab, add a second Track (Track 2). Select the wavelength at 1,107 nm and low power for the OPO laser beam. Tick the color to red in the Track 2 box from the Channels window and in the PMT3 box from the Light Path window.
- Adjust the gain of both tracks to 600. Then, sequentially apply the scan of the two beams onto the sample by clicking on Continuous.
- Observe the image in the screen area into the 2D view. In the Display View Option control block, adjust the display intensity.
Note: If necessary, move slightly the focusing drive to find the focus plane of the beads. Adjust the Crop and zoom the image in a single bead or in a group of adjacent beads. - Use the periscope controller to overlap the beams in x-y plane. In the software, open the Maintain tab. Click on the System Options and display the Motorized Periscope tool window. Use coarse and fine adjustments of the periscope mirrors of the Ti:sapphire laser beam in order to synchronize in space both images.
- For the periscope manipulation, use the first adjustment bars for vertical and the second one for horizontal movements of the laser beam. Move the beam with the input mirror until the image is slightly visible, and then compensate for the laser intensity with the output mirror of the periscope by clicking on "input" and "output".
- In order to vertically overlap the beams, in the Maintain tab, open the Collimator tool and adjust the value of the focal distance of the Ti:sapphire laser beam.
- Move gently the objective vertical position to check the difference of focus on both images. Or, take a z-stack of the sample by opening in the Acquisition tab the Z-Stack tool and choose the different parameters (range, number of slices). Press Ortho in the image screen area to see the beams in axial cross-section. Maximize the z-overlap by doing the same procedure several times.
5. Final Adjustments and Coherent Anti-Stokes Raman Scattering (CARS) Signal Observation from Olive Oil Droplets
- Put a droplet of olive oil on a glass plate and cover it by a glass cover slip. Add few drops of water to immerse a 20X water immersion objective. Focus at the edge of the cover slip by using the oculars (as explained previously in 4.2).
- In the Channels tool of the Acquisition tab, select in Track 1 the wavelength at 830 nm for the Ti:sapphire laser beam and at 1,107 nm for the OPO. Tick both lasers in Track 1 to get a simultaneous scan of both lasers. Set powers at low value for a start.
- In the Light Path window, select PMT1. Switch on the laser scans by clicking on the Continuous button. Move slightly the focus to deliver the laser light into the oil thin layer.
- If necessary, increase the optical power of both lasers. Adjust the display intensity in the Display View Option control block. Slowly move the translation stage of the delay line until the signal becomes significantly enhanced.
- After the fine alignments are complete, check whether it is really a CARS signal: Move slightly the translation stage; the intensity of the signal must become weaker. And/or switch off one of the laser beam, either Ti:sapphire laser or OPO. Again there must be a strong decay in intensity compared to the CARS signal.
- To achieve the maximum CARS signal, select the option on the software to provide a value of the mean intensity of the whole image (in the Histo view of the screen area tab). Adjust the wavelength (few nm), then the x,y,z positions of the focus beam to maximize the mean intensity value.
6. Enclosure of the Light Path of the Delay Line
- Since the final system is dedicated to non-physicists, enclose the light path of the delay line with tubes or an enclosure box, to avoid direct access to harmful non-visible high peak power laser beam. Take care to provide an access to the translation stage knob.
7. Wavelength Tuning for CARS
- Use the equation
 to tune the laser wavelengths to the desired Raman vibration. To reproduce the results presented in this work to image CARS signal from C-H bonds having stretching vibration of 3015 cm-1, select λTi:sapphire = 830 nm and λOPO = 1,095 nm.
NOTE: Raman characteristic vibrational frequencies observed in biological samples, such as water, C-H bond can be found in Evans et al.13 or in Ellis et al.29. - Use the equation
 to determine the emission wavelength of CARS signal. For C-H bond imaging by CARS, choose a narrow band filter at 670 nm since λCARS = 670 nm with laser wavelengths presented in 7.1.
NOTE: A mobile phone application is available to calculate λCARS from λP and λS values (see reference 30).
8. Observation of CARS Signal and Stained Myelin from Sciatic Nerve Cuts
Note: All animal experiments were conducted in accordance with institutional regulations.
- Prepare the axial and longitudinal sciatic nerve cuts on a microscope slide as presented in Ozçelik et al.31.
- Prepare the fluoromyelin red staining solution by diluting the stock solution 300-fold into PBS. Flood the nerve cuts with the staining solution for 20 min at RT. Remove the solution and wash 3 times for 10 min with PBS.
- Position the cuts under the 20X water immersion objective. Place a coverslip. Add few drops of PBS to immerse the objective and adjust the focus of the objective to obtain a clear image of the cuts through the oculars (as previously detailed in 4.2).
- In Track 1, select the Ti:sapphire and the OPO lasers and define their wavelengths to 830 nm and 1,095 nm, respectively. In the Light Path window, select PMT1 and green color.
- In Track 2, select the OPO laser only (wavelength at 1,095 nm). In the Light Path window, select PMT4 and red color.
- For both lasers, select low power and set the gain to 600 for a start. Switch on the laser scans and adjust the following parameters to improve CARS and fluorescence signal contrasts: power values, translation stage knob (very slightly), wavelengths (few nm), display intensity.
- To record final images at high resolution, select in the Acquisition Mode tool the following parameters: frame size of 1,024 pixels, scan speed of 7, averaging of 4. Click on the Snap button for recording a single image. Save the image in the proprietary format to record the image and the full acquisition parameters.
9. Observation of CARS and SHG Signals from Sciatic Nerve Cuts
- Prepare the sciatic nerve as presented in Ozçelik et al.31.
- Follow the procedure as explained in part 8 to get an image through the oculars and to select CARS signal parameter (Track 1).
- In Track 2, select the OPO laser only (wavelength at 1095 nm). In the Light Path window, select PMT3 and magenta color.
- Follow the procedure as explained in part 8 to switch on the laser scans and save high resolution images.
Access restricted. Please log in or start a trial to view this content.
Results
The pulse train frequency of standard Ti:sapphire laser is typically around 80 MHz. The OPO has the same frequency since it is pumped by the Ti:sapphire laser. A fast oscilloscope of at least 200 MHz is therefore required. A fast photodiode in the range 600 to 1,100 nm is also required. The maximal temporal shift occurs when the Ti:sapphire and the OPO signals are shifted of 1/(2×80×106) = 6.2 nanoseconds. It corresponds to a maximum beam path shift of 1.9 m. ...
Access restricted. Please log in or start a trial to view this content.
Discussion
The most challenging part of the work is the temporal synchronization of the laser beams. It requires a fast photodiode combined with a fast oscilloscope, but only a rough overlapping in time can be performed at first. Then a further adjustment of few cm is required. Finally, micrometer moves by a linear translation stage allows performing the final fine adjustment of the delay line length in order to trigger the CARS signal. This signal is maintained in a narrow range of around 20 micrometers, as observed by tuning the ...
Access restricted. Please log in or start a trial to view this content.
Disclosures
The authors declare that they have no competing financial interests.
Acknowledgements
The authors want to thank Dr. Philippe Combette (IES, UM, Montpellier, France) for the loan of the fast oscilloscope and acknowledge financial supports from Montpellier RIO Imaging (MRI). HR acknowledges ANR grants France Bio Imaging (ANR-10-INSB-04-01) and France Life Imaging (ANR-11-INSB-0006) infrastructure networks for coherent Raman imaging developments. This work was mainly supported by an European Research Council grant (FP7-IDEAS-ERC 311610) and an INSERM - AVENIR grant to NT.
Access restricted. Please log in or start a trial to view this content.
Materials
| Name | Company | Catalog Number | Comments |
| Oscilloscope | Tektronix | TDS 520D | 500 MHz |
| Photodetector | Thorlabs | DET08C/M, T4290 | 5 GHz InGaAs, 800 - 1,700 nm |
| Ti:Sapphire laser Chameleon Ultra Family II | Coherent | ||
| Optical parametric oscillator OPO Compact Family | APE Berlin | ||
| Axio Examiner microscope LSM 7 MP | Carl Zeiss | ||
| Motorized periscope | Newport | ||
| Objective W Plan-Apochromat 20X/1.0 | Carl Zeiss | ||
| Beam combiner | Carl Zeiss | ||
| Acousto-optic modulator | Carl Zeiss | ||
| OPO power attenuator | Carl Zeiss | ||
| Photomultiplier tube | Carl Zeiss | ||
| ZEN software | Carl Zeiss | ||
| Bandpass filters | Carl Zeiss | LSM BiG 1935-176 | 400 - 480 nm; 500 - 550 nm; 465 - 610 nm |
| Dichroic mirror | Carl Zeiss | Cutoff wavelength 760 nm | |
| Silver mirrors | Newport | 10D20ER.2 | λ/10, 480 - 20,000 nm, Quantity 4 |
| Single-axis translation stage with standard micrometer | Thorlabs | PT1/M | Quantity 1 |
| Aluminium breadboard | Thorlabs | MB1015/M | Quantity 1 |
| Mirror mount | Thorlabs | KMSS/M | Quantity 4 |
| Mirror holder for Ø1" Optics | Thorlabs | MH25 | Quantity 4 |
| Iris diaphragms | Thorlabs | ID8/M | Quantity 3 |
| Protective box | Thorlabs | TB4, XE25L900/M, T205-1.0, RM1S | Quantity 1 |
| Optical posts | Thorlabs | TR40/M, PH50/M, PH75/M, BA2/M | Quantity 8 (lengths depending on the set-up) |
| 661 - 690 nm bandpass filter | Semrock | 676/29 nm BrightLine® single-band bandpass filter | Quantity 1 |
| Fluorescent beads | ThermoFisher | TetraSpeck™ Fluorescent Microspheres Size Kit | |
| Laser viewing card | Thorlabs | IR laser viewing card | |
| Laser safety glass | Newport | LV-F22.P5L07 | |
| FluoroMyelin™ Red Fluorescent Myelin Stain | ThermoFisher | F34652 |
References
- Valeur, B., Berberan-Santos, M. N. Molecular Fluorescence: Principles and Applications. , 2nd Edition, Wiley-VCH Verlag GmbH. (2012).
- Denk, W., Strickler, J. H., Webb, W. W. Two-photon laser scanning fluorescence microscopy. Science. 248 (4951), 73-76 (1990).
- Moreaux, L., Sandre, O., Mertz, J. Membrane imaging by second-harmonic generation microscopy. JOSA B. 17 (10), 1685-1694 (2000).
- Zoumi, A., Yeh, A., Tromberg, B. J. Imaging cells and extracellular matrix in vivo by using second-harmonic generation and two-photon excited fluorescence. Proc. Natl. Acad. Sci. USA. 99 (17), 11014-11019 (2002).
- Yelin, D., Silberberg, Y. Laser scanning third-harmonic-generation microscopy in biology. Opt. Express. 5 (8), 169-175 (1999).
- Campagnola, P. J., Millard, A. C., Terasaki, M., Hoppe, P. E., Malone, C. J., Mohler, W. A. Three-dimensional high-resolution Second-Harmonic Generation imaging of endogenous structural proteins in biological tissues. Biophys. J. 81 (1), 493-508 (2002).
- Olivier, N., et al. Cell lineage reconstruction of early zebrafish embryos using label-free nonlinear microscopy. Science. 329 (5994), 967-971 (2010).
- Farrar, M. J., Wise, F. W., Fetcho, J. R., Schaffer, C. B. In vivo imaging of myelin in the vertebrate central nervous system using third harmonic generation microscopy. Biophys. J. 100 (5), 1362-1371 (2011).
- Lim, H., Sharoukhov, D., Kassim, L., Zhang, Y., Salzer, J. L., Melendez-Vasquez, C. V. Label-free imaging of Schwann cell myelination by third harmonic generation microscopy. Proc. Natl. Acad. Sci. U.S.A. 111 (50), 18025-18030 (2014).
- Strupler, M., Pena, A. M., Hernest, M., Tharaux, P. L., Martin, J. L., Beaurepaire, E., Schanne-Klein, M. C. Second harmonic imaging and scoring of collagen in fibrotic tissues. Opt. Express. 15 (7), 4054-4065 (2007).
- Cheng, J. X., Xie, X. S. Coherent anti-Stokes Raman scattering microscopy: Instrumentation, theory, and applications. J. Phys. Chem. B. 108 (3), 827-840 (2004).
- Volkmer, A. Vibrational imaging and microspectroscopies based on coherent anti-Stokes scattering microscopy. J. Phys. D: Appl. Phys. 38, R59-R81 (2005).
- Evans, C. L., Xie, X. S. Coherent anti-Stokes Raman scattering microscopy: chemical imaging for biology and medicine. Annu. Rev. Anal. Chem. 1, 883-909 (2008).
- Mukamel, S. Principles of nonlinear optical spectroscopy. , Oxford University Press. New York. (1995).
- Duncan, M. D., Reintjes, J., Manuccia, T. J. Scanning coherent anti-Stokes Raman microscope. Opt. Lett. 7 (8), 350-352 (1982).
- Zumbusch, A., Holtom, G. R., Xie, X. S. Three-dimensional vibrational imaging by coherent anti-Stokes Raman scattering. Phys. Rev. Lett. 82 (20), 4142-4145 (1999).
- Folick, A., Min, W., Wang, M. C. Label-free imaging of lipid dynamics using Coherent Anti-Stokes Raman Scattering (CARS) and Stimulated Raman Scattering (SRS) microscopy. Curr. Opin. Genet. Dev. 21 (5), 585-590 (2011).
- Wang, P., Liu, B., Zhang, D., Belew, M. Y., Tissenbaum, H. A., Cheng, J. X. Imaging lipid metabolism in live Caenorhabditis elegans using fingerprint vibrations. Angew. Chem. Int. Ed. Engl. 53 (44), 11787-11792 (2014).
- Min, W., Freudiger, C. W., Lu, S., Xie, X. S. Coherent nonlinear optical imaging: beyond fluorescence microscopy. Annu. Rev. Phys. Chem. 62, 507-530 (2011).
- Cheng, J. X., Jia, Y. K., Zheng, G., Xie, X. S. Laser-scanning coherent anti-Stokes Raman scattering microscopy and applications to cell biology. Biophys J. 83 (1), 502-509 (2002).
- Chiu, W. S., Belsey, N. A. N., Garrett, L., Moger, J., Delgado-Charro, M. B., Guy, R. H. Molecular diffusion in the human nail measured by stimulated Raman scattering microscopy. Proc Natl. Acad. Sci. U.S.A. 112, 7725-7730 (2015).
- Chen, X., Grégoire, S., Formanek, F., Galey, J. -B., Rigneault, H. Quantitative 3D molecular cutaneous absorption in human skin using label free nonlinear microscopy. J. of Control. Release. 200, 78-86 (2015).
- Kano, H., Hamaguchi, H. In vivo multi-nonlinear optical imaging of a living cell using a supercontinuum light source generated from a photonic crystal fiber. Opt. Express. 14 (7), 2798-2804 (2006).
- Brustlein, S., Ferrand, P., Walther, N., Brasselet, S., Billaudeau, C., Marguet, D., Rigneault, H. Optical parametric oscillator-based light source for coherent Raman scattering microscopy: practical overview. J. Biomed. Opt. 16 (2), 021106(2011).
- Chen, H., et al. A multimodal platform for nonlinear optical microscopy and microspectroscopy. Opt. Express. 17 (3), 1282-1290 (2009).
- Yue, S., Slipchenko, M. N., Cheng, J. X. Multimodal nonlinear optical microscopy. Laser Photonics Rev. 5 (4), 496-512 (2011).
- Sun, Q., Li, Y., He, S., Situ, C., Wu, Z., Qu, J. Y. Label-free multimodal nonlinear optical microscopy reveals fundamental insights of skeletal muscle development. Biomed Opt Express. 5 (1), 158-166 (2013).
- Le, T. T., Langohr, I. M., Locker, M. J., Sturek, M., Cheng, J. X. Label-free molecular imaging of atherosclerotic lesions using multimodal nonlinear optical microscopy. J. Biomed. Opt. 12 (5), 054007(2007).
- Ellis, D. I., Cowcher, D. P., Ashton, L., O'Hagana, S., Goodacre, R. Illuminating disease and enlightening biomedicine: Raman spectroscopy as a diagnostic tool. Analyst. 138, 3871-3884 (2013).
- A•P•E Angewandte Physik & Elektronik GmbH. , Germany. Available from: http://www.ape-berlin.de/en/page/calculator (2015).
- Ozçelik, M., et al. Pals1 is a major regulator of the epithelial-like polarization and the extension of the myelin sheath in peripheral nerves. J Neurosci. 30 (11), 4120-4131 (2010).
- Heinrich, C., Hofer, A., Ritsch, A., Ciardi, C., Bernet, S., Ritsch-Marte, M. Selective imaging of saturated and unsaturated lipids by wide-field CARS-microscopy. Opt. Express. 16 (4), 2699-2708 (2008).
- Kyriakidis, N. B., Skarkalis, P. Fluorescence spectra measurement of olive oil and other vegetable oils. J. AOAC Int. 83 (6), 1435-1439 (2000).
- King, R. Microscopic anatomy: normal structure. Handb. Clin. Neurol. 115, 7-27 (2013).
- Monsma, P. C., Brown, A. FluoroMyelin Red is a bright, photostable and non-toxic fluorescent stain for live imaging of myelin. J. Neurosci. Methods. 209 (2), 344-350 (2012).
- Wang, H., Fu, Y., Zickmund, P., Shi, R., Cheng, J. X. Coherent anti-stokes Raman scattering imaging of axonal myelin in live spinal tissues. Biophys. J. 89 (1), 581-591 (2005).
- Wang, H. W., Fu, Y., Huff, T. B., Le, T. T., Wang, H., Cheng, J. X. Chasing lipids in health and diseases by coherent anti-Stokes Raman scattering microscopy. Vib. Spectrosc. 50 (1), 160-167 (2009).
- Jung, Y., Tam, J., Jalian, H. R., Anderson, R. R., Evans, C. L. Longitudinal, 3D in vivo imaging of sebaceous glands by coherent anti-stokes Raman scattering microscopy: normal function and response to cryotherapy. J. Invest. Dermatol. 135 (1), 39-44 (2015).
Access restricted. Please log in or start a trial to view this content.
Reprints and Permissions
Request permission to reuse the text or figures of this JoVE article
Request PermissionExplore More Articles
This article has been published
Video Coming Soon
Copyright © 2025 MyJoVE Corporation. All rights reserved