
A subscription to JoVE is required to view this content. Sign in or start your free trial.
Method Article
Optical Quantification of Intracellular pH in Drosophila melanogaster Malpighian Tubule Epithelia with a Fluorescent Genetically-encoded pH Indicator
In This Article
Summary
Cellular ion transport can often be assessed by monitoring intracellular pH (pHi). Genetically Encoded pH-Indicators (GEpHIs) provide optical quantification of intracellular pH in intact cells. This protocol details the quantification of intracellular pH through cellular ex vivo live-imaging of Malpighian tubules of Drosophila melanogaster with pHerry, a pseudo-ratiometric genetically encoded pH-indicator.
Abstract
Epithelial ion transport is vital to systemic ion homeostasis as well as maintenance of essential cellular electrochemical gradients. Intracellular pH (pHi) is influenced by many ion transporters and thus monitoring pHi is a useful tool for assessing transporter activity. Modern Genetically Encoded pH-Indicators (GEpHIs) provide optical quantification of pHi in intact cells on a cellular and subcellular scale. This protocol describes real-time quantification of cellular pHi regulation in Malpighian Tubules (MTs) of Drosophila melanogaster through ex vivo live-imaging of pHerry, a pseudo-ratiometric GEpHI with a pKa well-suited to track pH changes in the cytosol. Extracted adult fly MTs are composed of morphologically and functionally distinct sections of single-cell layer epithelia, and can serve as an accessible and genetically tractable model for investigation of epithelial transport. GEpHIs offer several advantages over conventional pH-sensitive fluorescent dyes and ion-selective electrodes. GEpHIs can label distinct cell populations provided appropriate promoter elements are available. This labeling is particularly useful in ex vivo, in vivo, and in situ preparations, which are inherently heterogeneous. GEpHIs also permit quantification of pHi in intact tissues over time without need for repeated dye treatment or tissue externalization. The primary drawback of current GEpHIs is the tendency to aggregate in cytosolic inclusions in response to tissue damage and construct over-expression. These shortcomings, their solutions, and the inherent advantages of GEpHIs are demonstrated in this protocol through assessment of basolateral proton (H+) transport in functionally distinct principal and stellate cells of extracted fly MTs. The techniques and analysis described are readily adaptable to a wide variety of vertebrate and invertebrate preparations, and the sophistication of the assay can be scaled from teaching labs to intricate determination of ion flux via specific transporters.
Introduction
The goal of this protocol is to describe quantification of intracellular pH (pHi) using a Genetically-Encoded pH-Indicator (GEpHI) and demonstrate how this method can be used to assess basolateral H+ transport in a model insect (D. melanogaster) renal structure, the Malpighian tubule (MT). MTs serve as the excretory organs of the fruit fly and are functionally similar to the mammalian nephron in several key respects1. MTs are arranged as 2 pairs of tubules (anterior and posterior) in the thorax and abdomen of the fly. The single-cell epithelial tube of each MT is composed of metabolically active principal cells with distinct apical (luminal) and basolateral (hemocoel) polarity as well as intercalated stellate cells. Anterior MTs are composed of 3 morphologically, functionally, and developmentally distinct segments, notably the initial dilated segment, transitional segment, and secretory main segment, which joins to the ureter2. At the cellular scale trans-epithelial ion transport into the lumen is accomplished by an apical plasma membrane V-ATPase3 and an alkali-metal/H+ exchanger as well as a basolateral Na+-K+-ATPase4, inward-rectifier K+ channels5, Na+-driven Cl−/HCO3− exchanger (NDAE1)6, and Na+-K+-2Cl− cotransporter (NKCC; Ncc69)7, while stellate cells mediate Cl- and water transport8,9. This complex but accessible physiologic system provides excellent opportunities for investigation of endogenous ion transport mechanisms when combined with the diverse genetic and behavioral toolsets of Drosophila.
The rationale for this protocol was to describe a genetically malleable system for studying epithelial ion transport with potential for integration from cell to behavior and export of tools to other model systems. Expression of pHerry10, a GEpHI derived from a fusion of green pH-sensitive super-ecliptic pHluorin11,12 (SEpH) and red pH-insensitive mCherry13, in MTs permits quantification of H+ transport in single MT cells through the high K+/nigericin calibration technique14. As many ion transporters move H+ equivalents, quantification of intracellular pHi serves as a functional representation of ion movement via a variety of transporters. The Drosophila MT model system also offers powerful genetic tools in tissue-specific transgene15 and RNA interference (RNAi)16 expression, which can be combined with cellular imaging and whole-organ assays17,18,19 of tubule function to create a robust toolset with vertical integration from molecules to behavior. This stands in contrast to many other protocols for assessing epithelial biology, as historically such measurements have relied on intricate and daunting micro-dissection, sophisticated ion-selective electrodes20,21, and expensive pH-sensitive dyes22 with restrictive loading requirements and poor cellular specificity in heterogeneous tissues. GEpHIs have been used to extensively measure pHi in a variety of cell types23. Early work exploited the inherent pH-sensitivity of Green Fluorescent Protein (GFP) to monitor pHi in cultured epithelial cells24 but the past two decades have seen GEpHIs used in neurons25, glia26, fungi27, and plant cells28. The combination of the potential for cellular targeting of genetic constructs through the GAL4/UAS expression system15 and the physiologic accessibility of the Drosophila MT make this an ideal preparation for investigations of pHi regulation and epithelial ion transport.
pHi regulation has been studied for decades and is vital to life. The MT preparation offers a robust model to teach physiology of pHi regulation but also perform sophisticated investigations of pHi regulation ex vivo and in vivo. This protocol describes quantification of H+ movement across the basolateral membrane of the epithelial cells of the Drosophila MT using the NH4Cl pulse acid loading technique21, but as the pH-indicator is genetically encoded, these methods and their theoretical framework can be applied to any preparation amenable to transgenesis and live-imaging.
Protocol
All steps in this protocol comply with the Mayo Clinic (Rochester, MN) animal use guidelines.
1. Fly Husbandry
- Raise flies and set crosses according to standard husbandry29.
NOTE: Fluorescent reporter expression by the GAL4/UAS system is proportional to temperature and thus rearing temperature can be adjusted to alter expression level. While high expression levels often lead to a better signal-to-noise ratio this condition is also associated with increased cytosolic and organellar aggregates when using GFP to Red Fluorescent Protein (RFP) fusion constructs such as pHerry10,30,31. If aggregation is unavoidable, quantification is still possible by performing point calibrations in each experiment and normalizing data such that a fluorescence ratio of 1.0 corresponds to pHi 7.0 (see step 7.4 Note on calibration below). - Set crosses of homozygous capaR-GAL432 males to homozygous UAS-pHerry10 virgin females and homozygous c724-GAL42 males to homozygous UAS-pHerry virgin females to permit imaging of pHi in principal cells and stellate cells of the MT, respectively. Place 6 UAS-pHerry females with 3 GAL4 males into fresh vials of food and leave to mate at 28 °C.
NOTE: Larvae should be evident within 4 d and adults will begin to eclose around day 10. - Collect female flies upon eclosion and set aside to age for 10 d at 28 °C.
NOTE: The timing of experimentation can be adjusted to correspond to any restrictive behavioral assays (such as the Ramsay secretion assay17,19) that will be correlated to intracellular live pH imaging. Male flies can be used but tubules from females are often larger and more robust.
2. Preparation of Poly-L-Lysine Slides.
- Draw a 40 x 20 mm border with a hydrophobic PAP pen around the top of standard 75 x 25 mm slides and set aside to dry for 15 min at RT. Use large coverslips if the slides are not compatible with imaging optics.
- Transfer 2 mL of stock 0.01% Poly-L-Lysine (PLL) solution onto each slide and set aside for 1 h at RT.
- Remove excess PLL with a pipette. Save the solution in a 50 mL conical vial for future use. Store at 4 °C.
- Aspirate any remaining solution with a vacuum line. Run the vacuum line over the entire slide surface to ensure that no solution remains on the slides.
- Set the slides aside for 1 additional h at RT prior to use. Store the slides dry at RT for up to 1 month in a standard slide book.
3. Preparation of Dissecting Dish and Glass Rods
- Add 0.5 mL of elastomer curing agent to 4.5 mL of elastomer base in a 35 x 10 mm polystyrene Petri dish at RT to produce a depth of 5 mm. Mix with a disposable pipette tip. Allow elastomer to cure O/N at RT.
NOTE: Elastomer should be clear and free of bubbles. Clearing of bubbles may be facilitated by keeping elastomer plates in a vacuum jar for 10 - 15 min after pouring. - Hold a 5 mm diameter glass rod between hands and melt the center of the rod over a lit Bunsen burner while pulling the ends apart. As the glass melts pull more quickly to produce a thin (0.1 mm) and tapered shaft (Figure 1).
NOTE: A 45 ° angle at the shank is often helpful in handling tubules. This can be achieved by lowering one hand as the shank is pulled (see Figure 1). - Break the thin shaft in the middle with the blunt side of a single-edged carbon steel razor blade. Inspect the thin end of the rod under a dissecting scope to ensure the break is clean.

Figure 1: Fabricating Glass Rods for Handling Malpighian Tubules.
A - E. Process of heating and pulling a glass rod to produce a taper and angle suitable for handling MTs. Arrows denote direction and magnitude of force to be applied. F. Photograph of an appropriately fabricated glass tool. Scale bar = 10 mm. Please click here to view a larger version of this figure.
4. Preparation of Solutions and Perfusion System
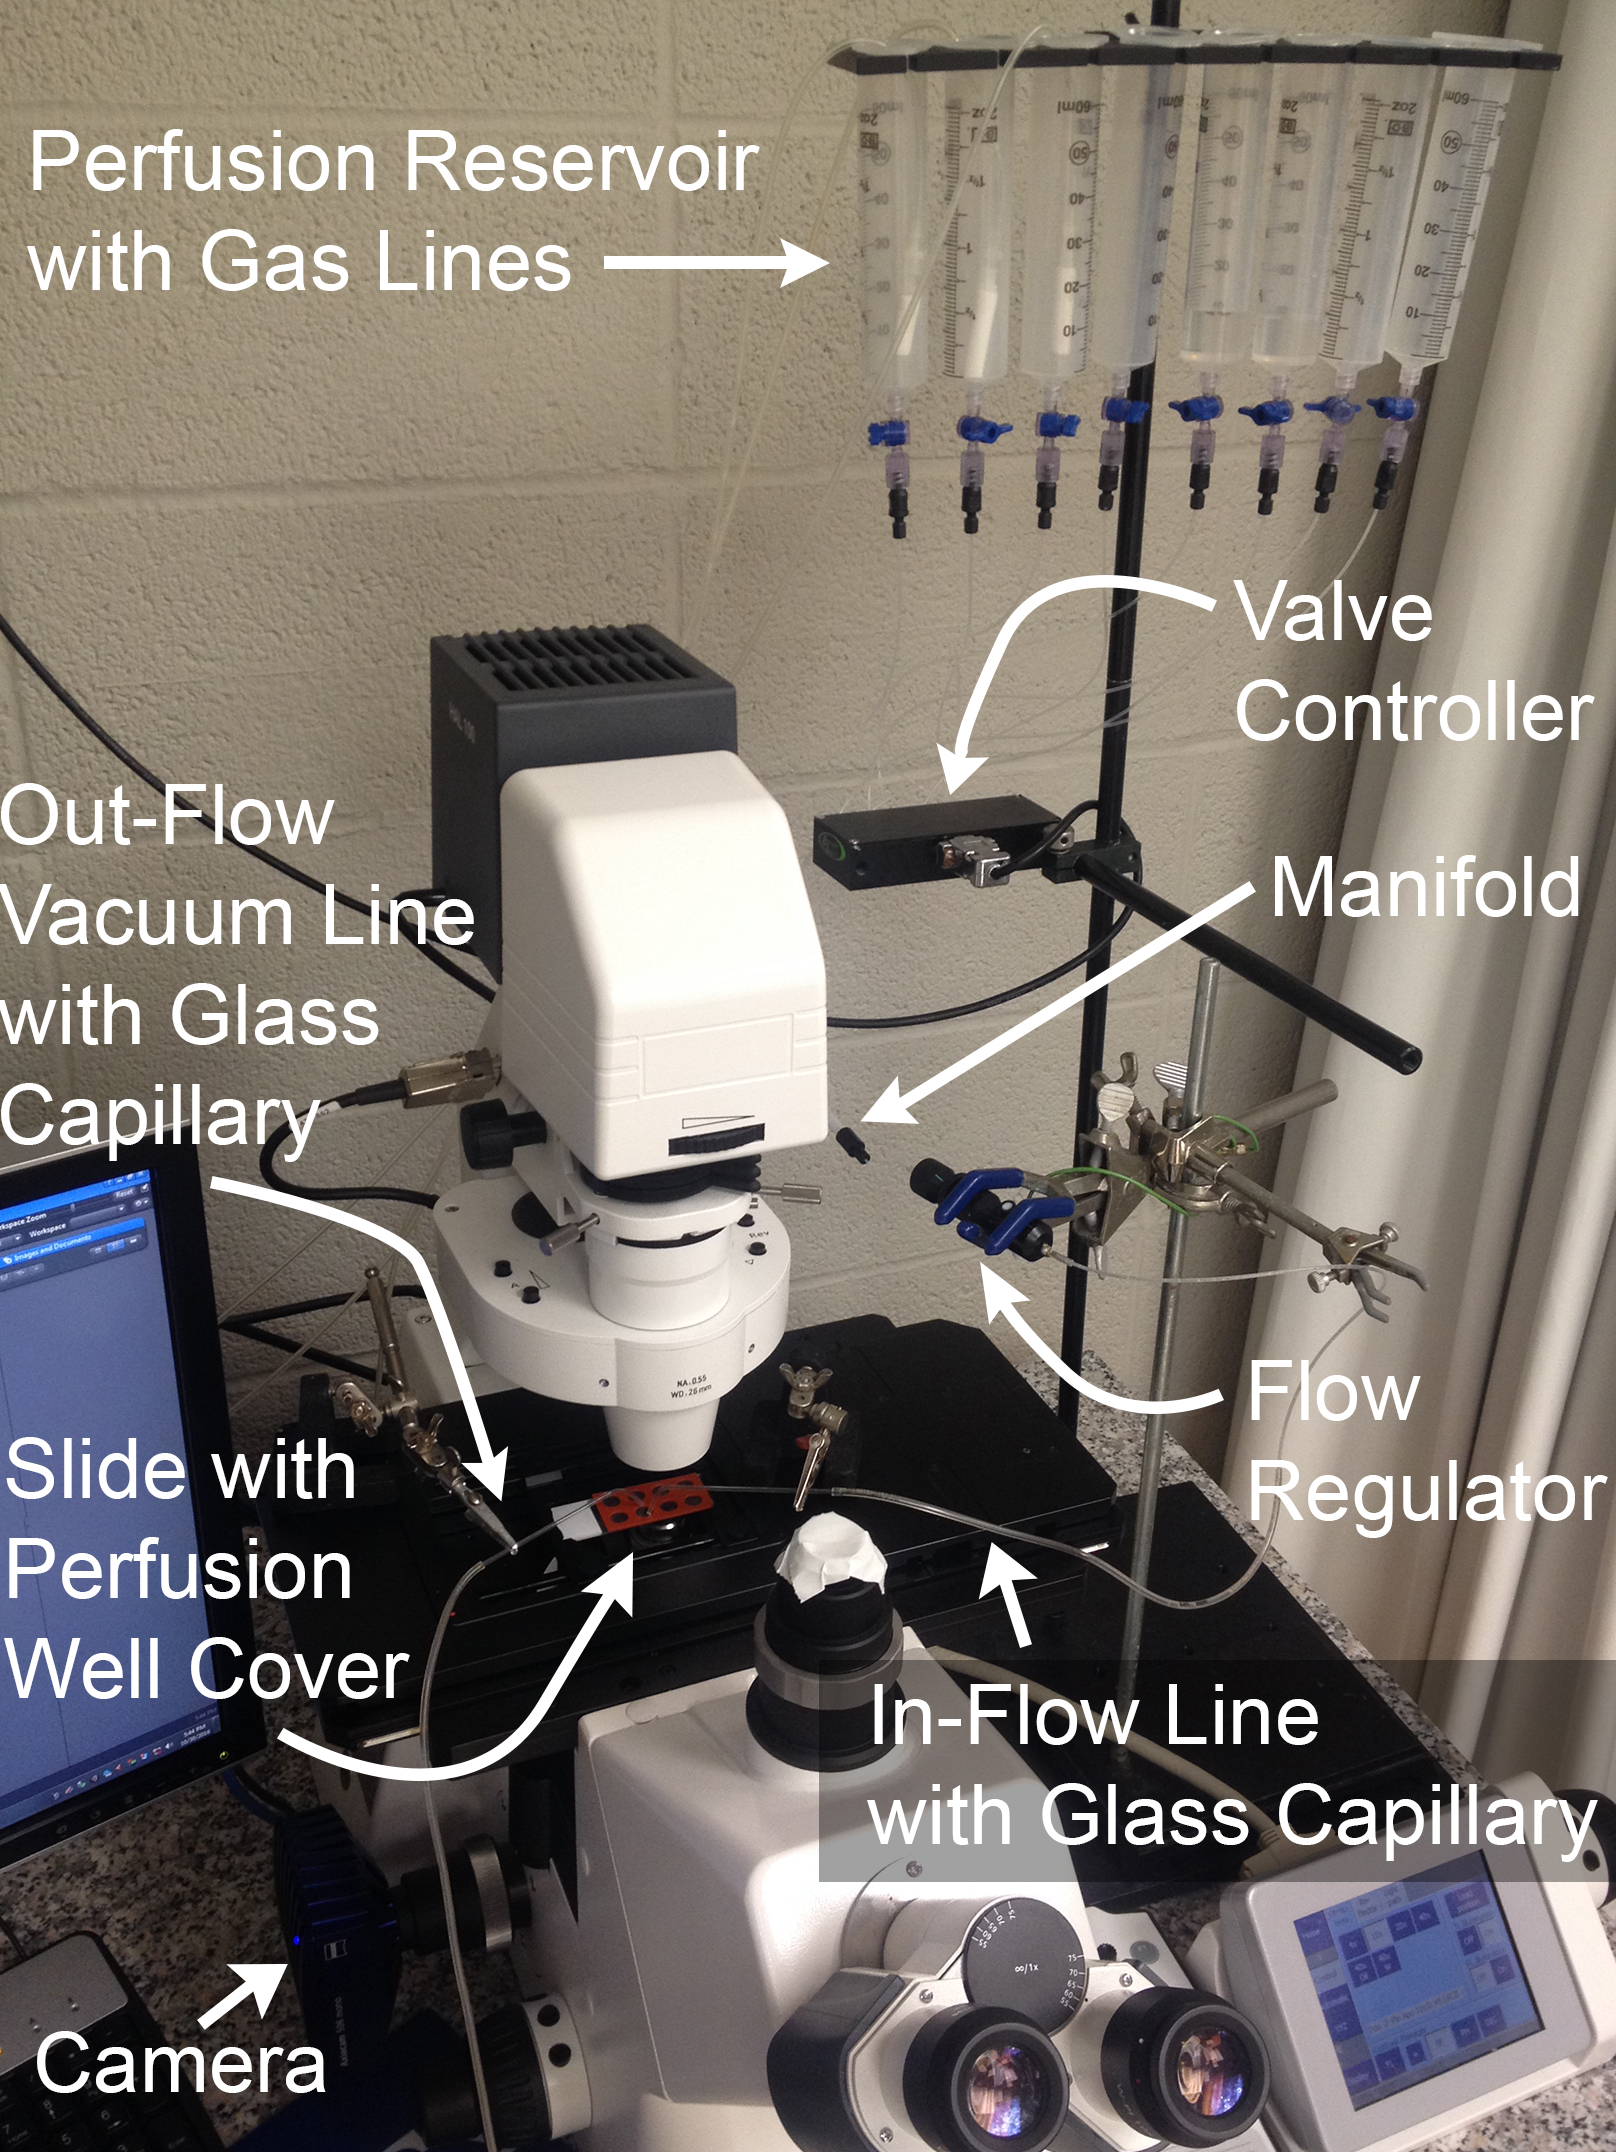
NOTE: Perfusion systems differ by manufacturer. This protocol is based around a gravity-fed 8-channel open reservoir with an input flow rate regulator and a vacuum-driven outflow, but the method of mounting MTs as described here can be adapted to work with any perfusion system.
- Prepare the following solutions:
- Aliquot Schneider's medium (40 mL into 50 mL conical vials) and store at 4 °C.
- Prepare solutions (i.e. insect Phosphate-Buffered Saline (iPBS) and iPBS with NH4Cl) at RT as needed according to Table 1). Warm solutions to RT before use on day of experiment.
NOTE: iPBS and iPBS with 40 mM NH4Cl can be prepared in large volumes (1 L or more) and stored at 4 °C. - Prepare 8 calibration solutions in 500 mL volumes at pH = 5.0, 6.0, 6.5, 7.0, 7.3, 7.6, 8.0, and 9.0 as indicated in Table 1 and store at 4 °C. Adjust pH of each solution by titration with N-methyl-D-glucamine (NMDG) and HCl.
- On the day of experiments, warm 5 mL aliquots of calibration solutions to RT and add stock nigericin solution (20 mM in dimethyl sulfoxide (DMSO)) to produce a final concentration of 10 µM.
CAUTION: Handle nigericin with gloves. Treat all equipment that comes in contact with nigericin as disposable. Nigericin remains on glass and plastic and will compromise biological preparations if equipment is reused.
- Perfusion system:
- Prime the perfusion system by filling all reservoirs with ddH2O (Figure 2). Open the channels one at a time to allow all lines proximal to the flow rate regulator to fill.
NOTE: It may be necessary to clear air in the lines by opening the stalled channel and using a plunger to drive flow from the reservoir. - Open 2 channels and allow ddH2O to drain. Once the reservoirs are nearly empty, fill the first reservoir with iPBS and the second reservoir with NH4Cl-pulsed iPBS. Set flow rate to maximum with the flow rate regulator and allow each solution to flow for 1 min to fill the distal lines, then stop the flow (Figure 2).
- Position 2 sets of soldering "helping hands" clamps on the imaging microscope stage. Place one clamp on each side of the imaging platform.
- Carefully heat the distal 0.5 inches of a piece of capillary glass (inner diameter 1.5 mm, outer diameter 0.86 mm, length 100 mm) over a Bunsen burner. Create a 45 ° bend by allowing the distal end to bend by gravity and removing the glass from the flame once the desired angle is achieved. Repeat this process with a second piece of capillary glass.
- Insert the bent glass capillaries in the in-flow line and vacuum-connected outflow line, respectively and mount them in the "helping hands" to align them with the imaging stage of the microscope (Figure 3).
- Prime the perfusion system by filling all reservoirs with ddH2O (Figure 2). Open the channels one at a time to allow all lines proximal to the flow rate regulator to fill.

Figure 2: Perfusion System and Imaging Configuration.
Components necessary for the physiological assessment of MT basolateral transport function through simultaneous live fluorescence imaging and rapid solution exchange.Gas lines shown are optional and permit expansion of experiments to the assessment of HCO3- transport. Please click here to view a larger version of this figure.

Figure 3: Flow Schematic of Perfusion Apparatus for NH4Cl Pulse Experiments.
Arrows depict flow path and valve switching points. Solution moves from reservoir to specimen by gravity flow and is drawn from the specimen chamber to the waste flask by vacuum suction. Please click here to view a larger version of this figure.
5. Dissection of Adult Drosophila Anterior Malpighian Tubules.
- Gather the dissection dish and pulled glass rod from section 3, a PLL-coated slide from section 2, an adhesive perfusion-well divider, vacuum grease, a 4 x 2" strip of sealing film, 2 pairs of #5 fine forceps, and 40 mL aliquots of ice-cold Schneider's medium and RT iPBS.
- Spread vacuum grease on the sealing tape and press the adhesive perfusion-well divider onto the tape to coat the bottom with grease. Peel off the adhesive perfusion-well divider and place it grease-side-down on top of a PLL coated slide. Remove the perfusion-well divider to leave individual specimen wells traced in hydrophobic grease.
- Place 200 µL of RT iPBS in the grease-encircled well on the PLL coated slide and move the slide under the stereoscope.
- Place UAS-pHerry/capaR-GAL4 flies in an empty fly vial and anesthetize them on ice for 10 min.
NOTE: This method of anesthesia, unlike CO2, ensures that the flies do not dehydrate. - Pour ice-cold Schneider's medium into the dissecting dish and use fine forceps to transfer a single anesthetized female fly into the dish under a dissecting stereoscope.
- Hold the fly by the thorax with a set of forceps and use the other to gently grip the posterior of the abdomen. Pull open the posterior of the fly using the forceps in short, deliberate motions. Once the hindgut is visible, grip the distal end and free the gut and MTs from the underlying tracheoles by pulling the hindgut away from the body through repetitive, brief tugs.
NOTE: The anterior and posterior MTs will be visible where they meet the junction of the midgut and hindgut through the ureter. The first pair of MTs to be free will likely be the posterior tubules as they encircle the hindgut. These can be ignored (Figure 4A). - Pinch off the anterior MTs at the ureter with fine forceps once the second set of MTs is free of the abdomen. This will separate the anterior MTs from the gut and close the ureter.
- Pick up the free anterior MTs with the pulled glass rod by sliding the rod under the ureter such that the tubules fall to either side. Lift the MTs straight up out of the solution.
- Turn the glass rod such that the MTs and ureter are adhered to the underside of the rod and lower the ureter straight down onto the slide. Affix the ureter and seal the distal ends of the MTs by pressing the ureter down onto the glass slide (Figure 4B). Do not manipulate the MTs any more than necessary. The MTs should be floating up in the solution with the ureter anchored to the slide.
- Use the fine end of the glass rod to gently sweep each tubule across the slide surface. Brace the rod against the slide to avoid crushing the tubule and slide the rod over the top of the tubule, moving distal to proximal, to attach the full length of each tubule to the surface of the PLL-coated slide (Figure 4C).
- Place the adhesive perfusion-well divider back on the slide to form a small fluid-filled well over the mounted tubule.
- Place the specimen on the microscope stage. Position the inflow and outflow capillaries over the inlet and outlet opening of the perfusion well, respectively.
NOTE: The well divider can be left off if an open perfusion chamber is desired. In this case the inflow and outflow capillaries can be aligned to opposite sides of an imaging well.
6. Validation of Imaging Protocol and Tubule Health
Note: This protocol is performed on an inverted wide-field epifluorescent microscope with GFP (SEpH) and RFP (mCherry) filter sets (470/40 nm excitation (ex), 515 nm longpass emission (em), 500 nm dichroic and 546/10 nm ex, 590 nm longpass em, 565 nm dichroic), a 10X/0.45 air objective, a monochromatic camera for live-image capture, and imaging software. The protocol can be adapted for any upright or inverted microscope with automated filter switching between GFP and RFP optics and image acquisition software, although optimal exposure times, light intensity, and binning parameters will vary. In all analysis, the fluorescence intensity should be analyzed as mean pixel intensity in the region of interest (ROI), after background subtraction in each channel using an ROI with contains no fluorescence adjacent to the signal ROI.
- Turn on the microscope, light source, and imaging system.
- Open associated imaging software.
- Look through the eyepiece and manually adjust focus until the lumen of the MT is clearly visible under transmitted light.
- Click the "Acquisition" tab in image analysis software and select "2x2" in the "Binning" pull-down menu in the "Acquisition Mode" section.
- Insert a 5% neutral density filter into the light path to reduce illumination light and minimize photobleaching.
- Click the GFP (SEpH) channel in the "Channels" menu, then click "Live" to observe the fluorescent signal via the camera.
- Adjust the "Time" slider to set the exposure time such that the brightest pixel values in the intensity histogram are approximately 40% of the maximum value, then click "Stop" to stop the illumination.
- Repeat steps 6.6 - 6.7 in the RFP (mCherry) channel and confirm the presence of the dilated initial segment of the anterior MT and the absence of cytosolic mCherry aggregates (indicative of tissue damage or overexpression) (Figure 4D).
NOTE: The dilated segment should be clearly apparent as it is the most proximal segment of the tubule and the diameter of the inner lumen of this segment is ~20 µm greater than that of the adjacent transitional segment. 2 x 2 pixel binning is often sufficient but can be increased to further reduce the required illumination intensity. Typical exposure times are between 150 & 800 ms/channel. Use as little light as possible to minimize photobleaching. Minimizing photobleaching is vital to the use of dual-fluorophore indicators such as pHerry as the two fluorophores can bleach independently, thus invalidating any ratio calibration. - Enable a time-lapse imaging protocol by clicking the "Time Series" check box.
- Adjust the "Duration" in the pull-down menu in the "Time Series" section to 10 min and the "Interval" slider to 0 to set the total capture time with a maximum image acquisition rate. A total acquisition rate of 0.2 Hz is often sufficient.
- Check both the GFP (SEpH) and RFP (mCherry) boxes in the "Channels" section.
- Open the iPBS line of the perfusion system by activating the appropriate valve controller and start the imaging protocol by clicking "Start Experiment." After 1 min, switch to NH4Cl pulse solution for 20 s by opening the appropriate valve and closing the iPBS line, then return to iPBS by closing the NH4Cl line and reopening the iPBS valve. Allow the full imaging protocol to complete before stopping the perfusion system.
NOTE: Time-lapse analysis should reveal a stable mCherry signal and a SEpH signal which increases in the presence of NH4Cl, quenches upon washout, and gradually recovers. - Perform a 2-point calibration.
- Remove the well divider by peeling it away from the underlying slide and remove the perfusion capillaries and clamps from the imaging well.
- Apply 200 µL Calibration iPBS (pH 7.4, 10 µM nigericin) to the imaging well with a 200 µL pipette. Remove the solution from the imaging well with the pipette, then replace with another 200 µL of calibration solution. Repeat this process 4 times to ensure complete solution exchange.
- Incubate the preparation in calibration solution for 30 min before imaging. Repeat the imaging protocol using the same parameters determined in steps 6.6 - 6.11, with the modification of only 1 min of image capture.
NOTE: The perfusion system and capillaries are not needed in this step and should not be attached to the imaging well to avoid exposing the capillaries to nigericin. - Add 200 µL Calibration iPBS (pH 9.0, 10 µM nigericin) to the imaging well with a 200 µL pipette. Remove the solution from the imaging well with the pipette, then replace with another 200 µL of calibration solution. Repeat this process 4 times to ensure complete solution exchange.
- Incubate the preparation in the second calibration solution for 10 min before imaging. Repeat the imaging protocol as in step 6.13.3.
- Review the captured image stack in image analysis software to confirm that no pixels in either channel are saturated by clicking "Mean ROI" and scrolling though the image stack with the "Frame" slider while observing that no values reported in the intensity histogram reach the maximum detectable value. If any frames contain pixels that reach the maximum detectable intensity, reduce the exposure time or illumination intensity and repeat section 6.
Note: Once established do not change imaging parameters between experiments or calibration unless point calibrations are to be used in each preparation (see step 8.3).
- Analyze the image stack to plot fluorescent intensity and fluorescence ratio (SEpH/mCherry) as a function of time.
- Click "Mean ROI" and select the freeform tool. Hold left-click to trace a ~50 µm length of MT. Right click to finish drawing the ROI, then repeat in an area adjacent to the MT to define a background ROI (Figure 5A).
- Click "Mean Intensity" under "Measurements." Create a table of intensity values by clicking "Export > Data Table > Create."
- Click the configuration cogwheel icon and de-select all parameters except "Time" and "Mean Intensity." Right-click the tab for the newly created data table, select "Save As", and export the data as a .csv file.
NOTE: Similar measurements can also be made using free software such as ImageJ. - Open a spreadsheet table and import the data table by selecting the "Data" tab followed by "From Text".
- Use functions in the spreadsheet to subtract the SEpH Background Intensity from the SEpH Signal Intensity at each time point. Repeat this process for the mCherry signal.
- Plot each channel intensity as a function of time by selecting the columns containing the Time and background-corrected Intensity data and then clicking "Insert > Scatter (Charts) > Scatter with Straight Lines" (Figure 5B).
- Use spreadsheet functions to calculate the SEpH/mCherry fluorescence ratio at each time point.
- Plot fluorescence ratio as a function of time by selecting the columns containing the Time and ratio data and then clicking "Insert > Scatter (Charts) > Scatter with Straight Lines" (Figure 5C).
7. Full Calibration of pHerry in Malpighian Tubules Ex Vivo.
- Dissect and mount a fresh set of anterior MTs as described in section 5.
- Exchange iPBS for Calibration iPBS (pH 7.4, 10 µM nigericin) as described in step 6.13.2. Incubate for 30 min.
- Locate the MTs and collect pairs of SEpH/mCherry images as described in steps 6.1 - 6.11. Replace the solution with another stock of Calibration iPBS as described in step 6.13.4, wait 10 min, and image again. Repeat this process until the SEpH/mCherry ratio has been imaged in all solutions. Obtain pH 9.0 images last as the specimen rarely recovers from high pH.
- Plot fluorescence ratio of SEpH to mCherry from calibrations in eight specimens as a function of imposed pHi as described in step 6.14.9. Fit the calibration data with a Boltzmann curve to obtain full calibration function according to Equation 1 (Figure 5D). If data are inconsistent, plot calibration sets from each specimen normalized such that a fluorescence ratio of 1.0 corresponds to pHi 7.0 and re-analyze (Figure 5E).
NOTE: If the latter process is necessary individual experiments will need their own internal point calibrations33 (see quantification procedure below (step 8.3)). - Equation 1

Where R = SEpH/mCherry ratio and A1, A2, xo, and dx are curve fitting parameters representing minimum fluorescence ratio, maximum fluorescence ratio, pKa, and width of the function respectively. xo = apparent pKa of pHerry, which can vary between 7.1 and 7.4 depending on the cell type and exact calibration conditions.
8. Quantification of Basolateral Acid Extrusion from Ex Vivo Malpighian Tubule Epithelia.
- Image pHerry-expressing stellate cells and pHerry-expressing principal cells simultaneously.
- Dissect anterior MTs from a UAS-pHerry/capaR-GAL4 fly as described in section 5, but do not transfer MTs from the dissecting Schneider's medium to the imaging well.
- Dissect anterior MTs from a UAS-pHerry/c724-GAL4 fly in the same dissecting dish using the procedure outlined in section 5.
- Transfer the 2 sets of MTs into the same imaging well as described in steps 5.8 - 5.11.
NOTE: When sweeping the arms of the MTs down to the slide, place the MTs of the UAS-pHerry/c724-GAL4 and the UAS-pHerry/capaR-GAL4 tubules near each other so pHerry-expressing principal and stellate cells can be visualized in the same field (Figure 6A).
- Apply the NH4Cl prepulse as described in step 6.12.
NOTE: If consistent calibration (Figure 4B) could not be achieved, perform a point calibration by setting pHi to 7.0 at the end of each experiment with Calibration iPBS (pH 7.0, 10 µM nigericin, 30 min incubation) after the adhesive perfusion-well divider and the perfusion equipment have been removed. - Calibrate traces from stellate and principal cells of different MT segments (using the absolute or normalized ratio as appropriate) with Equation 2 and analyze the recovery phase after NH4Cl withdrawal by applying exponential decay functions using statistical analysis software and noting the decay constant (τ) (Figure 6B).
Equation 2

Where R = SEpH/mCherry ratio and A1, A2, xo, and dx are curve fitting parameters determined by calibration in step 7.4 (Equation 1).- Calculate acid extrusion rate (JH+, see Equation 3) as a function of pHi to account for variations in resting pHi and acid loading between preparations34. Use the exponential functions derived in step 8.3 to calculate the derivative of pHi with regard to time in each time interval.
Equation 3

- Calculate the intrinsic buffering capacity (βi; Equation 4) of the cytosol at the pHi from the start of each interval in step 8.3.1 based on previous literature (see Equation 4).
NOTE: In Drosophila, the most thorough characterization of βi comes from larval motor nerve terminals35 and these data can be assumed to hold for MT cells in the absence of other available data.
Equation 4

- Calculate the product of βT (from step 8.3.2)and dpHi/dt (from step 8.3.1) to determine JH+ (Equation 3).
NOTE: In nominally bicarbonate-free solutions such as those described in this protocol, bicarbonate-derived buffering capacity (βb) is assumed to be ~0 mM. Total buffering capacity (βT) is the sum of βi andβb, and thus βi = βT in the absence of HCO3-/CO236. - Plot JH+ as a function of the pHi at the beginning of each time interval as outlined in step 6.14.9.
- Apply exponential decay functions to the portion of all datasets which overlap in pHi using statistical analysis software. Compare rates of change of the resulting functions to compare acid extrusion rates between cells and MT segments (Figure 6C).
NOTE: The most appropriate function used for curve fitting may not always be a single exponential. Other functions can be substituted if they improve the goodness of fit. - Calculate acid flux (see Equation 5) as a function of pHi to account for variations in cell size and shape.
Equation 5

NOTE: Cell dimensions can either be measured directly in images or approximated. Principal cells can be represented as halves of a hollow tube with the following dimensions: inner diameter 24 µm; outer diameter 48 µm; height 50 µm. Transitional stellate cells are variable but can be roughly represented as cylinders with heights of 50 µm and diameters of 10 µm. See final paragraph of Representative Results below. - Apply exponential decay functions to the portion of all datasets that overlap in pHi using statistical analysis software. Compare rates of change of the resulting functions to compare acid fluxes between cells and MT segments (Figure 6D).
- Calculate acid extrusion rate (JH+, see Equation 3) as a function of pHi to account for variations in resting pHi and acid loading between preparations34. Use the exponential functions derived in step 8.3 to calculate the derivative of pHi with regard to time in each time interval.
Results
Healthy tissues and proper identification of anterior MTs are vital to the success of this protocol. During dissection, care should be taken to not directly touch the MTs and to only handle them by the ureter as gripping the MTs directly will lead to breakage (Figure 4A - B). When MTs are swept flat onto the slide, the tubules must be touched as little as possible and excess motion avoided as this will damage the si...
Discussion
The success of quantification of pHi in Drosophila MTs depends entirely on the health of extracted MTs and the quality of mounting and dissection (Figure A - C). Thus, the careful handling of tissue as described is imperative. Slides freshly coated in PLL substantially aid MT mounting as they tend to be much more adhesive than slides which have previously been exposed to solution. Careful mounting will also aid in identification of distinct ...
Disclosures
The authors have nothing to disclose.
Acknowledgements
This work was supported by NIH DK092408 and DK100227 to MFR. AJR was supported by T32-DK007013. The authors wish to thank Dr. Julian A.T. Dow for the CapaR-GAL4 and c724-GAL4 Drosophila stocks. We also thank Jacob B. Anderson for assistance maintaining experimental fly crosses.
Materials
| Name | Company | Catalog Number | Comments |
| Poly-L-Lysine (PLL) Solution | Sigma-Aldrich | P4832 | Store at 4 °C, can be reused. |
| Nigericin Sodium Salt | Sigma-Aldrich | N7143 | CAUTION: Handle with gloves. Store as aliquots of 20 mM stock solution in DMSO at 4 °C. |
| Adhesive Perfusion Chamber Covers, adhesive size 1 mm, chamber diameter × thickness 9 mm × 0.9 mm, ports diameter 1.5 mm | Sigma-Aldrich | GBL622105 | Can be substituted as needed to match perfusion system. |
| Sylgard 184 Silicone Elastomer Kit | Ellsworth Adhesives | 184 SIL ELAST KIT 0.5KG | Available from multiple vendors. |
| Helping Hands Soldering Stands | Harbor Freight Tools | 60501 | Available from multiple vendors. |
| Open Gravity-fed Perfusion System with Valve Controller, 8 to 1 Manifold and Reserviors | Bioscience Tools | PS-8S | Any comparable perfusion system can be used. |
| Flow Regulator | Warner Instruments | 64-0221 | Can be substituted as needed to match perfusion system. |
| Schneider's Medium | Fisher Scientific | 21720024 | Store at 4 °C in sterile aliquots. |
| #5 Inox Steel Forceps | Fine Science Tools | 11252-20 | Can be substituted based on experimenter comfort. |
| 35 x 10 mm polystyrene Petri dish | Corning Life Sciences | Fisher Scientific 08-757-100A | Exact brand and size are unimportant. |
| 75 x 25 mm Microscope Slides | Corning Life Sciences | 2949-75X25 | Exact brand and size can vary as long as perfusion wells are compatible. |
| Filimented Borosilicate Capillary Glass, ID 1.5 mm, OD 0.86 mm, thickness 0.32 mm | Warner Instruments | 64-0796 | Filiment not necessary, glass can be substituted to match perfusion tubing and perfusion wells. |
| Tygon Tubing, ID 1/16", OD 1/8", thickness 1/32" | Fisher Scientific | 14-171-129 | Available from multiple vendors, can be substituted to match perfusion system. |
| Vacuum Silicone Grease | Sigma-Aldrich | Z273554 | Available from multiple vendors. |
| Plastic Flow Control Clamp | Fisher Scientific | 05-869 | Available from multiple vendors, sterility not required |
| Glass rods, 5 mm diameter | delphiglass.com | 9198 | Exact size is personal preference, multiple vendors available |
| PAP Hydrophobic Pen | Sigma-Aldrich | Z377821 | Available from multiple vendors. |
| Sealing Film | Sigma-Aldrich | P7668 | Available from multiple vendors. |
| 15 mL Falcon tube | BD Falcon | 352096 | Available from multiple vendors. |
| 50 mL Falcon tube | BD Falcon | 352070 | Available from multiple vendors. |
| HEPES; 4-(2-Hydroxyethyl)piperazine-1-ethanesulfonic acid | Sigma-Aldrich | H3375 | Available from multiple vendors. |
| MES; 4-Morpholineethanesulfonic acid monohydrate | Sigma-Aldrich | 69892 | Available from multiple vendors. |
| TAPS; N-[Tris(hydroxymethyl)methyl]-3-aminopropanesulfonic acid | Sigma-Aldrich | T5130 | Available from multiple vendors. |
| 10X/0.45 Air Objective | Zeiss | 000000-1063-139 | Comparable objectives can be substituted. 40X objectives can be used for single cell imaging. |
| Dissecting Stereoscope | Zeiss | Discovery.V8 | Any dissecting stereoscope can be used. |
| UAS-pHerry transgenic Drosophila melagnogaster | Available from Romero Lab | First published: Citation 10 | |
| capaR-GAL4 driver line Drosophila melagnogaster | Available from Romero Lab | First published: Citation 32 | |
| c724-GAL4 driver line Drosophila melagnogaster | Available from Romero Lab | First published: Citation 2 | |
| Monochromatic High Sensitivity Digital Camera | Zeiss | Axiocam 506 mono | Exact brand and model can vary, can be replaced with any monochromatic high-sensitivity camera suited to live cellular imaging. |
| GFP/FITC filter set, 470/40 nm ex., 515 nm longpass em., 500 nm dichroic | Chroma | CZ909 | Any GFP/FITC filer set can be substituted. |
| RFP/TRITC filter set, 546/10 nm ex., 590 nm longpass em., 565 nm dichroic | Chroma | CZ915 | Any GFP/FITC filer set can be substituted. |
| Inverted Epifluoescent Microscope | Zeiss | Axio Observer Z.1 | Any comparable microscope with motorized filter switching can be used. Upright microscopes can be used with open perfusion baths and water-immersion objectives. |
| Statistical Analysis Software | Microcal | Origin 6.0 | Any software with comparable functionality can be substituted |
| Image Analysis Software | National Institutes of Health | ImageJ 1.50i | Any software with comparable functionality can be substituted |
| Image Acquisition Software | Zeiss | Zen 1.1.2.0 | Any software with comparable functionality can be substituted |
| Single-edged Carbon Steel Razor Blade | Electron Microscopy Sciences | 71960 | Available from multiple vendors. |
| Microscopy Slide Folder | Fisher Scientific | 16-04 | Available from multiple vendors. |
| Bunsen Burner | Fisher Scientific | 50-110-1231 | Available from multiple vendors. |
| Polystrene Drosophila Rearing Vials with Flugs | Genesee Scientific | 32-109BF | Comparable items can be substituted. |
| 2.5 L Laboratory Ice Bucket | Fisher Scientific | 07-210-129 | Available from multiple vendors. |
| NMDG; N-Methyl-D-glucamine | Sigma-Aldrich | M2004 | Available from multiple vendors. |
| 200 uL barrier pipette tips | MidSci | AV200 | Available from multiple vendors. |
| 200 μL variable volume pipette | Gilson Incorporated | PIPETMAN P200 | Available from multiple vendors. |
References
- Dow, J. A. T., Romero, M. F. Drosophila provides rapid modeling of renal development, function, and disease. Am J Physiol Renal Physiol. 299 (6), F1237-F1244 (2010).
- Sozen, M. A., Armstrong, J. D., Yang, M., Kaiser, K., Dow, J. A. Functional domains are specified to single-cell resolution in a Drosophila epithelium. P Natl Acad Sci USA. 94 (10), 5207-5212 (1997).
- Davies, S. A., et al. Analysis and inactivation of vha55, the gene encoding the vacuolar ATPase B-subunit in Drosophila melanogaster reveals a larval lethal phenotype. J Biol Chem. 271 (48), 30677-30684 (1996).
- Torrie, L. S., et al. Resolution of the insect ouabain paradox. P Natl Acad Sci USA. 101 (37), 13689-13693 (2004).
- Evans, J. M., Allan, A. K., Davies, S. A., Dow, J. A. Sulphonylurea sensitivity and enriched expression implicate inward rectifier K+ channels in Drosophila melanogaster renal function. J Exp Biol. 208 (Pt 19), 3771-3783 (2005).
- Sciortino, C. M., Shrode, L. D., Fletcher, B. R., Harte, P. J., Romero, M. F. Localization of endogenous and recombinant Na(+)-driven anion exchanger protein NDAE1 from Drosophila melanogaster. Am J Physiol Cell Physiol. 281 (2), C449-C463 (2001).
- Ianowski, J. P., O'Donnell, M. J. Basolateral ion transport mechanisms during fluid secretion by Drosophila Malpighian tubules: Na+ recycling, Na+:K+:2Cl- cotransport and Cl- conductance. J Exp Biol. 207 (Pt 15), 2599-2609 (2004).
- O'Donnell, M. J., et al. Hormonally controlled chloride movement across Drosophila tubules is via ion channels in stellate cells. Am J Physiol. 274 (4 Pt 2), R1039-R1049 (1998).
- Cabrero, P., et al. Chloride channels in stellate cells are essential for uniquely high secretion rates in neuropeptide-stimulated Drosophila diuresis. P Natl Acad Sci USA. 111 (39), 14301-14306 (2014).
- Rossano, A. J., Kato, A., Minard, K. I., Romero, M. F., Macleod, G. T. Na+ /H+ -exchange via the Drosophila vesicular glutamate transporter (DVGLUT) mediates activity-induced acid efflux from presynaptic terminals. J Physiol. 595 (3), 805-824 (2017).
- Sankaranarayanan, S., De Angelis, D., Rothman, J. E., Ryan, T. A. The use of pHluorins for optical measurements of presynaptic activity. Biophys J. 79 (4), 2199-2208 (2000).
- Miesenbock, G., De Angelis, D. A., Rothman, J. E. Visualizing secretion and synaptic transmission with pH-sensitive green fluorescent proteins. Nature. 394 (6689), 192-195 (1998).
- Shaner, N. C., et al. Improved monomeric red, orange and yellow fluorescent proteins derived from Discosoma sp. red fluorescent protein. Nat biotechnol. 22 (12), 1567-1572 (2004).
- Thomas, J. A., Buchsbaum, R. N., Zimniak, A., Racker, E. Intracellular pH measurements in Ehrlich ascites tumor cells utilizing spectroscopic probes generated in situ. Biochemistry. 18 (11), 2210-2218 (1979).
- Brand, A. H., Perrimon, N. Targeted gene expression as a means of altering cell fates and generating dominant phenotypes. Development. 118 (2), 401-415 (1993).
- Dietzl, G., et al. A genome-wide transgenic RNAi library for conditional gene inactivation in Drosophila. Nature. 448 (7150), 151 (2007).
- Dow, J. A., et al. The malpighian tubules of Drosophila melanogaster: a novel phenotype for studies of fluid secretion and its control. J Exp Biol. 197, 421-428 (1994).
- Hirata, T., et al. In vivo Drosophilia genetic model for calcium oxalate nephrolithiasis. Am J Physiol Renal Physiol. 303 (11), F1555-F1562 (2012).
- Schellinger, J. N., Rodan, A. R. Use of the Ramsay Assay to Measure Fluid Secretion and Ion Flux Rates in the Drosophila melanogaster Malpighian Tubule. J Vis Exp. (105), (2015).
- Caldwell, P. C. An investigation of the intracellular pH of crab muscle fibres by means of micro-glass and micro-tungsten electrodes. J Physiol. 126 (1), 169-180 (1954).
- Boron, W. F., De Weer, P. Intracellular pH transients in squid giant axons caused by CO2, NH3, and metabolic inhibitors. J Gen Physiol. 67 (1), 91-112 (1976).
- Rink, T. J., Tsien, R. Y., Pozzan, T. Cytoplasmic pH and free Mg2+ in lymphocytes. J Cell Biol. 95 (1), 189-196 (1982).
- Bizzarri, R., Serresi, M., Luin, S., Beltram, F. Green fluorescent protein based pH indicators for in vivo use: a review. Anal Bioanal Chem. 393 (4), 1107-1122 (2009).
- Kneen, M., Farinas, J., Li, Y., Verkman, A. S. Green fluorescent protein as a noninvasive intracellular pH indicator. Biophys J. 74 (3), 1591-1599 (1998).
- Raimondo, J. V., Irkle, A., Wefelmeyer, W., Newey, S. E., Akerman, C. J. Genetically encoded proton sensors reveal activity-dependent pH changes in neurons. Front Mol Neurosci. 5, 68 (2012).
- Raimondo, J. V., et al. Tight Coupling of Astrocyte pH Dynamics to Epileptiform Activity Revealed by Genetically Encoded pH Sensors. J Neurosci. 36 (26), 7002-7013 (2016).
- Bagar, T., Altenbach, K., Read, N. D., Bencina, M. Live-Cell imaging and measurement of intracellular pH in filamentous fungi using a genetically encoded ratiometric probe. Eukaryot Cell. 8 (5), 703-712 (2009).
- Gjetting, K. S., Ytting, C. K., Schulz, A., Fuglsang, A. T. Live imaging of intra- and extracellular pH in plants using pHusion, a novel genetically encoded biosensor. J Exp Bot. 63 (8), 3207-3218 (2012).
- Greenspan, R. J. . Fly pushing: the theory and practice of Drosophila genetics. , (2004).
- Raimondo, J. V., et al. A genetically-encoded chloride and pH sensor for dissociating ion dynamics in the nervous system. Front Cell Neurosci. 7, 202 (2013).
- Koivusalo, M., et al. Amiloride inhibits macropinocytosis by lowering submembranous pH and preventing Rac1 and Cdc42 signaling. J Cell Biol. 188 (4), 547-563 (2010).
- Terhzaz, S., et al. Mechanism and function of Drosophila capa GPCR: a desiccation stress-responsive receptor with functional homology to human neuromedinU receptor. PloS one. 7 (1), e29897 (2012).
- Boyarsky, G., Ganz, M. B., Sterzel, R. B., Boron, W. F. pH regulation in single glomerular mesangial cells. I. Acid extrusion in absence and presence of HCO3. Am J Physiol. 255 (6 Pt 1), C844-C856 (1988).
- Chesler, M. The regulation and modulation of pH in the nervous system. Prog Neurobiol. 34 (5), 401-427 (1990).
- Rossano, A. J., Chouhan, A. K., Macleod, G. T. Genetically encoded pH-indicators reveal activity-dependent cytosolic acidification of Drosophila motor nerve termini in vivo. J Physiol. 591 (7), 1691-1706 (2013).
- Roos, A., Boron, W. F. Intracellular pH. Physiol Rev. 61 (2), 296-434 (1981).
- Vaughan-Jones, R. D., Wu, M. L. pH dependence of intrinsic H+ buffering power in the sheep cardiac Purkinje fibre. J Physiol. 425, 429-448 (1990).
- Buckler, K. J., Vaughan-Jones, R. D., Peers, C., Nye, P. C. Intracellular pH and its regulation in isolated type I carotid body cells of the neonatal rat. J Physiol. 436, 107-129 (1991).
- Bevensee, M. O., Schwiening, C. J., Boron, W. F. Use of BCECF and propidium iodide to assess membrane integrity of acutely isolated CA1 neurons from rat hippocampus. J Neurosci Methods. 58 (1-2), 61-75 (1995).
- Arosio, D., et al. Simultaneous intracellular chloride and pH measurements using a GFP-based sensor. Nat Methods. 7 (7), 516-518 (2010).
- Wu, Y., Baum, M., Huang, C. L., Rodan, A. R. Two inwardly rectifying potassium channels, Irk1 and Irk2, play redundant roles in Drosophila renal tubule function. Am J Physiol Regul Integr Comp Physiol. 309 (7), R747-R756 (2015).
- Schulte, A., Lorenzen, I., Bottcher, M., Plieth, C. A novel fluorescent pH probe for expression in plants. Plant Methods. 2, 7 (2006).
- Shen, Y., Rosendale, M., Campbell, R. E., Perrais, D. pHuji, a pH-sensitive red fluorescent protein for imaging of exo- and endocytosis. J Cell Biol. 207 (3), 419-432 (2014).
- Johnson, D. E., et al. Red fluorescent protein pH biosensor to detect concentrative nucleoside transport. J Biol Chem. 284 (31), 20499-20511 (2009).
- Mahon, M. J. pHluorin2: an enhanced, ratiometric, pH-sensitive green florescent protein. Adv Biosci Biotechnol. 2 (3), 132-137 (2011).
- Li, Y., Tsien, R. W. pHTomato, a red, genetically encoded indicator that enables multiplex interrogation of synaptic activity. Nat Neurosci. 15 (7), 1047-1053 (2012).
- Tantama, M., Hung, Y. P., Yellen, G. Imaging intracellular pH in live cells with a genetically encoded red fluorescent protein sensor. J Am Chem Soc. 133 (26), 10034-10037 (2011).
- Matlashov, M. E., et al. Fluorescent ratiometric pH indicator SypHer2: Applications in neuroscience and regenerative biology. Biochimica et biophysica acta. 1850 (11), 2318-2328 (2015).
- Kogure, T., et al. A fluorescent variant of a protein from the stony coral Montipora facilitates dual-color single-laser fluorescence cross-correlation spectroscopy. Nat biotechnol. 24 (5), 577-581 (2006).
- Llopis, J., McCaffery, J. M., Miyawaki, A., Farquhar, M. G., Tsien, R. Y. Measurement of cytosolic, mitochondrial, and Golgi pH in single living cells with green fluorescent proteins. P Natl Acad Sci USA. 95 (12), 6803-6808 (1998).
- Poburko, D., Santo-Domingo, J., Demaurex, N. Dynamic regulation of the mitochondrial proton gradient during cytosolic calcium elevations. J Biol Chem. 286 (13), 11672-11684 (2011).
- Stornaiuolo, M., et al. KDEL and KKXX retrieval signals appended to the same reporter protein determine different trafficking between endoplasmic reticulum, intermediate compartment, and Golgi complex. Mol Biol Cell. 14 (3), 889-902 (2003).
- Makkerh, J. P., Dingwall, C., Laskey, R. A. Comparative mutagenesis of nuclear localization signals reveals the importance of neutral and acidic amino acids. Curr Biol. 6 (8), 1025-1027 (1996).
- Zacharias, D. A., Violin, J. D., Newton, A. C., Tsien, R. Y. Partitioning of lipid-modified monomeric GFPs into membrane microdomains of live cells. Science. 296 (5569), 913-916 (2002).
- McGuire, R. M., Silberg, J. J., Pereira, F. A., Raphael, R. M. Selective cell-surface labeling of the molecular motor protein prestin. Biochem Biophys Res Comm. 410 (1), 134-139 (2011).
Reprints and Permissions
Request permission to reuse the text or figures of this JoVE article
Request PermissionThis article has been published
Video Coming Soon
Copyright © 2025 MyJoVE Corporation. All rights reserved