
A subscription to JoVE is required to view this content. Sign in or start your free trial.
Method Article
In Situ Microscopy for Real-time Determination of Single-cell Morphology in Bioprocesses
In This Article
Summary
A photo-optical in situ microscopy device was developed to monitor the size of single cells directly in the cell suspension. The real-time measurement is conducted by coupling the photo-optical sterilizable probe to an automated image analysis. Morphological changes appear with dependence on the growth state and cultivation conditions.
Abstract
In situ monitoring in microbial bioprocesses is mostly restricted to chemical and physical properties of the medium (e.g.,pH value and the dissolved oxygen concentration). Nevertheless, the morphology of cells can be a suitable indicator for optimal conditions, since it changes with dependence on the growth state, product accumulation and cell stress. Furthermore, the single-cell size distribution provides not only information about the cultivation conditions, but also about the population heterogeneity. To gain such information, a photo-optical in situ microscopy device1 was developed to enable the monitoring of the single-cell size distribution directly in the cell suspension in bioreactors. An automated image analysis is coupled to the microscopy based on a neural network model, which is trained with user-annotated images. Several parameters, which are gained from the captures of the microscope, are correlated to process relevant features of the cells, like their metabolic activity. Until now, the presented in situ microscopy probe series was applied to measure the pellet size in filamentous fungi suspensions. It was used to distinguish the single-cell size in microalgae cultivation and relate it to lipid accumulation. The shape of cellular particles was related to budding in yeast cultures. The microscopy analysis can be generally split into three steps: (i) image acquisition, (ii) particle identification, and (iii) data analysis, respectively. All steps have to be adapted to the organism, and therefore specific annotated information is required in order to achieve reliable results. The ability to monitor changes in cell morphology directly in line or on line (in a by-pass) enables real-time values for monitoring and control, in process development as well as in production scale. If the off line data correlates with the real-time data, the current tedious off line measurements with unknown influences on the cell size become needless.
Introduction
Morphological features of cells are often related to the physiological state, a connection between form and function exists for many applications. The morphology of a single cell is influenced by the state of growth, the cell's age, osmotic and other potential cell stresses or product accumulation. Morphological changes of cells are often a measure of the growth vitality of a culture. Intracellular product synthesis, lipid accumulation in algae and inclusion body formation in bacteria, among others, are related with the cell size as well. Cell agglomeration can be another factor that is worth investigating as summarized recently2.
Population heterogeneities can be quantified based on morphological features of individual cells. Studies showed that heterogeneity within a culture might be significant, e.g., under large-scale production conditions3 the overall yield might be affected by a low performance of subpopulations4.
Usually, the assessment of morphological features of cells is performed by manual sampling or with a by-pass flow chamber coupled to a photo-optical device. This leads to several restrictions: the limited amount of acquired data can hardly provide statistically reliable measurements; the time delay in between sampling and the accessibility of results may be too long in comparison to the dynamics of the process; and most important, the sampling procedure (location of the sampling port, pre-treatment of the sample before the measurement, unfavorable conditions in the sampling or bypass tube) can trigger a biased error as the sample procedure itself can already affect cell morphology. Finally, there exists always a high risk of contamination during sampling or in by-pass solutions, if they are not sterilizable in place.
The application of in situ microscopy (ISM) can circumvent several of these problems. If cells are detected automatically, a correct identification of their morphological features can be surveyed5. Until now, the main limitations of this method were (i) the evaluation time of images, which was too long for in situ applications, and (ii) the poor resolution of images, especially at high cell densities. Although first solutions of ISM included mechanical sampling, dilution of the probe, or were restricted to a by-pass system6,7, further approaches allow capture of the cell suspension directly8.
Recent advances in ISM allow for the in line or on line monitoring of cells on a single-cell basis, which provides the distribution of morphological parameters in real-time directly in cell suspensions at considerably high cell concentrations. Through off line analyses of the cells' key parameters, correlations with information provided by the coupled automated cell detection and ISM can be identified. Then, new soft sensor designs are achieved, in which an unmeasurable parameter is estimated with the single-cell morphology.
In this report, the ISM is conducted by coupling a photo-optical probe to an automated image analysis. The ISM consists of a single-rod sensor probe that enables the capture of images within a known focus range in an adjustable measurement gap with a high-resolution CCD camera [MM-Ho = CCD GT2750 (2750x2200) and MM 2.1 = CMOS G507c (2464x2056)]. The flash light illumination is conducted by transmission. Therefore, the light originates from the opposite side of the camera9 and its intensity can be adjusted. Cells pass continuously through this gap with the liquid flow. Hence, a representative sample population is obtained. The probe can be mounted directly to the bioreactor so that it reaches into the cell suspension, or it can be used in a sterilizable by-pass. The sensor shell is connected to the system prior to sterilization, the optical parts are afterwards mounted into the shell.
Until now, relevant industrial microorganisms, e.g., filamentous fungi (diameter of up to over 200 µm), the heterotrophic microalgae Crypthecodinium cohnii (average cell diameter of 20 µm), and the yeast Saccharomyces cerevisiae (average cell diameter of 5 µm), were investigated with this or similar devices, which is shortly described.
Filamentous fungi tend to form pellets under certain cultivation conditions. These are of a size of up to several hundred µm. The hyphae of the fungal cells develop different lengths in dependence to the hydrodynamic stress in the fluid phase. This has an influence on the metabolic and growth activity, substrate uptake and product release. ISM was applied to identify the pellet size distribution and the width of zones of lower biomass density at the edges of the pellets (own unpublished data).
The size of C. cohnii alters between 15 and 26 µm when cells accumulate the polyunsaturated fatty acid docosahexaenoic acid (DHA) under nitrogen limitation. This biotechnological DHA production process consists of two parts, the growth phase, in which cells divide and become smaller, and the production phase, in which cells accumulate the product and thus become larger. Therefore, the cell size was used to determine the process state, in which either growth or DHA production was favorable. Finally, a correlation between the cell size and the DHA content was found. In this case, ISM allows to monitor the intracellular DHA accumulation in real time without the requirement of sampling, cell disruption, and the common gas chromatography analysis10.
Budding yeast is usually of a size between 3 and 8 µm. The proportion of cells that are in the maturation state at a time, as described with the budding index (BI), provides information about the growth vitality11,12, and even a relation with recombinant protein secretion has been proven13. With the help of ISM, budding and non-budding yeast cells (cells with and without a bud) were distinguished14. Stress conditions can also lead to a broader variation of the cell size within a yeast population, as recently shown in scale-down cultivations, in which the conditions of large-scale nutrient-limited fed-batch cultivations were mimicked3.
Therefore, ISM has the potential to monitor growth vitality and product formation on a single-cell level during all stages of a bioprocess for the identification of optimal cultivation conditions, or for the purpose of process control. The methods described here are focused on microbial applications with single cells, but are also applicable to larger particles like human and animal cells, cell agglomerates and pellets of filamentous organisms.
Protocol
NOTE: The following steps are necessary to adapt the parameters to the respective microorganism and culture conditions. The adjustment of probe settings lasts about 20 min for an experienced user. A detailed description of tools and steps is given in the corresponding probe manual from SOPAT GmbH. In general, the tools that are presented in the following protocol are needed: (i) Probe Controller for probe adjustments and image acquisition; (ii) Fiji (ImageJ) for annotations on acquired images; (iii) SOPAT support for artificial neural network (ANN) training and workflow creation; (iv) Batcher for data batch processing using already acquired images with a workflow; (v) Result Analyzer for result visualization and evaluation on batch processed images; and (vi) Monitor for automated real-time measurement and result visualization.
1. Setting Hardware Parameters
- Prepare a culture with the highest cell concentration that might be achieved during the experiment or centrifuge and resuspend the pellet in order to achieve this concentration. In this case, 65 g L-1 of dry biomass concentration was chosen for S. cerevisiae cultivations.
- Prepare different dilutions, which range from the highest to the lowest concentration so that the expected range is fully covered. A minimum of 4 different concentrations are recommended.
- Identify the cell size range of the microorganism with conventional microscopy. Define the expected maximum diameter (dmax) of respective cells. This value is set to 8 µm in case of S. cerevisiae.
- Choose two measurement gaps of 5x and 10x of the expected dmax of the cells.
- Choose the maximum stroboscope intensity. Choose stroboscope intensities for both gaps with the highest cell concentration so that cells are still visible on the images with the lowest light intensity (darkest images).
- Choose the minimum stroboscope intensity, and then choose stroboscope intensities for both gaps so that cells are still visible on the images with the highest light intensity (brightest images). Use the lowest cell concentration, which likely appears during the measurement period.
- Choose one focus position, which yields the sharpest images for each measurement gap, for both stroboscope intensities and for the concentration range that need to be tested (see step 2 for details about focusing). Focus cells appropriately so that the image data can be annotated afterwards (see step 4).
- Measure the previously prepared dilution series of the cell concentration (see step 2) with both gap widths and stroboscope intensities.

Figure 1: Concentration calibration tool. Left GUI: set image directories (minimum of 3) with known concentrations; central GUI: choose features to be calculated on the image directory; right GUI: choose the weighted root mean square error (WRMSE) to identify the minimum. WRMSE and the best correlation between any image feature and the cell concentration. Please click here to view a larger version of this figure.
- Evaluate the dilution series experiment.
- Use the Concentration Calibration (CoCa) Tool (see Figure 1) to identify the optimal correlation between the extracted image features (brightness or sharpness) and the previously measured concentrations provided by the user, e.g., dry biomass or cell counts. Follow the instructions in the software manual for further details.
- Identify the optimal correlation between the extracted information from the image features at various concentrations compared to any off line measurements. See the legend of Figure 1.
- Choose the most reasonable measurement gap and stroboscope intensities under consideration of the concentration correlation curve with the features that result in the smallest weighted root mean square error (WRMSE).
NOTE: The measurement gap is fixed during the experiment, whereas the stroboscope intensity can be adapted according to the cell concentration.
2. Off Line Measurement
- Adjust the desired measurement gap according to step 1 with the help of a thickness gauge.
- Open the graphical user interface Probe Control in the SOPAT dashboard.
- Connect the desired probe to the amplifier in the software subsection Actions and press Connect.
- Press the Play button to start streaming (Live View).
- Clean the measurement gap by spraying ethanol into the gap and carefully wipe any dust or dirt with an optical paper. Check that the glass of the sensor is free of particles with the Live View in the CamControl.
NOTE: Particles and dust disturb measurements and the automatic cell identification. - Place a dry optical paper in the measurement gap. Open the tab Probe control and adjust the stroboscope intensity in order to visualize the paper. Turn the binding screw until the single fibers of the paper are clearly seen.
- Fill a tube with culture broth. Dip the microscope in the culture broth so that the gap is fully covered with cell suspension. Open the tab Probe control and adjust the desired stroboscope intensity according to section 1. Focus on the cells by fine-tuning the focus binding screw. The focus must not be changed anymore during the experiment
NOTE: 5-6 mL of culture broth are added to a 50 mL conical centrifugal tube to float the measuring gap sufficiently. - Define the number of frames per time point [-] in the user interface in the menu Triggering in the GUI Frames per trigger. Set the number of frames to 200 frames per trigger.
NOTE: The number of frames can be reduced to the lowest value, which is necessary for a statistical reliable result. This depends on the sample size required to obtain a representative morphological cell size distribution (see also step 5). - Define the frame rate [Hz] in the menu Triggering in the GUI Frame rate. Choose a frame rate that guarantees that moving particles from a previous frame will not appear in the following frame.
NOTE: This can be proven with a test trigger with 200 frames. Inspect the images for particles, which are captured repeatedly. If this is the case, decrease the frame rate. For off line measurements, 1 Hz is recommended. - Set the directory, in which the acquired images will be saved, in the menu General.
- Perform an image acquisition by activating the Start image trigger acquisition button. Move the tube with culture suspension gently up and down to induce a flow through the measuring gap.
- Repeat step 2.5 after each measurement.
- Check the acquired images. Cells have to be sharp enough for annotation. Inspect the images for particles, which are captured repeatedly. If this is the case, decrease the frame rate.
- Save the settings by selecting the following pathway: C:\Program Files\SOPAT GmbH\monitoringPrograms\camcontrol, and press Save.
3. Particle Identification
- Annotate particles for the training of the artificial neural network (ANN) (training set).
- Load the acquired images into the annotation tool "Fiji, ImageJ" by dragging and dropping the file into the Main "ImageJ" window (see GUI "Fiji" tool in Figure 2)
- Open the ROI Manager by selecting: Analyze | Tools | ROI Manager.
- Choose a selection tool. Wand (tracing) tool, freehand, oval, or elliptical selections are recommended.
- Draw a circle around the particle that shall be annotated with the selection tools mentioned before and then refine it with the brush tool.
- Add the annotation to the ROI Manager by pressing Add [t].
- Mark all objects of interest (cells to be identified) on about 15 images.
NOTE: In order to cover all necessary information, i.e., different shapes, sizes, concentration of cells, brightness, etc., use five images from the start, five images from in between, and five images from the end of the experiment. - Decide, if cells need to be classified in different subclasses due to their shape (e.g., different phases of a cell cycle), or if all cells are of the same class.
- Change the name of each selected particles accordingly. Set one name or abbreviation for each class and a counter for each particle of the class (e.g., cell_1, cell_2, etc.). Annotate at least 50 particles per class.
- Do not annotate objects, which should not be detected, because they are not relevant for the process, such as gas bubbles or other particles like undissolved media components.
NOTE: Those events will not be included in the training procedure for the ANN and be regarded as background. - Do not annotate cells that are out of focus.
- Annotate the images as consistent as possible. If there are doubts, the label Ignore can be applied. It is highly recommended not to abuse its use, since the ANN will only recognize structures that are labeled.

Figure 2: Fiji tool user interface. A training set is created with the annotated images. A manual annotation consisting of two classes is depicted, the list of annotated particles is shown in the ROI Manager. Different names and colors can be set for different classes. Please click here to view a larger version of this figure.
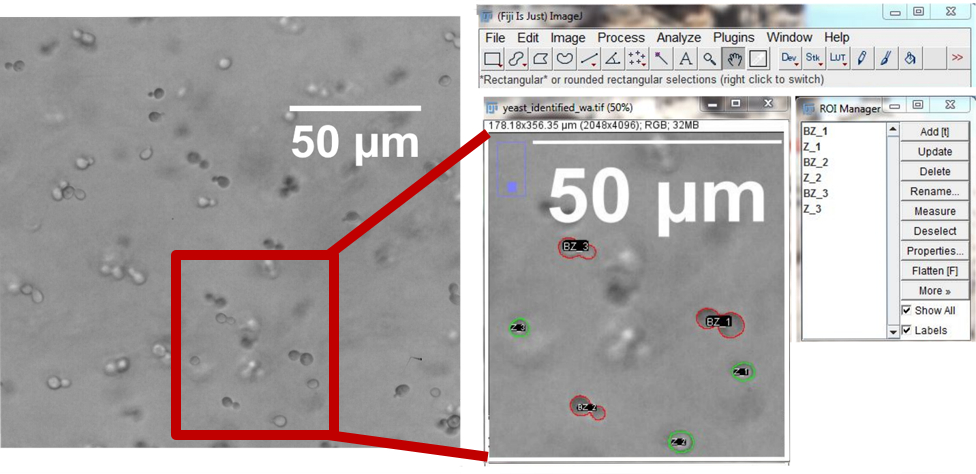
- Save the annotated objects and the image to a ZIP format and send the file to the training network, either via upload to the platform or by sending the ZIP file via e-mail.
NOTE: Usually, it takes a number of iterative training rounds to identify adequate predictions of the classified objects on the images. Each training round leads to a workflow that is returned by the program. - Use the workflow (*.wf) with the trained object recognition algorithm to analyze test images with the data batch progressing program Batcher that can be started in the dashboard.
- Check object detection on the test images through the quantification of false positive and negative events.
- Quantify the detection of false positive events: particles erroneously detected as cells, cells that are not correctly classified, and cells of which the contour has not been well identified.
- Quantify the false negative events (cells that are not recognized as such).
- Visualize the results in the tool Result analyzer by starting the program in the dashboard.
- Import the desired results files with File | Import file or File | Import folders.
- Visualize the results by Chart | Create chart on the Charts GUI.
- Select one of the following options: Distribution chart, Sensitivity plot, Characteristic over time, Characteristic over survey points, and Feature vs. feature.
NOTE: A manual regarding the utilization of the Result Analyzer comes with the system and is also available from the support. - If the results are acceptable, run the workflow in the Batcher on all acquired images of the experiment. At the same time then the monitoring program can be created by combining the saved settings from the Probe Controller (*.pcfg) with the workflow (*.wf), see also the manual.
NOTE: The workflow can also be used for monitoring future experiments for this culture media. - If the results are not acceptable, check the annotation on the training set and/or continue with another iterative training round (see step 4.2).
4. Sample Size Quantification
- Set the standard deviation (σ), which is acceptable among the detected particles.
NOTE: The standard deviation changes in parallel to the cell size homogeneity. The maximum standard deviation indicates the sample with the highest degree of size heterogeneity. - Set the amplitude of the confidence interval or the desired accuracy in relation to the expected variance of measurements (e).
- Set the admitted error (α) between 5% (z1-α/2 = 1.96) and 10% (z1-α/2 = 1.64).
- Calculate the number of cells to be identified from each class from equation 1.
 [Equation 1]
NOTE: Based on the number of cells, the number of images that needs to be acquired can be defined for each data point. - Perform a sensitivity analysis on random time points of the experiment to check that the analysis of n particles leads to a variability of the mean Feret diameter and the Dv90 of less than 5%. It can be calculated automatically in the Result Analyzer.
5. On Line (By-Pass) or In Line Measurement
- Perform the off line measurement procedure first (see step 2) in order to set the hardware and software settings as a function of the organism and process (concentration or media).
- Upload the saved settings from the previous section by selecting the button Load and select the following pathway: C:\Program Files\SOPAT GmbH\monitoringPrograms\camcontrol.
- Connect the probe to the flow cell or to the bioreactor.
NOTE: In situ measurements can be performed with a pinch flange. - Perform sterilization.
NOTE: Only the probe-wetted material of the instrument is sterilizable through steam sterilization. The probe wetted length can go from 6 to 222 mm (Figure 3).

Figure 3: Sketch of the ISM devices. The probe MM-Ho (A) is installable directly in the bioreactor, whereas the probe MM 2.1 (B) can be used as a by-pass. The culture broth circulation is marked with arrows in each picture. The conversion factors are 0.166 µm pix-1 for MM-Ho and 0.087 µm pix-1 for MM 2.1. Please click here to view a larger version of this figure.
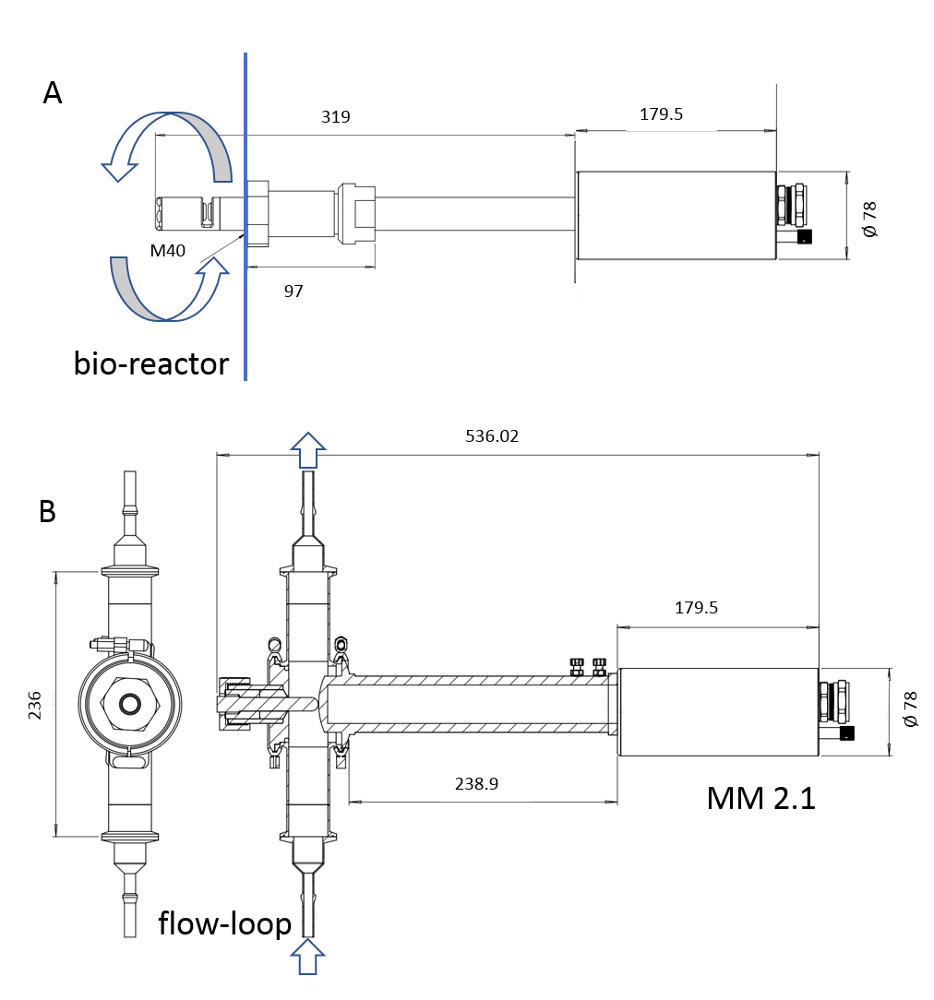
- Define the image acquisition rate in the GUI Triggering in the field Trigger interval [s].
NOTE: Depending on the process dynamics, the image acquisition rate can be adapted. For example, if a lag-phase of 3 hours is expected, the rate of acquisition can be lower, than if a metabolism shift or the accumulation of a product shall be monitored. Usually, this requires a much shorter acquisition time in the minute range. For example, an image acquisition sequence between 5 and 10 min during a batch yeast cultivation provides sufficient information to capture process dynamics. - Define the frame rate as explained in step 2.10.
NOTE: In on line and in line measurements, the frame rate can be increased, since the mechanical stirring can increase the flow rate through the gap. - Start image acquisition by activating the button Start streaming of selected probe.
- Stop acquisition when the experiment is finished with the button Stop streaming of selected probe.
NOTE: For the 1st run, start the acquisition just before the inoculation of the culture and proceed to step 4. For the following runs, open the program Monitoring in the dashboard and select the created workflow (see step 4). Start the monitoring just before the inoculation of the culture by pressing the Play button.
Results
The cell size detection in yeast cultures with the ISM and automated image detection to distinguish between budding and non-budding cells was successfully conducted. Both the stroboscope intensity and the choice of the measurement gap have a range of tolerance, in which the particle identification is not affected. For example, S. cerevisiae cells were measured with various stroboscope intensities within a variation range of 11% at a dry biomass concentration of 4 g L-1...
Discussion
ISM as presented here with the same or very similar devices was used to measure morphologic dynamics of fungi, microalgae, and yeast cells, which enabled the determination of growth activity, and in case of algae, intracellular product accumulation. The sensor has no movable parts and is directly applicable in any standard stirred tank bioreactor, either through a standard port or in a sterilizable by-pass. Since yeast is much smaller than algae, the reduction in cell size required some recent hardware adaptions like a h...
Disclosures
The authors have nothing to declare.
Acknowledgements
The authors are thankful for the support of the German Federal Ministry of Economics and Energy within the framework ZIM-Koop, project "Smart Process Inspection", grant no. ZF 4184201CR5.
Materials
| Name | Company | Catalog Number | Comments |
| Sensor MM 2.1 - MFC | SOPAT GmbH, Germany | n.a. | Inline Monocular Microscopic probe Version 2.1 with a Mirco Flow Cell |
| Sofware version v1R.003.0092 | SOPAT GmbH, Germany | n.a. | |
| Thickness gauge | n.n. | It can be any supplier, DIN 2275:2014-03 | |
| Ethanol 70% | n.n. | It can be any supplier | |
| SOPAT manual Version 2.0.5 | SOPAT GmbH, Germany | ||
| Optical lense paper | VWR | 470150-460 | |
| Fiji, ImageJ | open source | ||
| 50 mL conical centrifuge tubes | It can be any supplier |
References
- Maaß, S., Rojahn, J., Hänsch, R., Kraume, M. Automated drop detection using image analysis for online particle size monitoring in multiphase systems. Computers & Chemical Engineering. 45, 27-37 (2012).
- Lemoine, A., Delvigne, F., Bockisch, A., Neubauer, P., Junne, S. Tools for the determination of population heterogeneity caused by inhomogeneous cultivation conditions. Journal of biotechnology. 251, 84-93 (2017).
- Marbà-Ardébol, A. M., Bockisch, A., Neubauer, P., Junne, S. Sterol synthesis and cell size distribution under oscillatory growth conditions in Saccharomyces cerevisiae scale-down cultivations. Yeast. 35 (2), 213-223 (2017).
- Xiao, Y., Bowen, C. H., Liu, D., Zhang, F. Exploiting nongenetic cell-to-cell variation for enhanced biosynthesis. Nature chemical biology. 12 (5), 339-344 (2016).
- Beutel, S., Henkel, S. In situ sensor techniques in modern bioprocess monitoring. Applied microbiology and biotechnology. 91 (6), 1493 (2011).
- Belini, V. L., Wiedemann, P., Suhr, H. In situ microscopy: A perspective for industrial bioethanol production monitoring. Journal of microbiological methods. 93 (3), 224-232 (2013).
- Havlik, I., et al. Monitoring of microalgal cultivations with on-line, flow-through microscopy. Algal Research. 2 (3), 253-257 (2013).
- Suhr, H., Herkommer, A. M. In situ microscopy using adjustment-free optics. Journal of biomedical optics. 20 (11), 116007 (2015).
- Panckow, R. P., Reinecke, L., Cuellar, M. C., Maaß, S. Photo-Optical In-Situ Measurement of Drop Size Distributions: Applications in Research and Industry. Oil Gas Sci. Technol. - Rev. IFP Energies. 72 (3), 14 (2017).
- Marbà-Ardébol, A. -. M., Emmerich, J., Neubauer, P., Junne, S. Single-cell-based monitoring of fatty acid accumulation in Crypthecodinium cohnii with three-dimensional holographic and in situ microscopy. Process Biochemistry. 52, 223-232 (2017).
- Porro, D., Vai, M., Vanoni, M., Alberghina, L., Hatzis, C. Analysis and modeling of growing budding yeast populations at the single cell level. Cytometry. Part A : the journal of the International Society for Analytical Cytology. 75 (2), 114-120 (2009).
- Brauer, M. J., et al. Coordination of growth rate, cell cycle, stress response, and metabolic activity in yeast. Molecular biology of the cell. 19 (1), 352-367 (2008).
- Puxbaum, V., Gasser, B., Mattanovich, D. The bud tip is the cellular hot spot of protein secretion in yeasts. Applied microbiology and biotechnology. 100 (18), 8159-8168 (2016).
- Marbà-Ardébol, A. M., Emmerich, J., Neubauer, P., Junne, S. Vol. P2. Prozessmesstechnik. , 222-225 (2017).
- Marbà-Ardébol, A. -. M., Emmerich, J., Muthig, M., Neubauer, P., Junne, S. Real-time monitoring of the budding index in Saccharomyces cerevisiae batch cultivations with in situ microscopy. Microbial cell factories. 17 (1), 73 (2018).
- Marquard, D., Schneider-Barthold, C., Düsterloh, S., Scheper, T., Lindner, P. Online monitoring of cell concentration in high cell density Escherichia coli cultivations using in situ Microscopy. Journal of biotechnology. 259, 83-85 (2017).
- Marquard, D., et al. In situ microscopy for online monitoring of cell concentration in Pichia pastoris cultivations. Journal of biotechnology. 234, 90-98 (2016).
- Camisard, V., Brienne, J., Baussart, H., Hammann, J., Suhr, H. Inline characterization of cell concentration and cell volume in agitated bioreactors using in situ microscopy: application to volume variation induced by osmotic stress. Biotechnology and bioengineering. 78 (1), 73-80 (2002).
- Böhm, A., Ücker, A., Jäger, T., Ronneberger, O., Falk, T. ISOODL: Instance segmentation of overlapping biological objects using deep learning. , 1225-1229 (2018).
- Davey, H. M. Life, Death, and In-Between: Meanings and Methods in Microbiology. Applied and environmental microbiology. 77 (16), 5571-5576 (2011).
- Lodolo, E. J., Kock, J. L., Axcell, B. C., Brooks, M. The yeast Saccharomyces cerevisiae-the main character in beer brewing. FEMS yeast research. 8 (7), 1018-1036 (2008).
- Albertin, W., et al. Population size drives industrial Saccharomyces cerevisiae. alcoholic fermentation and is under genetic control. Applied and environmental microbiology. 77 (8), 2772-2784 (2011).
- Gomes, J., Chopda, V. R., Rathore, A. S. Integrating systems analysis and control for implementing process analytical technology in bioprocess development. Journal of Chemical Technology and Biotechnology. 90 (4), 583-589 (2015).
Reprints and Permissions
Request permission to reuse the text or figures of this JoVE article
Request PermissionExplore More Articles
This article has been published
Video Coming Soon
Copyright © 2025 MyJoVE Corporation. All rights reserved