
The Staircase Procedure for Finding a Perceptual Threshold
Overview
Source: Laboratory of Jonathan Flombaum—Johns Hopkins University
Psychophysics is the name for a set of methods in perceptual psychology designed in order to relate the actual intensity of stimuli to their perceptual intensity. One important aspect of psychophysics involves the measurement of perceptual thresholds: How bright does a light need to be for a person to be able to detect it? How little pressure applied to the skin is detectable? How soft can a sound be and still be heard? Put another way, what are the smallest amounts of stimulation that humans can sense? The staircase procedure is an efficient technique for identifying a person's perceptual threshold.
This video will demonstrate standard methods for applying the staircase procedure in order to identify a person's auditory threshold, that is, the minimal volume necessary for a tone to be perceived.
Procedure
1. Stimuli and Equipment
- This experiment will require a computer with basic experimental software as well as a set of headphones and a relatively quiet testing room (sound proofing is not necessary).
- The stimuli in the experiment will be tones of with frequencies of 1 kHz, 2 kHz, 3 kHz, 4 kHz, 5 kHz and 6 kHz. Human hearing is best within this frequency range.
- During the course of the experiment, the volume of the tones will be varied adaptively in the range of 1 to 40 dB, as will be clear
Results
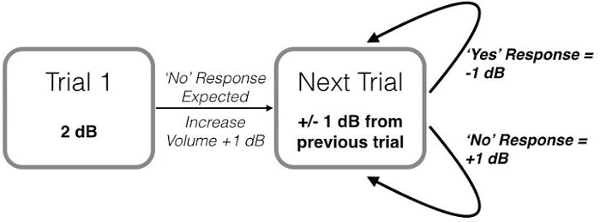
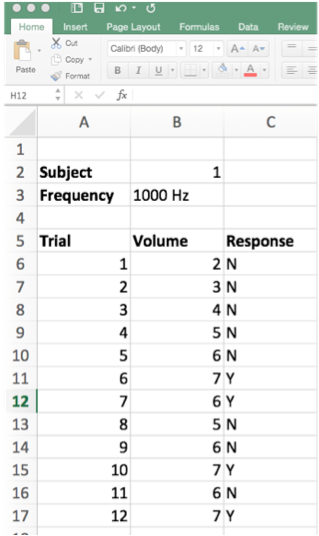
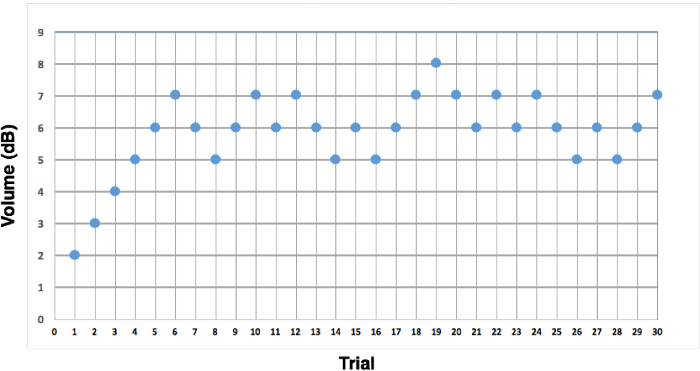
The aim of the staircase procedure is to bring the participant to a volume at which they can just barely hear a tone. This is achieved by prompting a series of 'No' responses in the first few trials. Once a 'Yes' response is produced, the goal is to keep the volume played close to the one that elicited the first 'Yes'. This is done by lowering the volume whenever a 'Yes' response is given. This produces a pattern in which the volume rises steadily in the first few trials, and then plateaus
Application and Summary
One of the primary applications of the auditory staircase procedure is to assess hearing impairment. Beyond normal aging, hearing impairments can be caused by damage to the inner ear, brain damage, and disease. Often, hearing impairment affects particular frequencies more than others. The staircase method can be used to determine whether someone possesses especially poor hearing within a narrow frequency range, which would suggest hearing impairment caused by more than normal aging. Figure 6 graphs audit
Skip to...
Videos from this collection:

Now Playing
The Staircase Procedure for Finding a Perceptual Threshold
Sensation and Perception
24.4K Views

Color Afterimages
Sensation and Perception
11.2K Views

Finding Your Blind Spot and Perceptual Filling-in
Sensation and Perception
17.4K Views

Perspectives on Sensation and Perception
Sensation and Perception
11.9K Views

Motion-induced Blindness
Sensation and Perception
7.0K Views

The Rubber Hand Illusion
Sensation and Perception
18.6K Views

The Ames Room
Sensation and Perception
17.6K Views

Inattentional Blindness
Sensation and Perception
13.4K Views

Spatial Cueing
Sensation and Perception
15.0K Views

The Attentional Blink
Sensation and Perception
16.1K Views

Crowding
Sensation and Perception
5.8K Views

The Inverted-face Effect
Sensation and Perception
15.7K Views

The McGurk Effect
Sensation and Perception
16.1K Views

Just-noticeable Differences
Sensation and Perception
15.4K Views

Object Substitution Masking
Sensation and Perception
6.6K Views
Copyright © 2025 MyJoVE Corporation. All rights reserved