
Stability of Floating Vessels
Overview
Source: Alexander S Rattner and Kevin Rao Li Department of Mechanical and Nuclear Engineering, The Pennsylvania State University, University Park, PA
The objective of this experiment is to demonstrate the phenomenon of stability of floating vessels - the ability to self-right when rolled over to the side by some external force. Careful design of hull shapes and internal mass distribution enables seagoing vessels to be stable with low drafts (submerged depth of hull), improving vessel maneuverability and reducing drag.
In this experiment, a model boat will first be modified to enable adjustment of its center of mass (representing different cargo loadings) and automated tracking of its roll angle. The boat will be placed in a container of water, and tipped to different angles with varying heights of its center of mass. Once released, the capsizing (tipping over) or oscillating motion of the boat will be tracked with a digital camera and video analysis software. Results for the maximum stable roll angle and frequency of oscillation will be compared with theoretical values. Stability calculations will be performed using geometric and structural properties of the boat determined in a computer aided design environment.
Principles
The buoyant force, which supports floating vessels, is equal to the weight of fluid displaced by the submerged portion of such vessels. The buoyant force acts upward, along the vertical line passing through the centroid (center of volume) of this submerged volume. This point is called the center of buoyancy. If the center of mass of a floating structure is below its center of buoyancy, any sideways rolling (heeling motion) will impart a moment to right the structure, returning it to the upright orientation (Fig. 1a). If the center of mass is above the center of buoyancy, the structure may be unstable, causing it capsize if disturbed (Fig. 1b). However, if the hull of a floating vessel is designed carefully, it can be stable, even if its center of mass is above its center of buoyancy. Here, tipping the vessel slightly causes the shape of its submerged volume to change, shifting its center of buoyancy outward in the direction of tipping. This results in a net righting moment as long as the line of action of buoyancy is outside of the center of mass of the structure (Fig. 1c). Equivalently, a vessel will be stable if the point of intersection of the line of action of buoyancy and the centerline of the hull (metacenter) is above its center of mass. Some vessels are metastable - only self-righting up to some critical angle.
It is also important to consider the dynamic behavior of a floating vessel. Strong impulses from waves may cause a boat to rotate past its metastable limit, even if the initial tipping angle is small (i.e.,  large for small
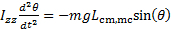
  ). The frequency and amplitude of oscillation may also affect passenger comfort. The rotational motion of a vessel can be predicted with a moment balance about its center of mass. Here, Izz is the moment of inertia about the center of mass, θ is the roll angle, m is the vessel mass, and Lcm,mc is the distance along the boat centerline from its center of mass to its metacenter.
 (1)
(1)
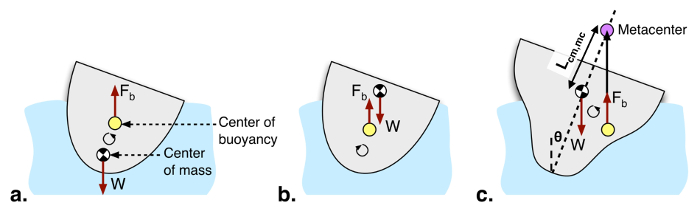
Figure 1: a. Stable vessel with center of mass below center of buoyancy, ensuring righting moment. b. Unstable vessel with center of mass above center of buoyancy. c. Hull shape that causes the center of buoyancy to acts outside the center of mass (metacenter above center of mass). This yields stability even with the center of mass above the center of buoyancy.
Procedure
1. Measuring maximum angle of stability
- Select a small model boat. A relatively simple hull design is recommended to reduce analysis complexity in Sections 3 and 4.
- Connect a lightweight brightly-colored vertical mast to the boat (blue recommended). The provided MATLAB code tracks the position of the mast in the video by looking for bright blue pixels in the image. If a different color mast is used, the image analysis code will have to be adjusted accordingly.
- Snugly affix a cable tie to the mast to act as a stop for a weight. Slide a weight (e.g., coupling nut) onto the mast so that it rests on the stop.
- Place the boat in a larger container of water, and allow it to settle (Fig. 2a). Position the setup so that airflow in the room does not disturb the boat. Mount a video camera facing the mast along the length of the boat. A white backdrop is recommended.
- Collect a reference video of the boat at rest, and analyze it using the provided MATLAB function (TrackMast.m). Adjust the orientation of the camera until it correctly reads 0-tilt when the boat is at rest. You may need to adjust the masking parameters to isolate the mast on line 17 of the code.
- Collect videos of very gradually tipping the boat by pressing sideways on the top of the mast until it falls over on its own (capsizes). Keep the mast in the video frame as long as possible during each test. Perform this procedure for different heights of the weight. Record the height of the weight on the mast for each case.
- Analyze these videos using the provided MATLAB script. For each case, the maximum stable angle can be determined by inspection of the output angle and time arrays. Complete a table of capsize angle vs. weight height.
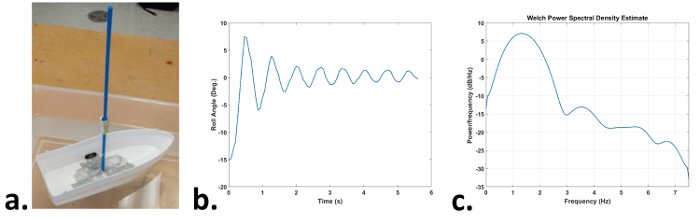
Figure 2: a. Model boat with adjustable weight on mast, b. Roll angle variation with when released from slight angle (Step 2.1), c. Power spectrum density plot of (b) showing peak oscillation frequency of 1.4 Hz Please click here to view a larger version of this figure.
2. Measuring the oscillation frequency
- Perform a second set of tipping experiments with two different mast-weight heights. This time, only tip the boat slightly (~10°), and collect videos of the rocking boat for 10 - 15 s.
- Rerun the mast tracking function on the video. After calling the function, evaluate the following MATLAB expression on the output: pwelch( theta,[],[], [],1/(t(2)-t(1)) ); . This will plot the power spectrum density for the rocking boat. The primary rolling frequency is the peak value on this plot (Fig. 2b-c).
3. Prediction of the tipping angle
- Using a scale, measure the mass of the model boat, including the mast and weight.
- For each position of the mast weight evaluated in Step 1.5, balance the boat on its side with the mast on a straight edge. Record the height of the balance point from the bottom of the hull as the center of mass (Hcm).
- Using a CAD software package, create a to-scale model of the boat and mast with weight. Ensure that the hull is filled-in (solid) in this model (Fig. 3a).
- Position the model so that the centreline of the bottom hull (keel) is coincident with the origin in the CAD environment and the mast is (initially) parallel with the vertical (y) axis.
- In the CAD environment, rotate the boat about the z-axis, which is along the length of the hull, in small increments (e.g., 5°, 10°, 15°…).
- After each rotation, cut away all of the boat above a vertical level such that the volume of the remaining lower portion equals the total boat mass divided by the density of water (m / ρw, ρw = 1000 kg m-3). This represents the portion of the boat below the water line when it is floating at that angle (Fig. 3b).
- Using the "Mass Properties" feature in the CAD software, evaluate the x-position of the centroid of the remaining hull. Here, the origin should be along the lowest edge of the boal (the keel), and the x-axis should point in the horizontal direction. This represents the center of buoyancy (xb); the buoyant force acts through this point. Prepare a table of xcm vs. θ.
- For each maximum stable angle (θ) identified in Step 1.6, compare the moment arm of the boat weight (
 ) and the moment arm of the restoring buoyant force (
 ). You may need to interpolate between the values obtained in Step 3.7. Do these balance approximately?
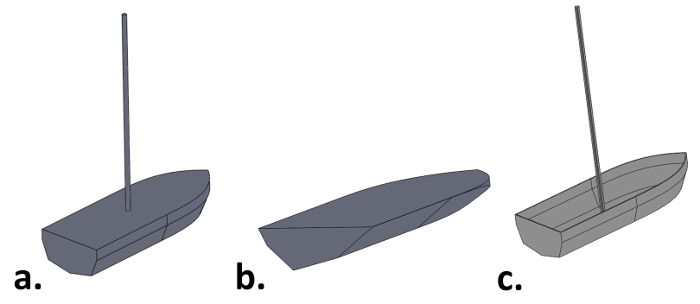
Figure 3: a. Filled in model of the boat hull, b. Vertical cutaway of the hull, revealing the submerged volume of the vessel, c. Physically accurate model of the vessel.
4. Predicting the period of oscillation
- Produce a second CAD model of the boat with the position of the weight corresponding to the cases in Step 2.1. This time model the actual thickness of the hull (i.e., not filled-in, Fig. 3c). Match the density of the materials with actual values.
- Using the CAD software "Mass Properties" feature, evaluate the moment of inertia of the boat about its center of mass along the roll axis (Izz) for the weight heights.
- Using results from preceding steps, and the x-position of the center of buoyancy measured when
 (Step 3.7), evaluate the theoretical oscillation frequencies:
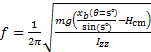 (2)
(2) - Compare the theoretical result from Step 4.3 with the measured oscillation frequencies. Do these values agree reasonably well?
Results
| Total mass (m, kg) |
Center of mass (Hcm, m) |
Center of buoyancy (  , m) , m) |
Moment of Inertia (Izz, kg m2) |
| 0.088 (Step 3.1) |
0.053 (Step 3.2) |
0.0078 (Step 3.7) |
0.00052 (Step 4.2) |
Table 1. Properties of model boat with 24 g weight positioned 13 cm above keel.
| Procedure Step | Experimental Value | Predicted Value |
| Maximum stable roll angle (1.6, 3.8) | ~25° | 28.5° |
| Natural roll frequency (2.2, 4.3) | 1.4 Hz | 1.24 Hz |
Table 2. Maximum stable roll angle and rolling frequency of boat with 24 g weight 13 cm above keel.
Application and Summary
This experiment demonstrated the phenomena of stability of floating vessels and how ships can stay upright even with relatively high centers of mass. For example, in the representative results, a small model boat with a center of mass (Hcm = 5.3 cm) well above the water line (Hwater line ~ 1 - 2 cm) could return to its upright position after being tipped to a ~25° angle. In the experiments, the maximum stable angle was measured for a model boat with different vertical centers of mass. The effect of center of mass height on oscillation (rolling) frequency was also evaluated. Both of these measurements were compared with theoretical values obtained using geometric parameters in CAD packages. These results and procedures can serve as a starting point for students seeking to design and analyze floating structures.
The property of stability is crucial for the design and operation of seagoing vessels. Ships operating with shallow drafts (most of the vessel above water) have reduced drag and increased maneuverability. In large cargo vessels, shipping containers can be stacked high above the top deck, increasing cargo capacity and facilitating loading and unloading operations. In cruise ships, shallow drafts permit many windows and decks for passenger. While stability is critical for safety, very stable hull shapes (high  ) yield fast rocking frequencies (Eqn. 2), which may be uncomfortably snappy for passengers. Hydrostatic stability analyses, as demonstrated in this experiment, are thus crucial tools to guide marine engineering.
Tags
Skip to...
Videos from this collection:

Now Playing
Stability of Floating Vessels
Mechanical Engineering
22.7K Views

Buoyancy and Drag on Immersed Bodies
Mechanical Engineering
30.1K Views

Propulsion and Thrust
Mechanical Engineering
21.8K Views

Piping Networks and Pressure Losses
Mechanical Engineering
58.5K Views

Quenching and Boiling
Mechanical Engineering
7.7K Views

Hydraulic Jumps
Mechanical Engineering
41.1K Views

Heat Exchanger Analysis
Mechanical Engineering
28.0K Views

Introduction to Refrigeration
Mechanical Engineering
24.7K Views

Hot Wire Anemometry
Mechanical Engineering
15.7K Views

Measuring Turbulent Flows
Mechanical Engineering
13.6K Views

Visualization of Flow Past a Bluff Body
Mechanical Engineering
12.0K Views

Jet Impinging on an Inclined Plate
Mechanical Engineering
10.8K Views

Conservation of Energy Approach to System Analysis
Mechanical Engineering
7.4K Views

Mass Conservation and Flow Rate Measurements
Mechanical Engineering
22.8K Views

Determination of Impingement Forces on a Flat Plate with the Control Volume Method
Mechanical Engineering
26.0K Views
Copyright © 2025 MyJoVE Corporation. All rights reserved