All
Research
Education
科研
教育
Business
解决方案
CN
EN - English
CN - 中文
DE - Deutsch
ES - Español
KR - 한국어
IT - Italiano
FR - Français
PT - Português
TR - Türkçe
JA - 日本語
PL - Polski
RU - Русский
HE - עִברִית
AR - العربية
登录
Chapter 11
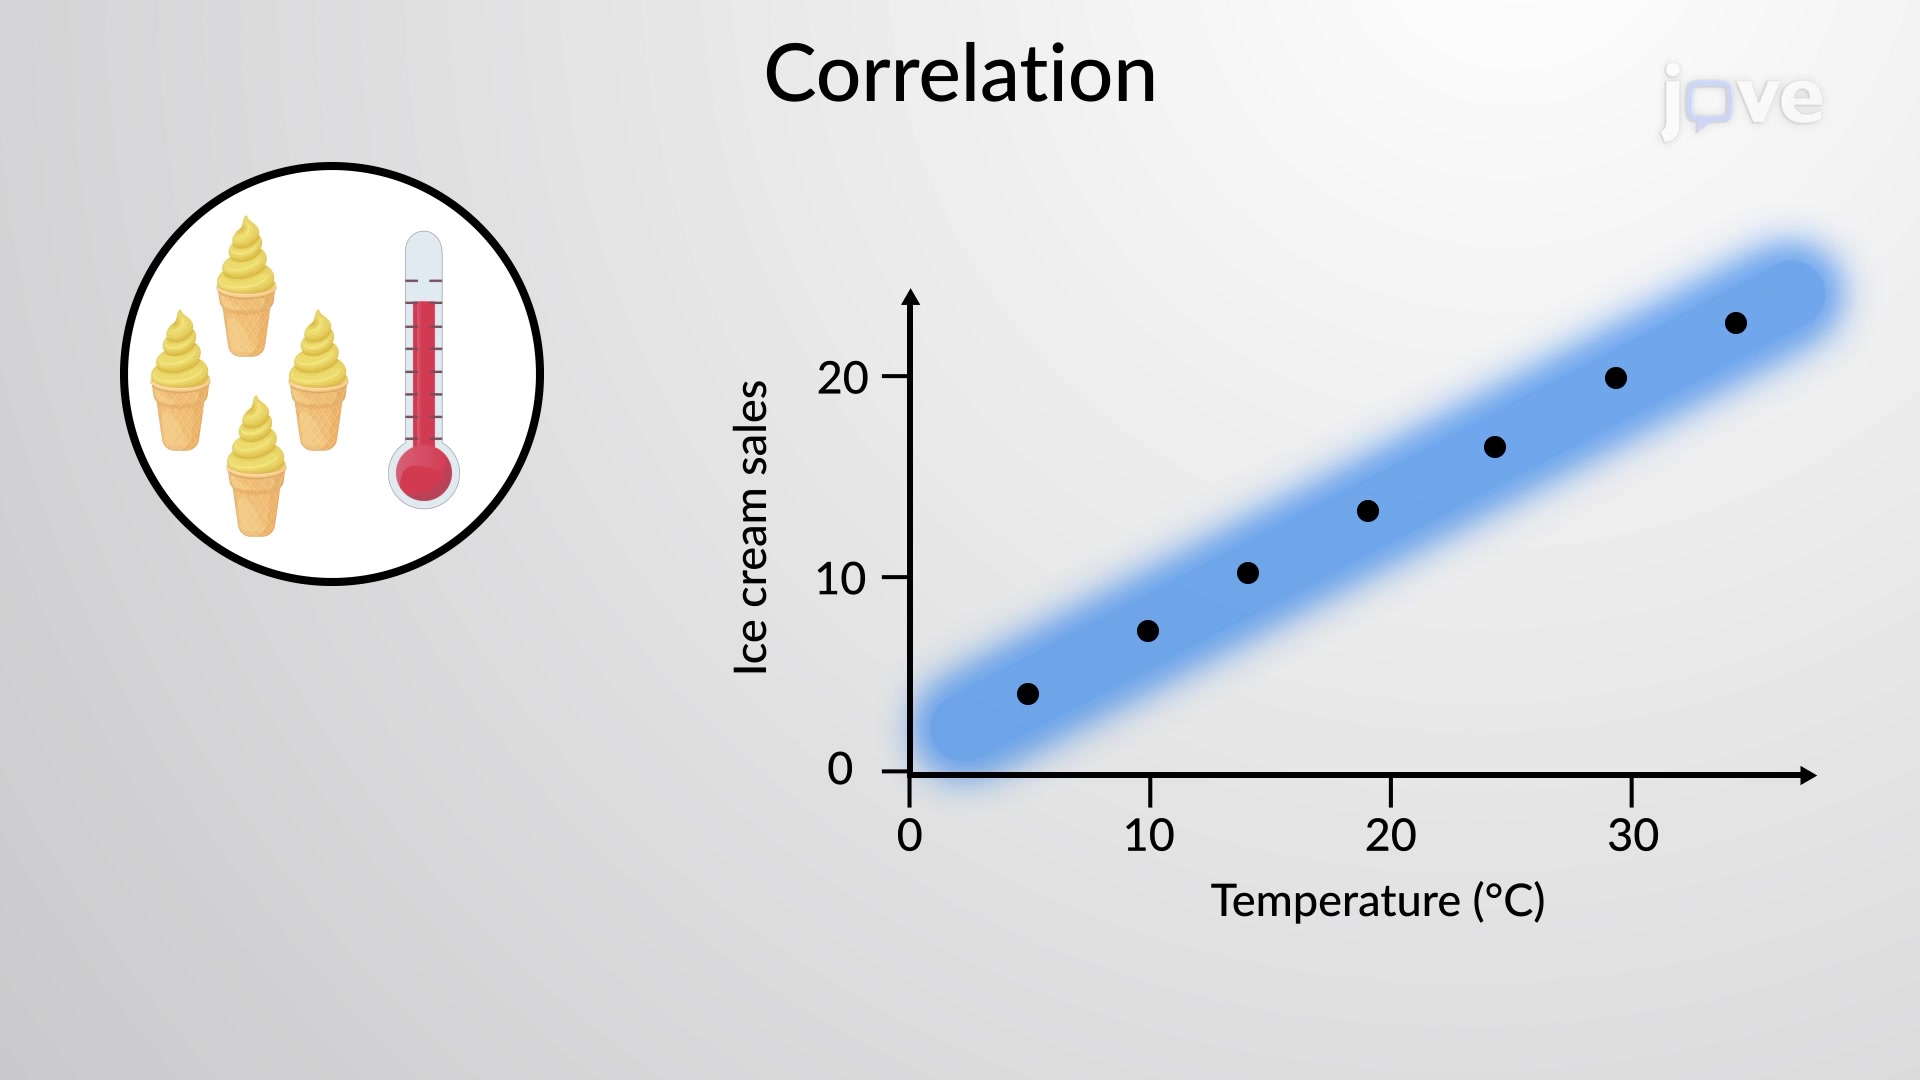
In statistics, two variables are said to be correlated if the values of one variable are associated with the other variable. Depending on the relationship ...
The correlation coefficient, r, developed by Karl Pearson in the early 1900s, is numerical and provides a measure of strength and direction of the linear ...
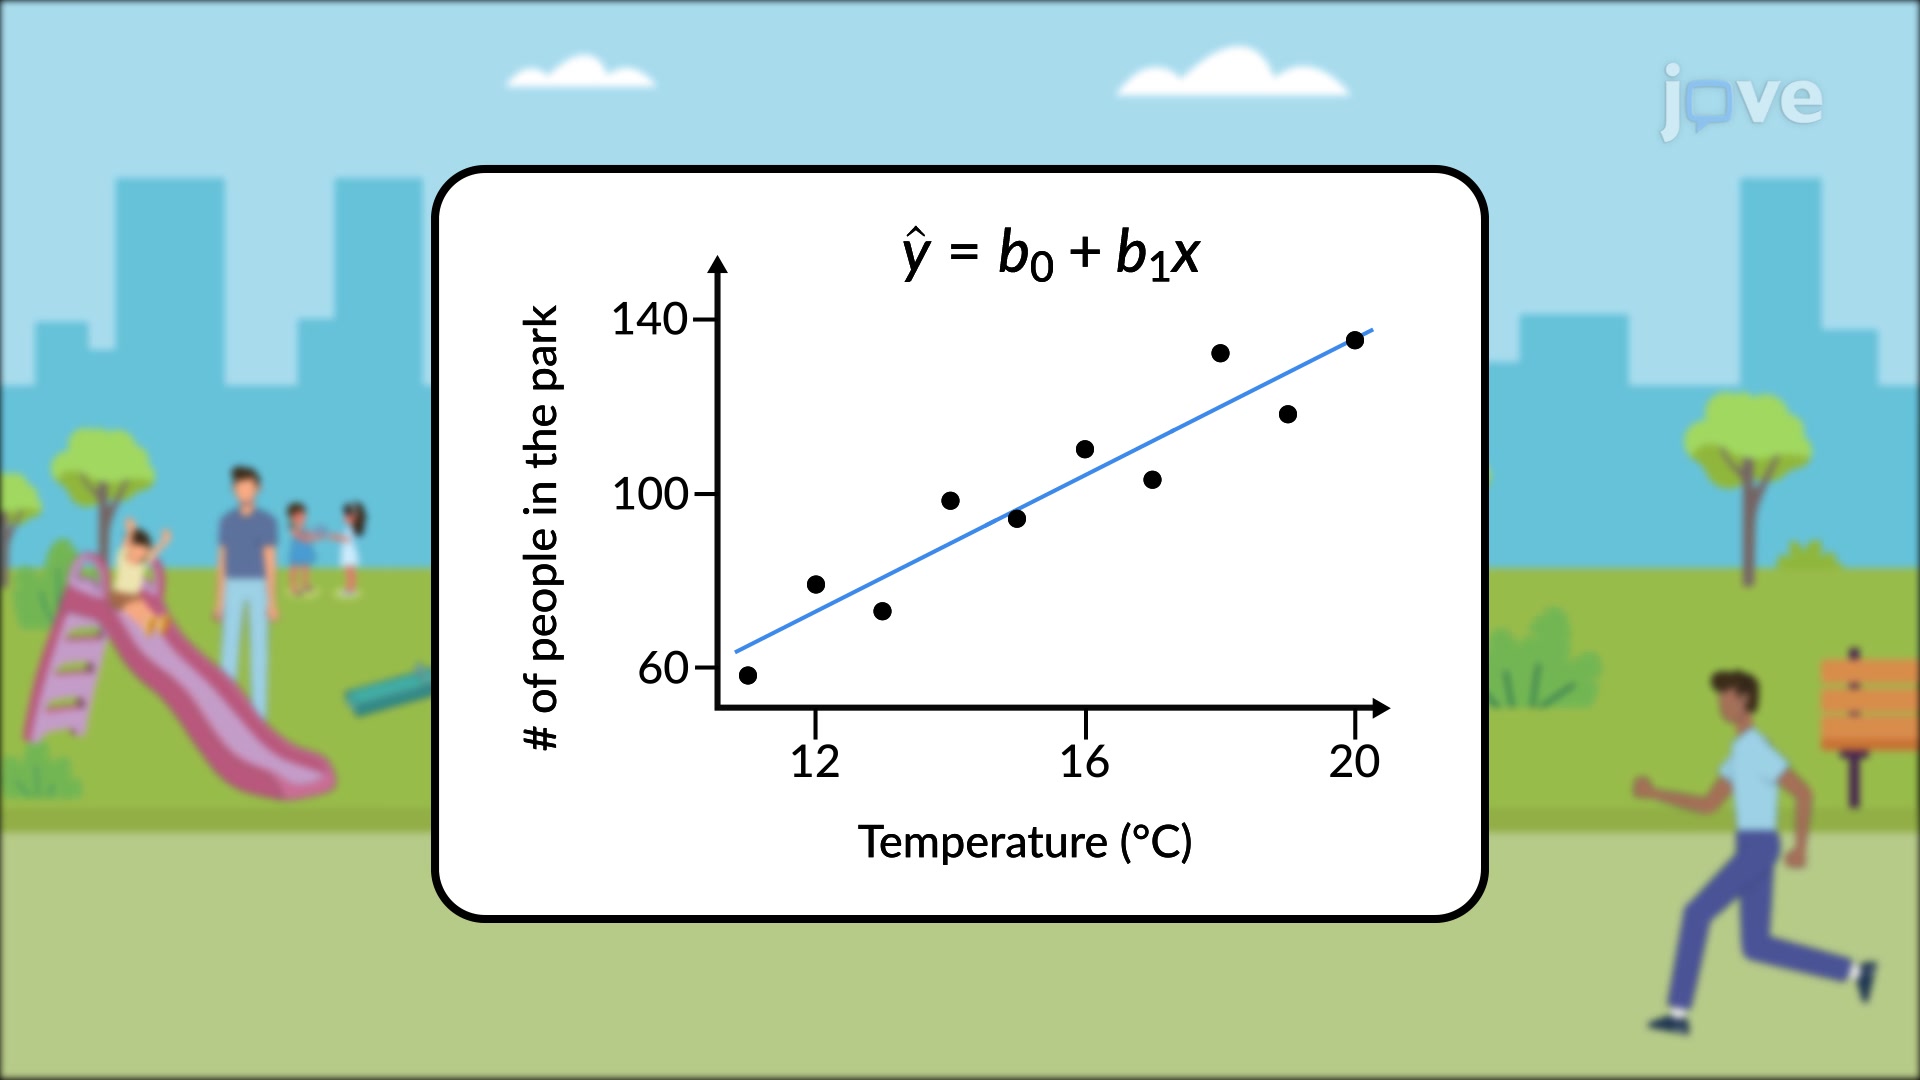
Regression analysis is a statistical tool that describes a mathematical relationship between a dependent variable and one or more independent variables. ...
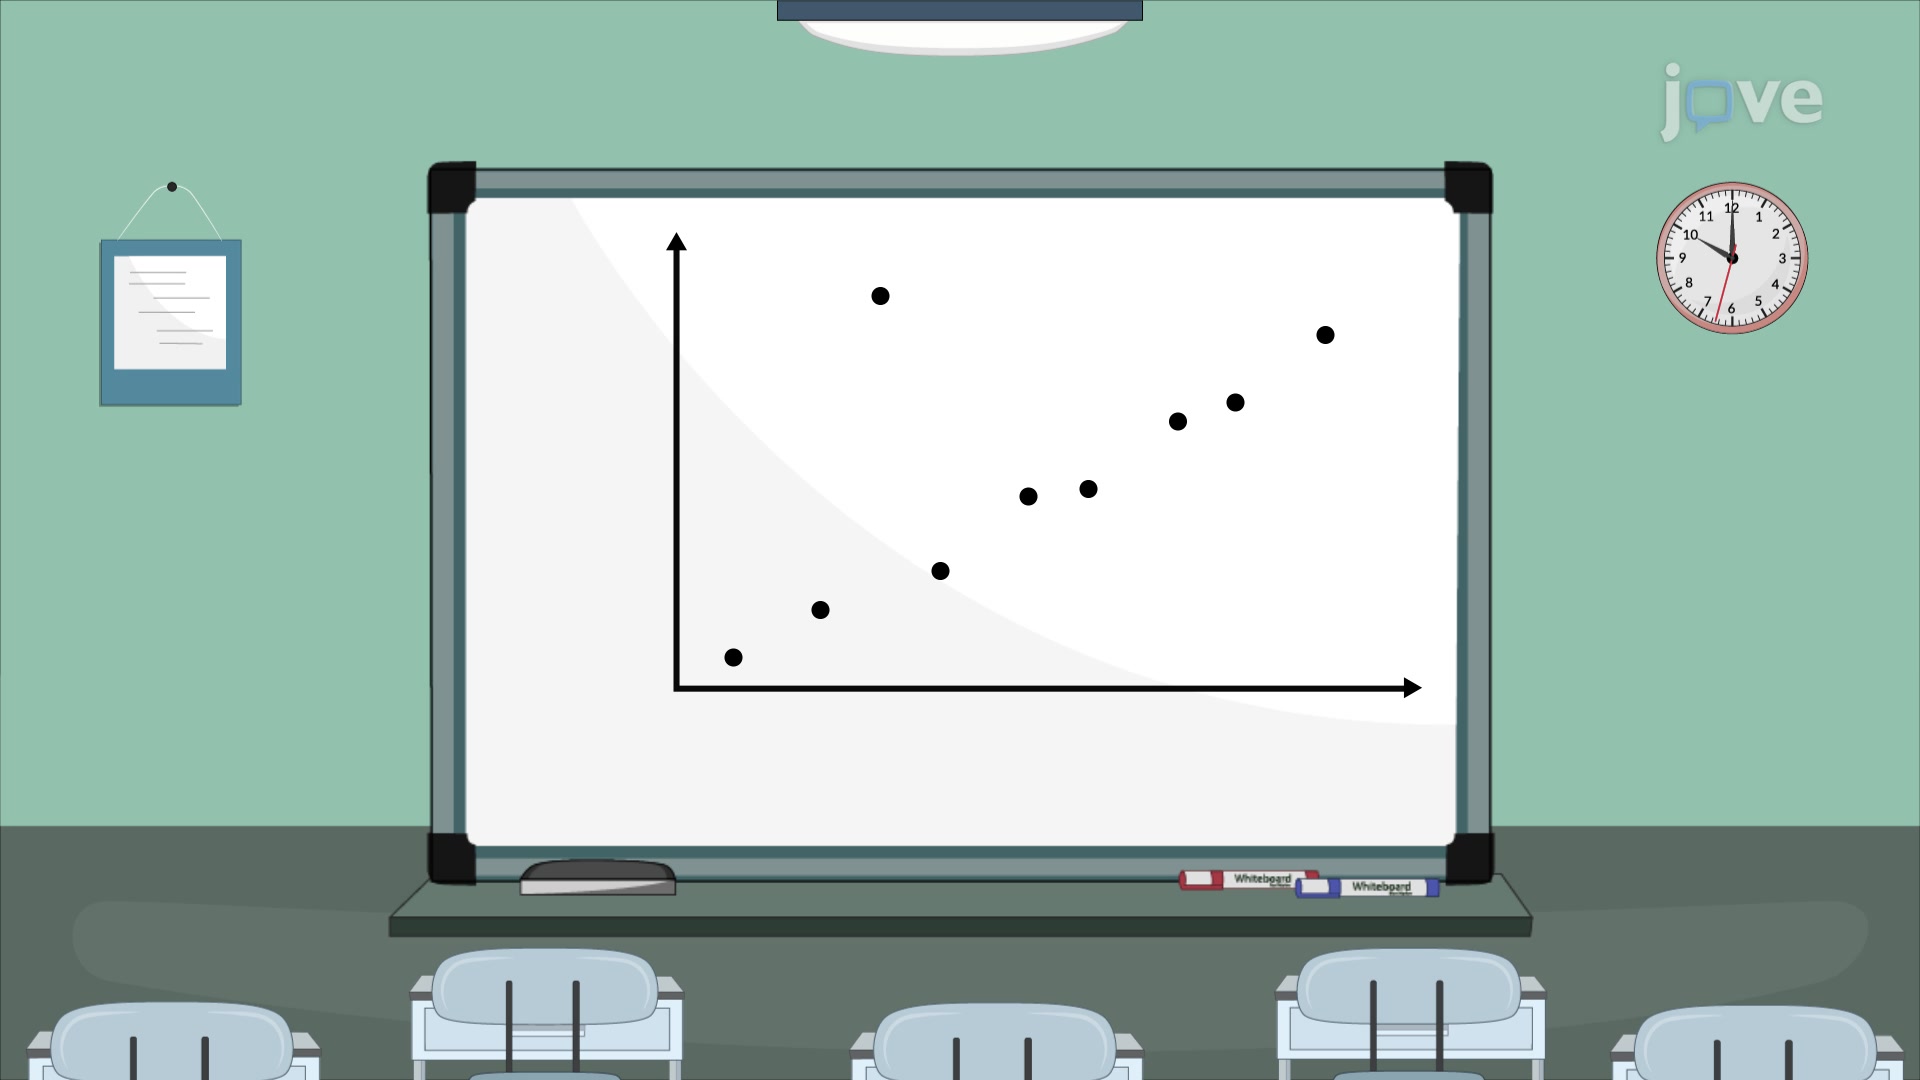
An outlier is an observation of data that does not fit the rest of the data. It is sometimes called an extreme value. When you graph an outlier, it will ...
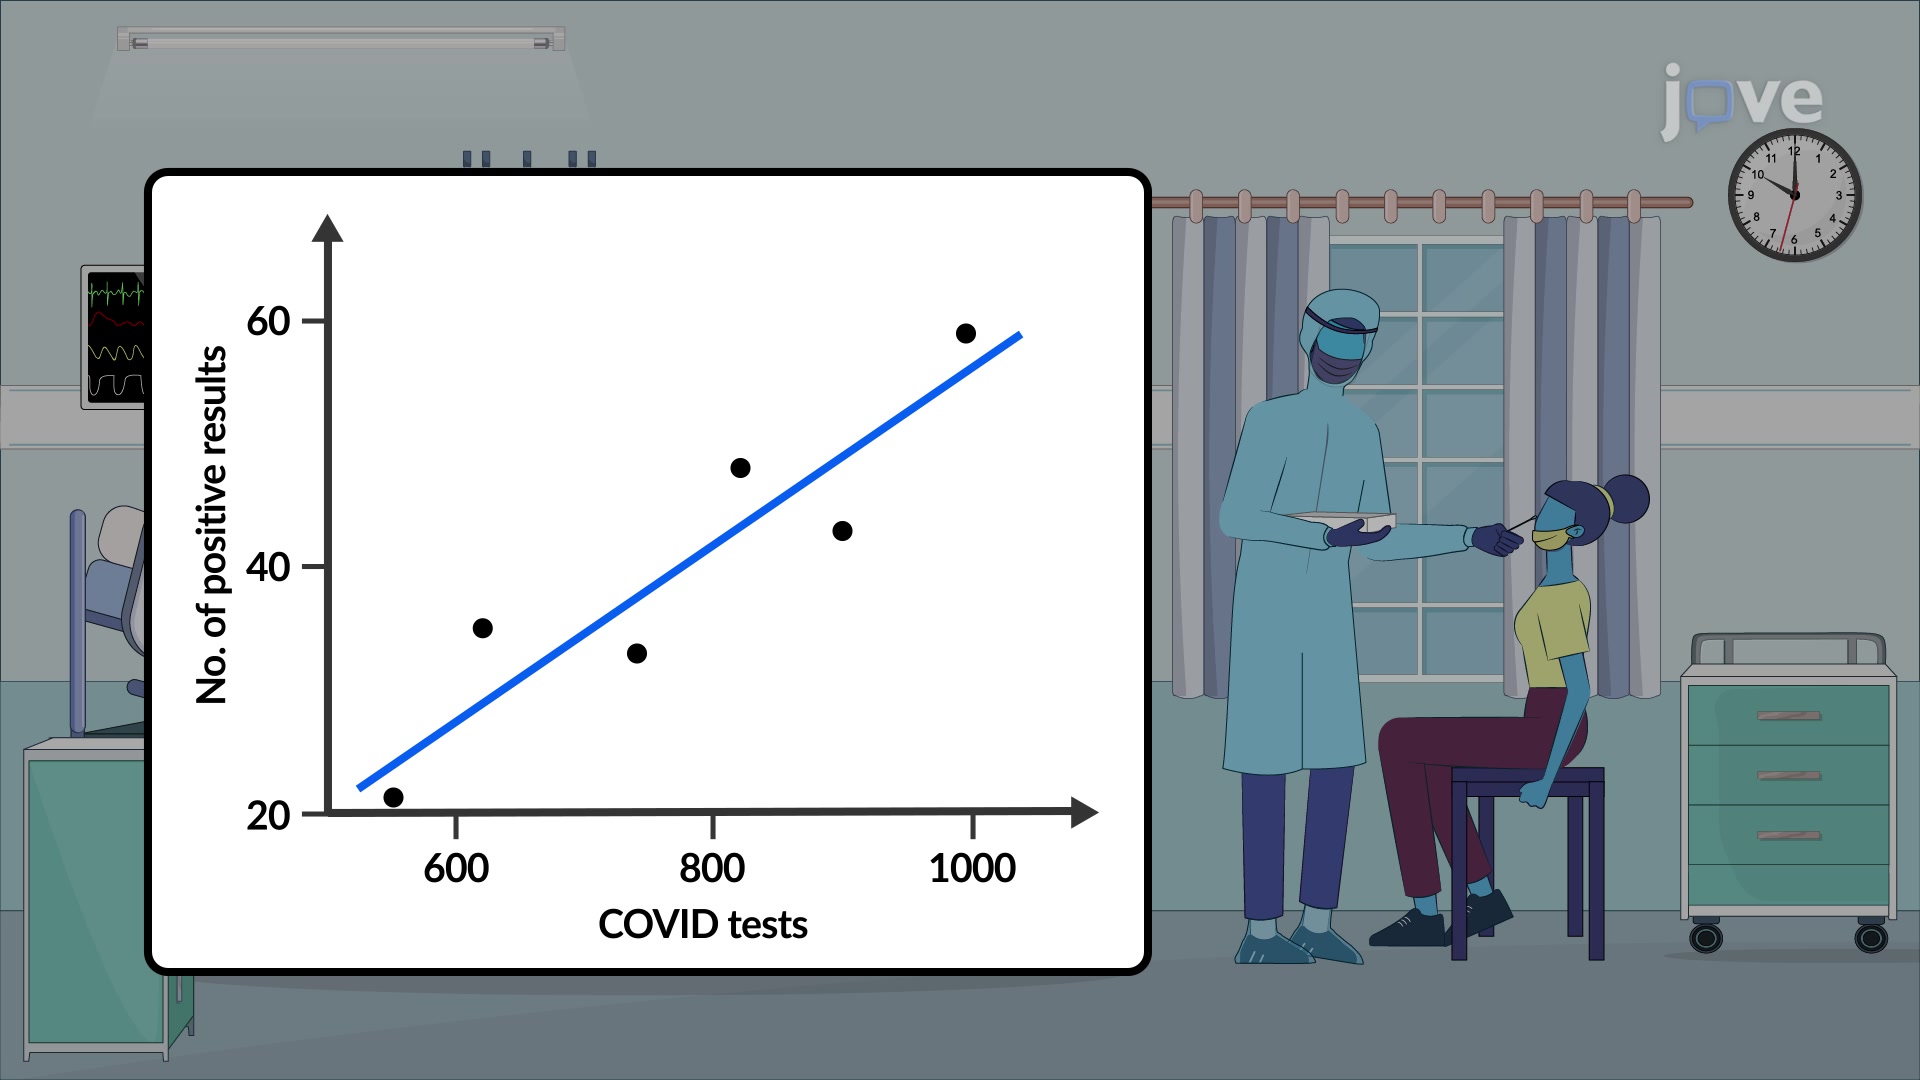
The vertical distance between the actual value of y and the estimated value of y. In other words, it measures the vertical distance between the actual ...
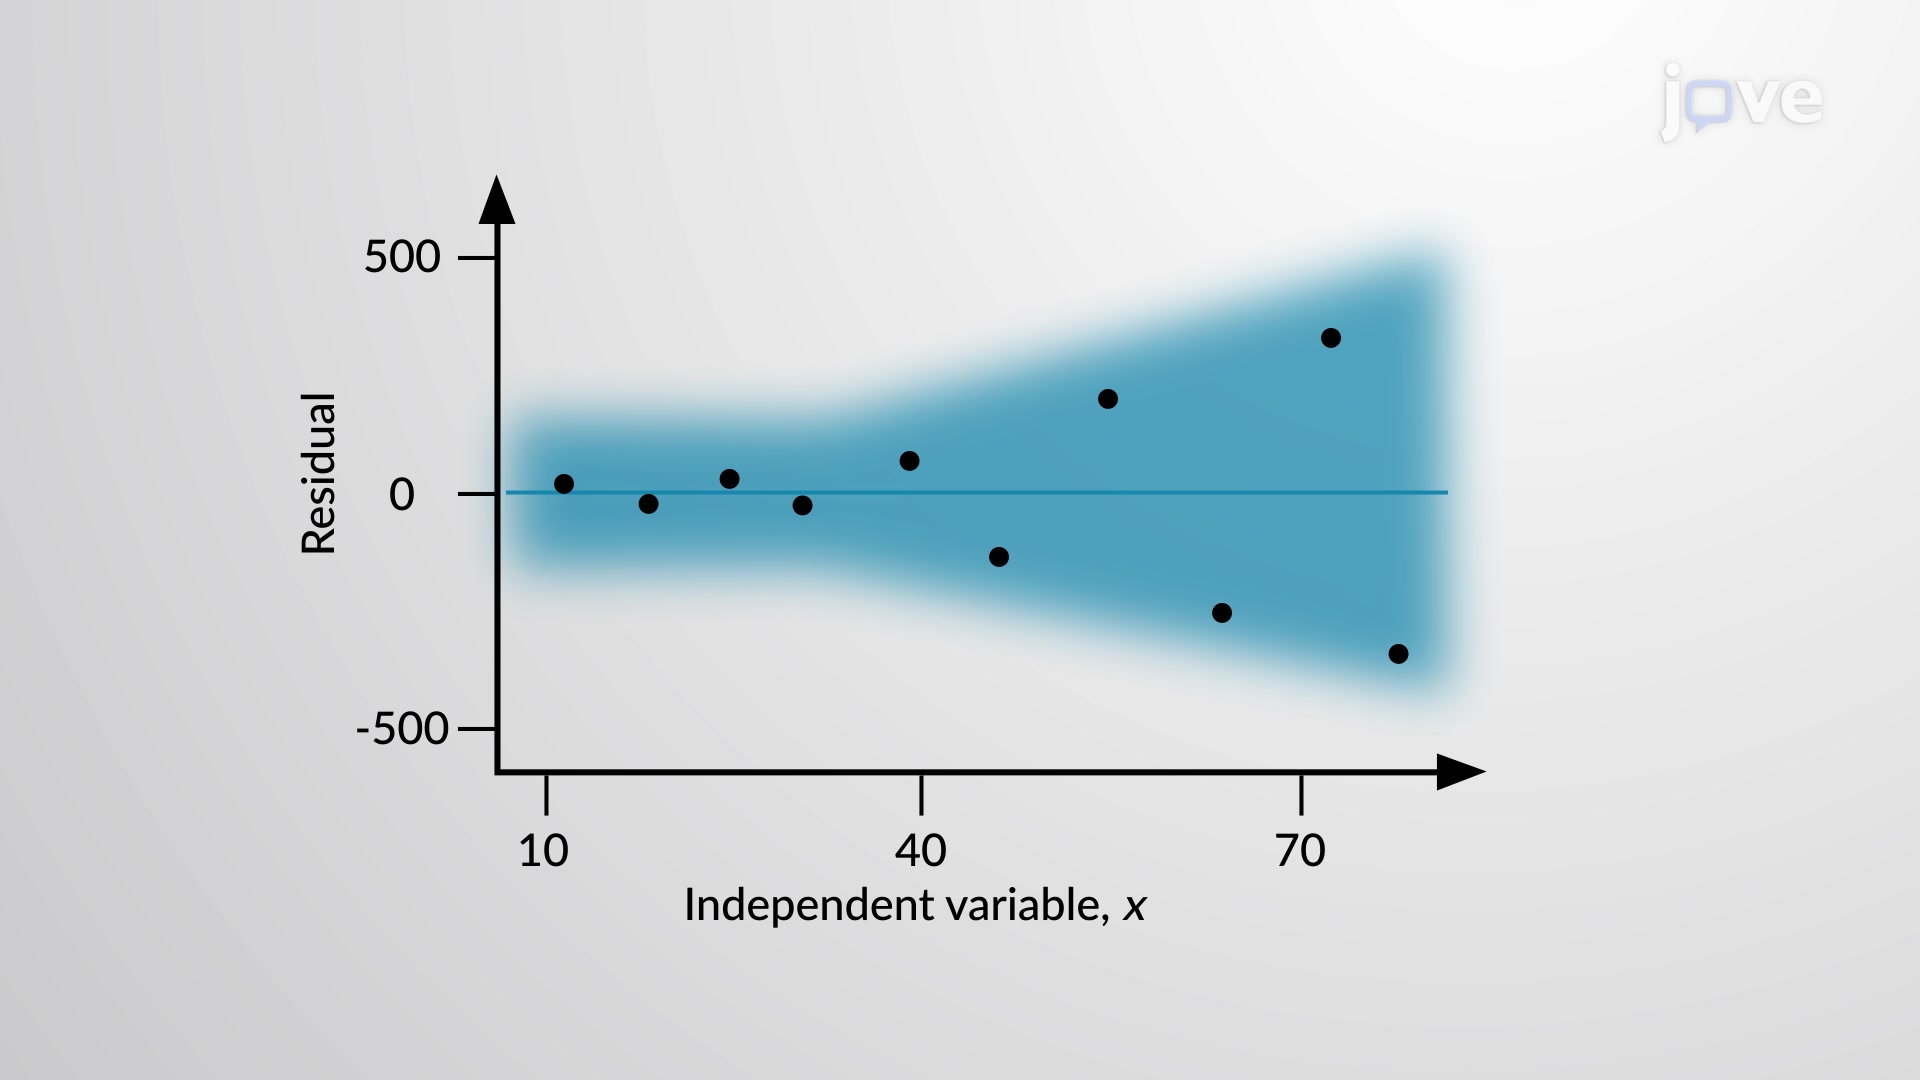
A residual plot is a statistical representation of data used to analyze correlation and regression results. It helps verify the requirements for drawing ...
An important characteristic of any set of data is the variation in the data. In some data sets, the data values are concentrated closely near the mean; in ...
The interval estimate of any variable is known as the prediction interval. It helps decide if a point estimate is dependable. However, the point estimate ...
Multiple regression assesses a linear relationship between one response or dependent variable and two or more independent variables. It has many practical ...
政策
使用条款
隐私
联系我们
向图书馆推荐
JoVE 新闻简报
JoVE Journal
技术专题合集
JoVE Encyclopedia of Experiments
档案
JoVE Core
JoVE Science Education
JoVE Lab Manual
JoVE Quiz
JoVE Playlist
发表
图书馆员
访问权限
关于 JoVE
JoVE Sitemap
版权所属 © 2025 MyJoVE 公司版权所有,本公司不涉及任何医疗业务和医疗服务。