All
Research
Education
연구
교육
Business
솔루션
KR
EN - English
CN - 中文
DE - Deutsch
ES - Español
KR - 한국어
IT - Italiano
FR - Français
PT - Português
TR - Türkçe
JA - 日本語
PL - Polski
RU - Русский
HE - עִברִית
AR - العربية
로그인
Chapter 11
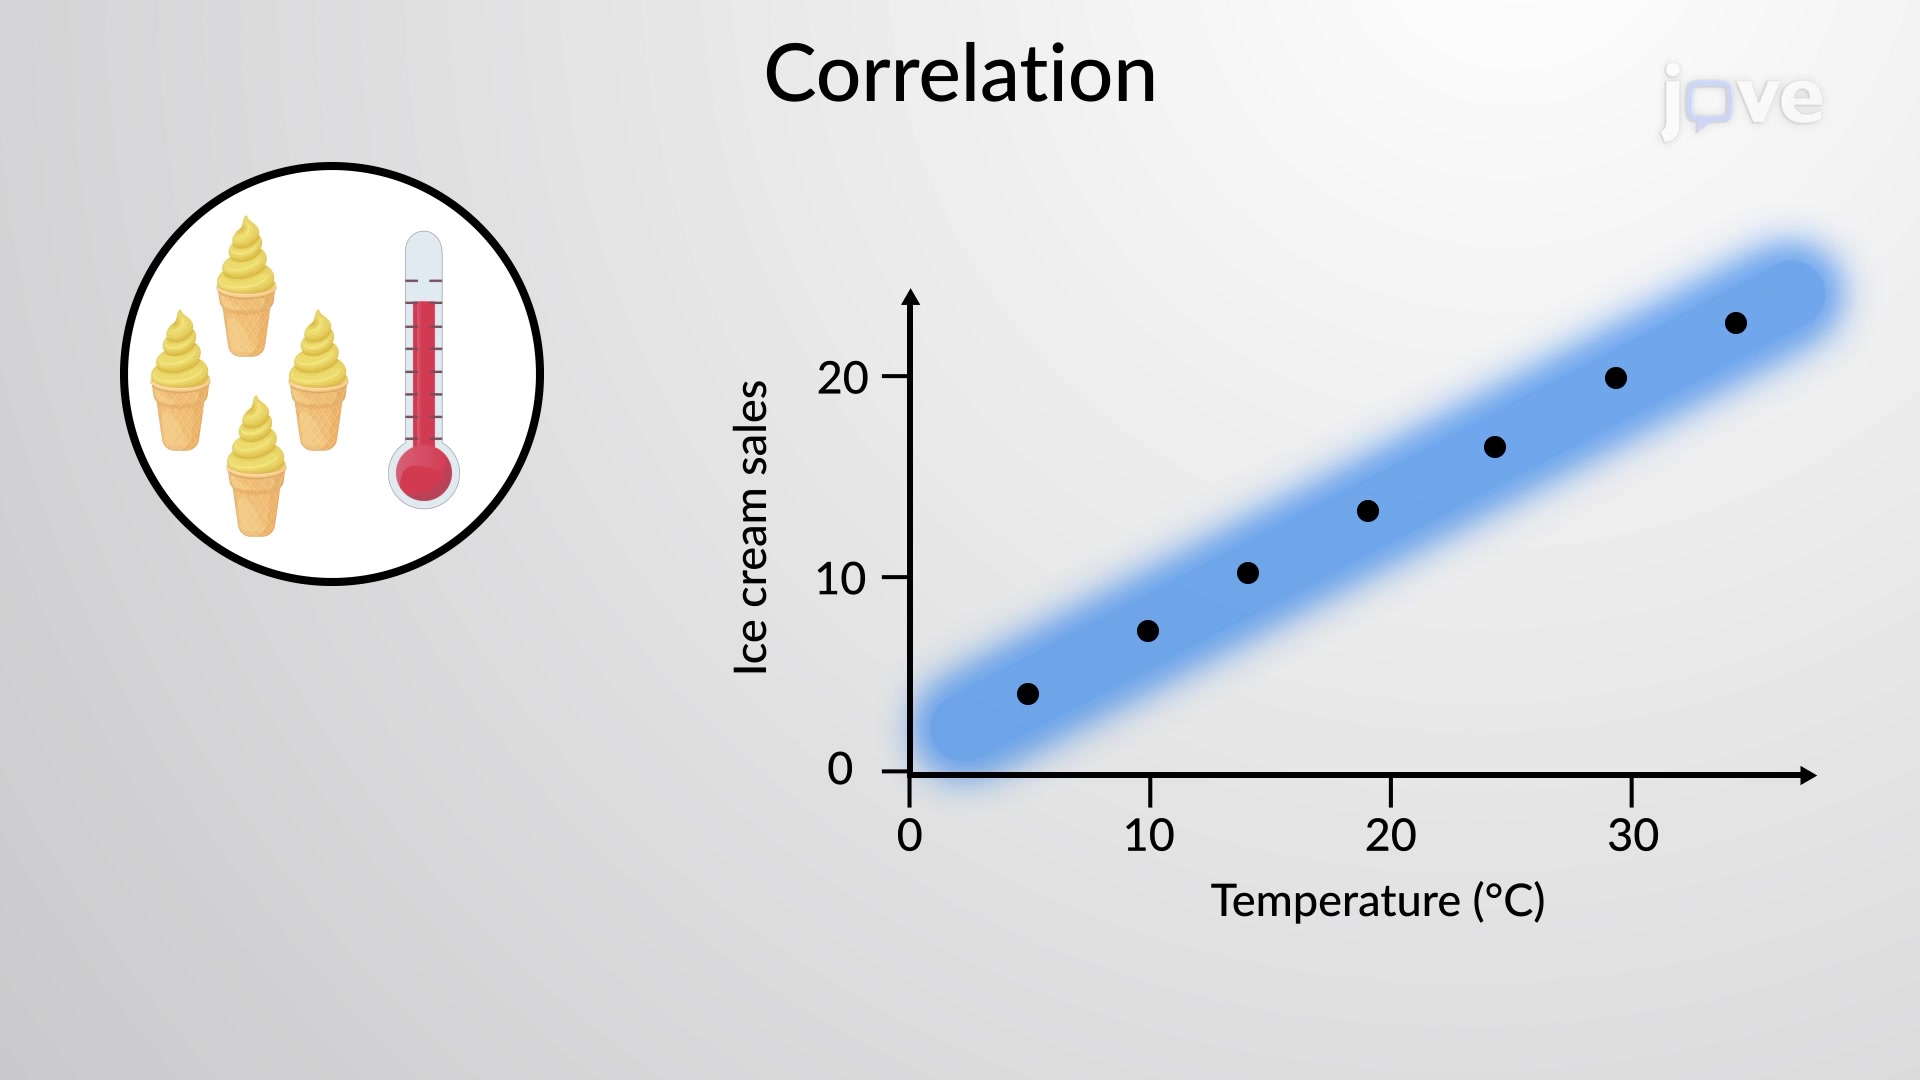
In statistics, two variables are said to be correlated if the values of one variable are associated with the other variable. Depending on the relationship ...
The correlation coefficient, r, developed by Karl Pearson in the early 1900s, is numerical and provides a measure of strength and direction of the linear ...
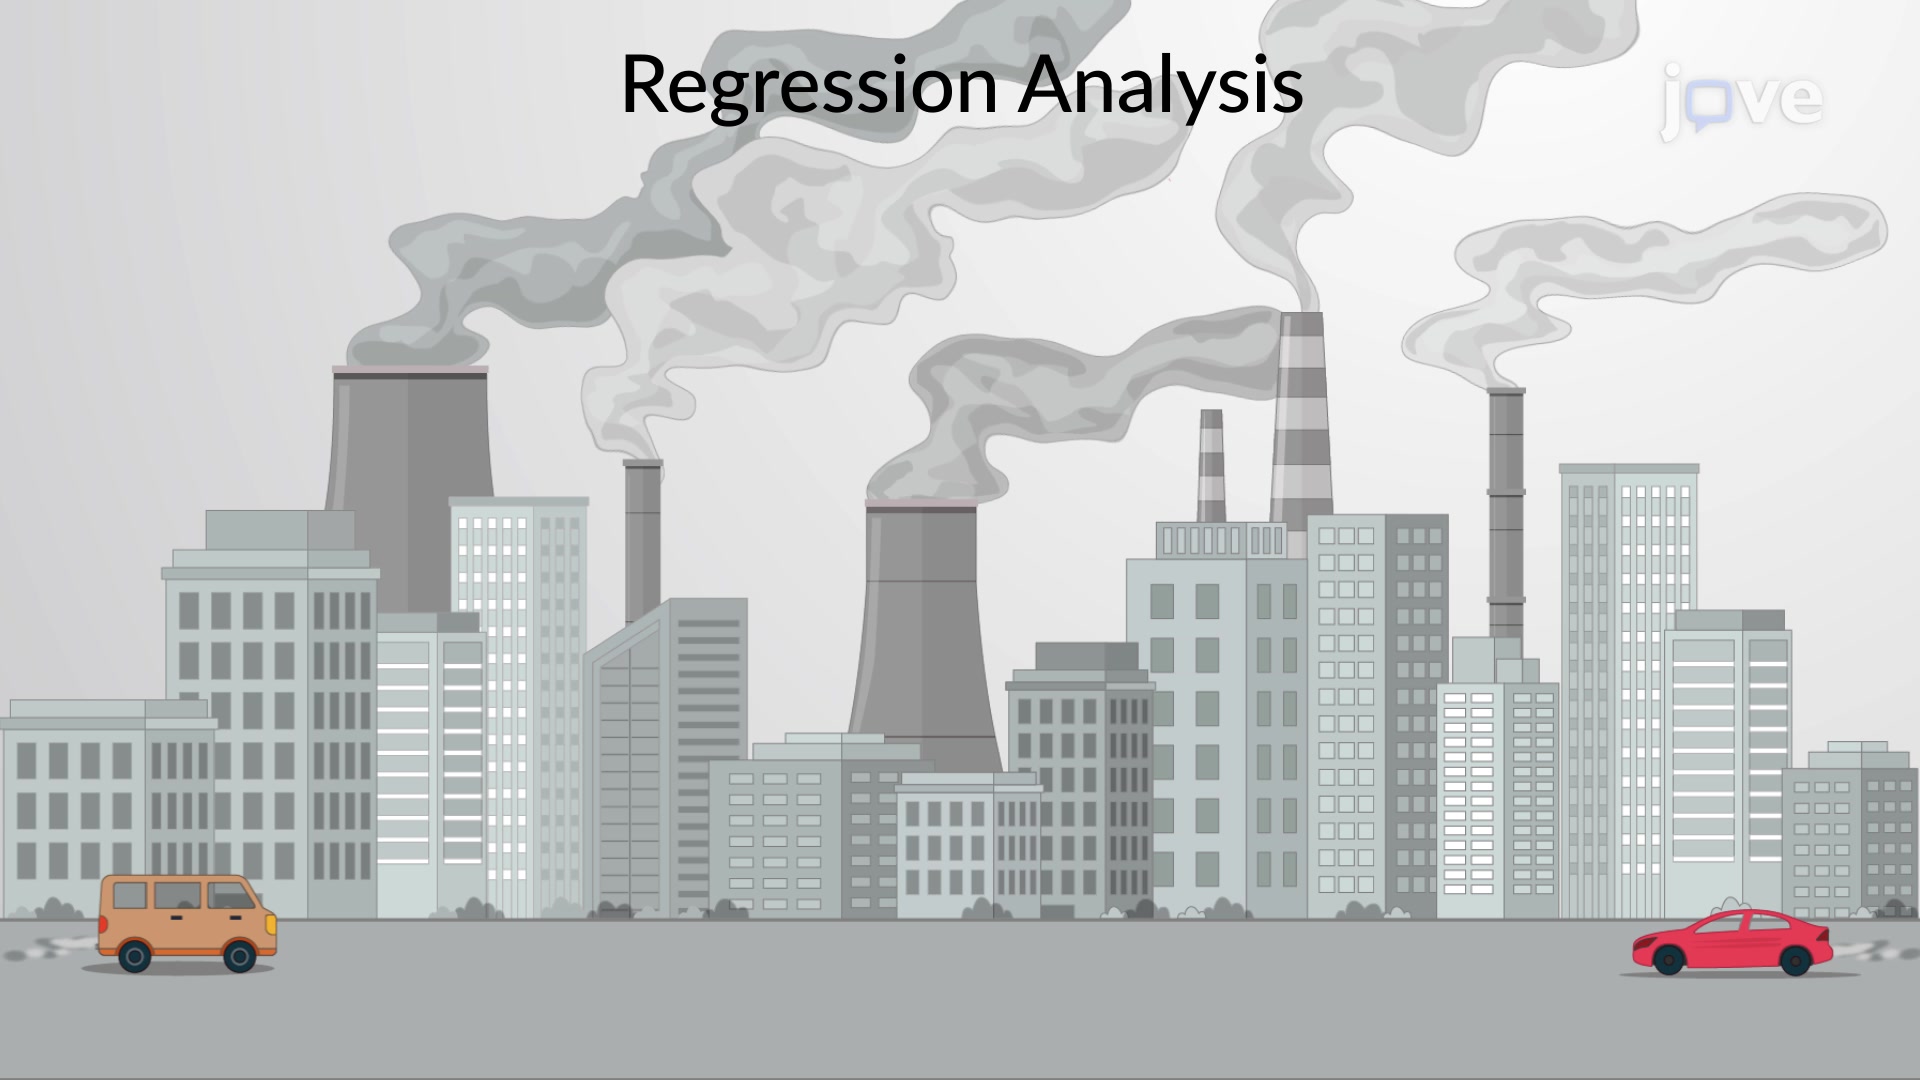
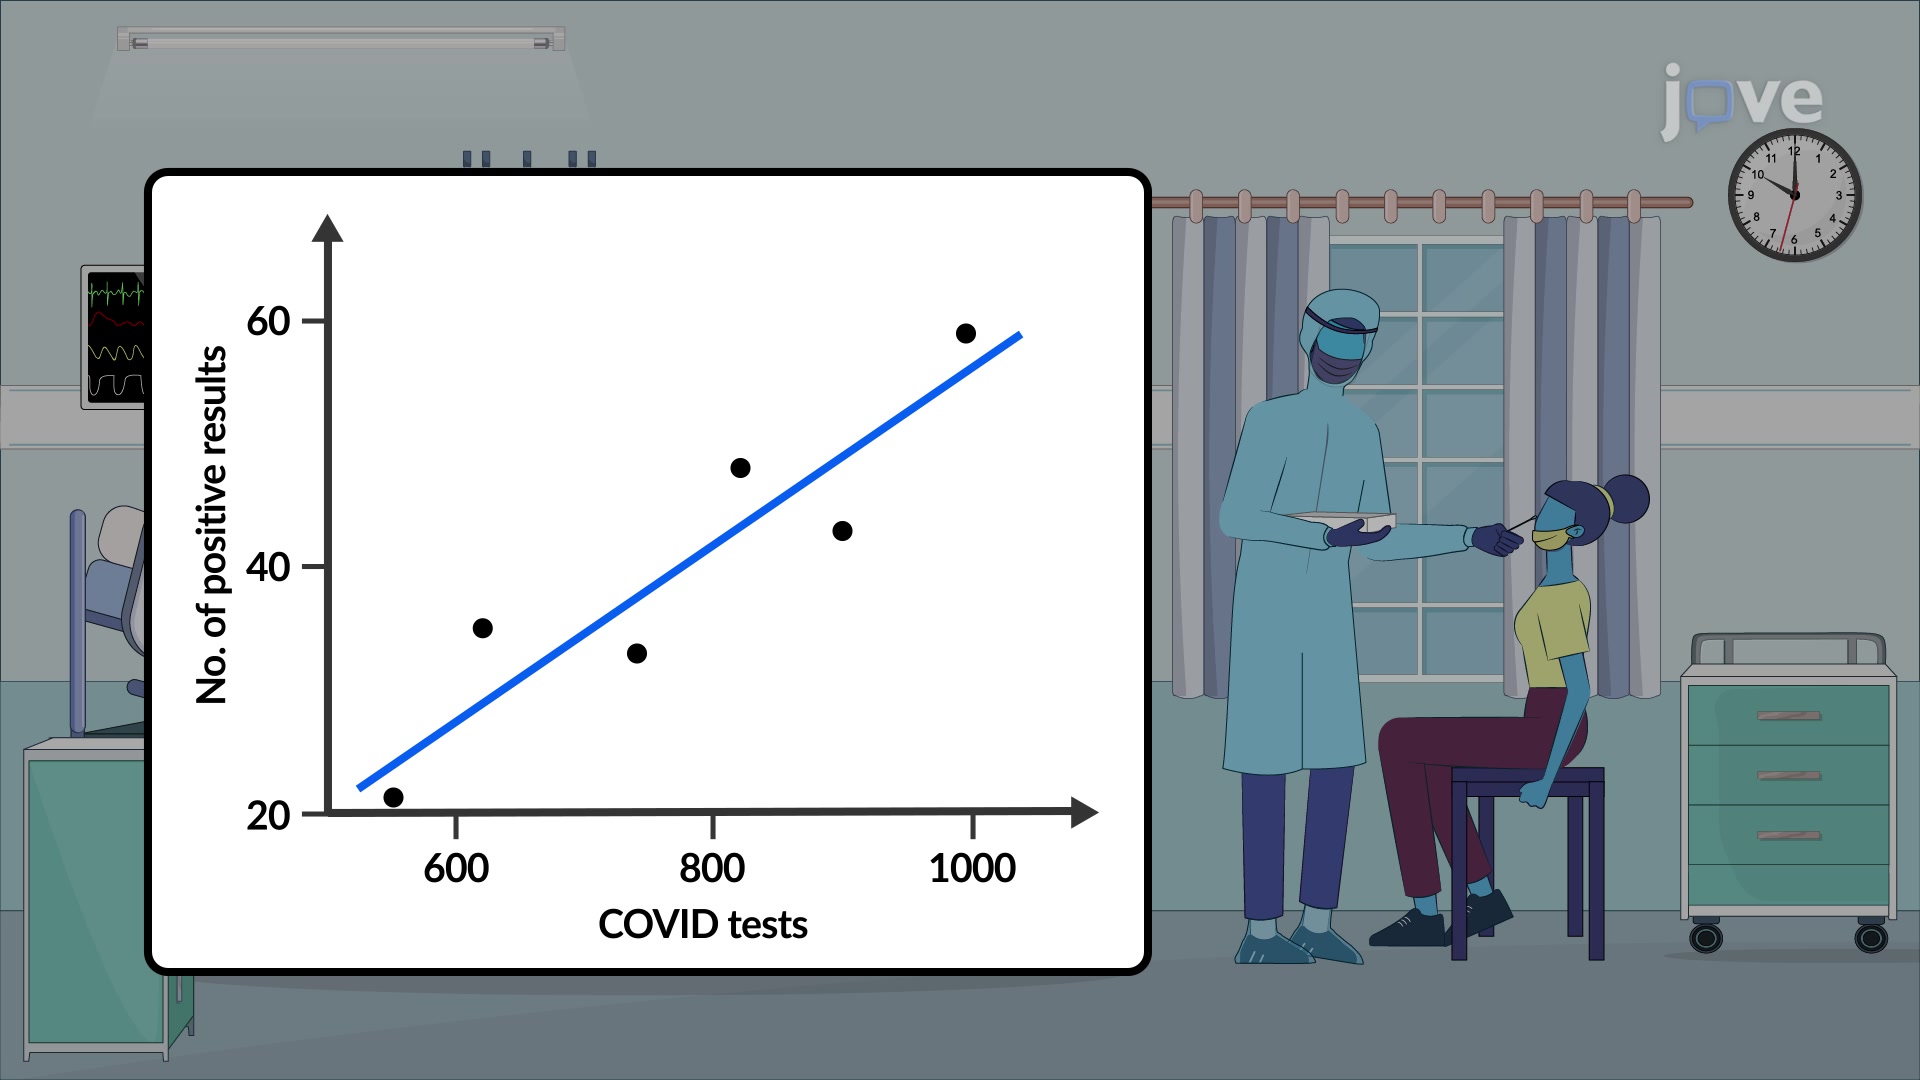
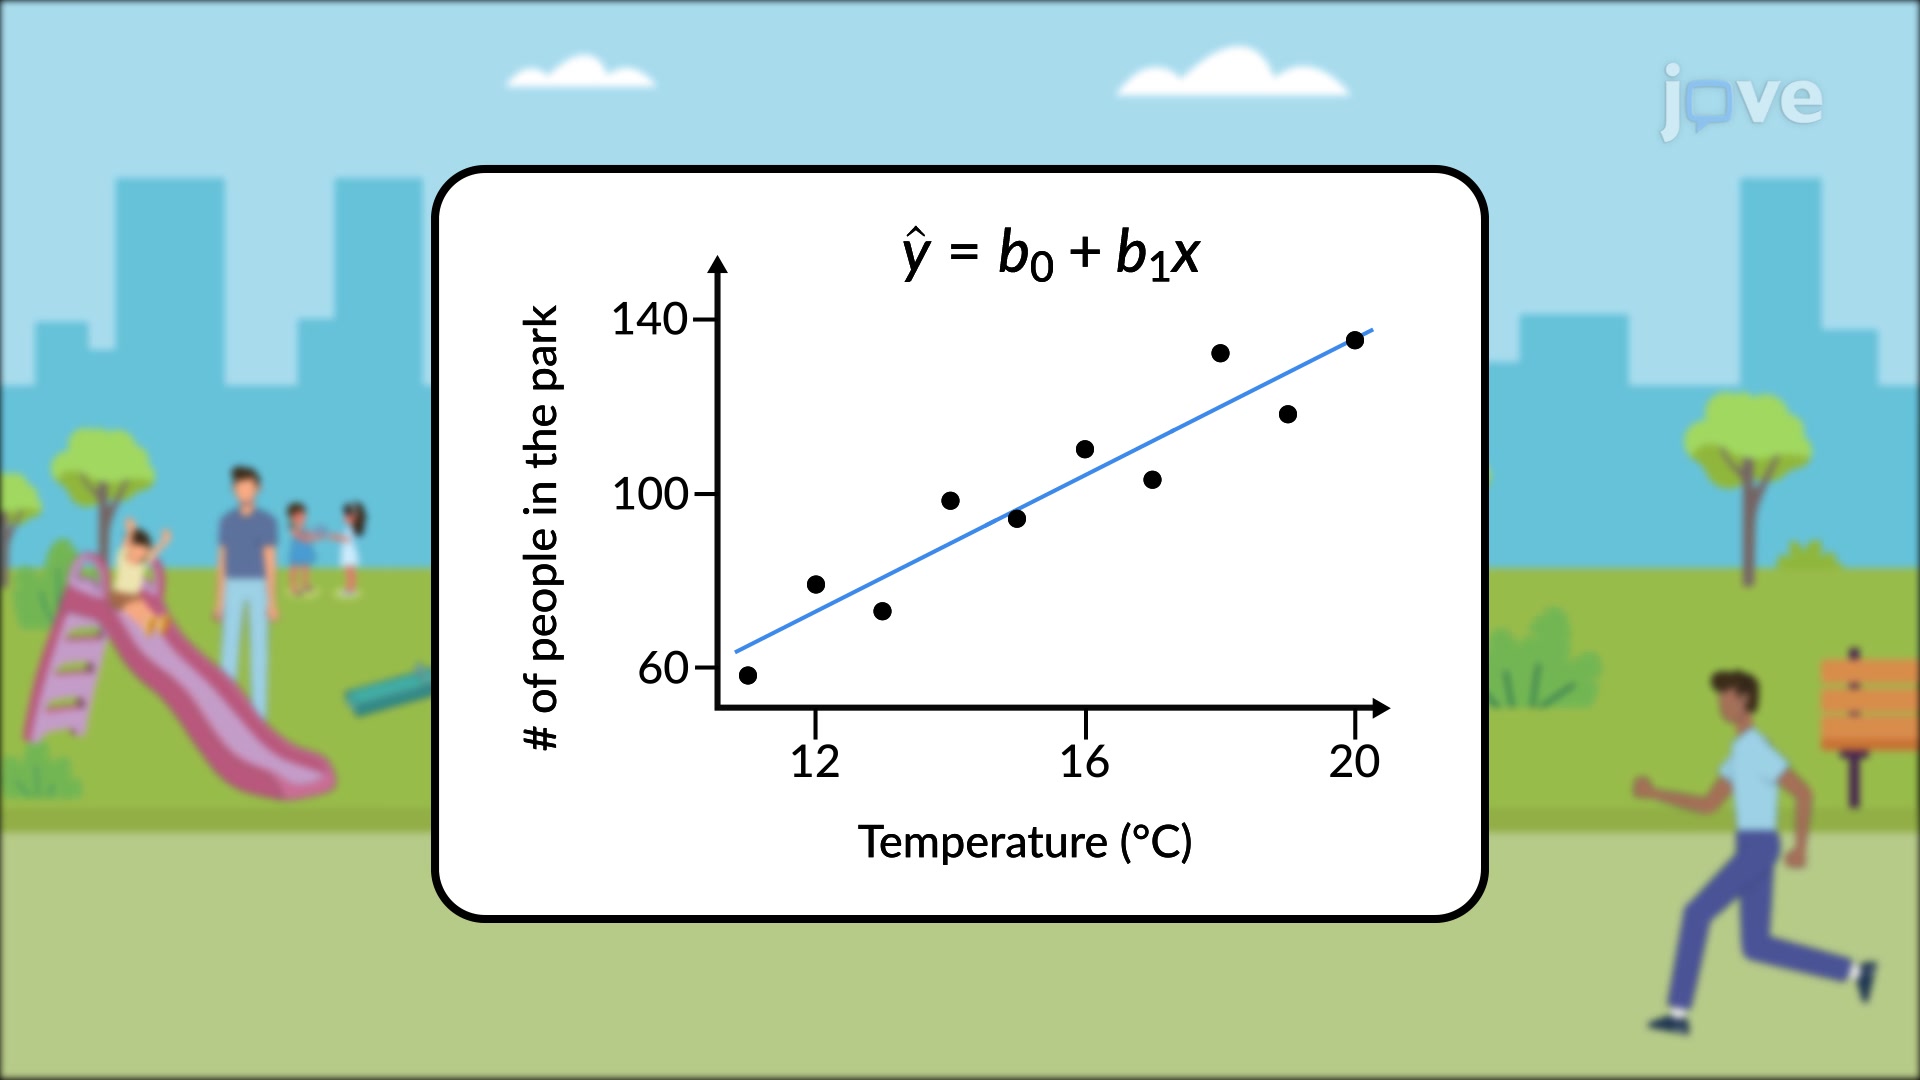
Regression analysis is a statistical tool that describes a mathematical relationship between a dependent variable and one or more independent variables. ...
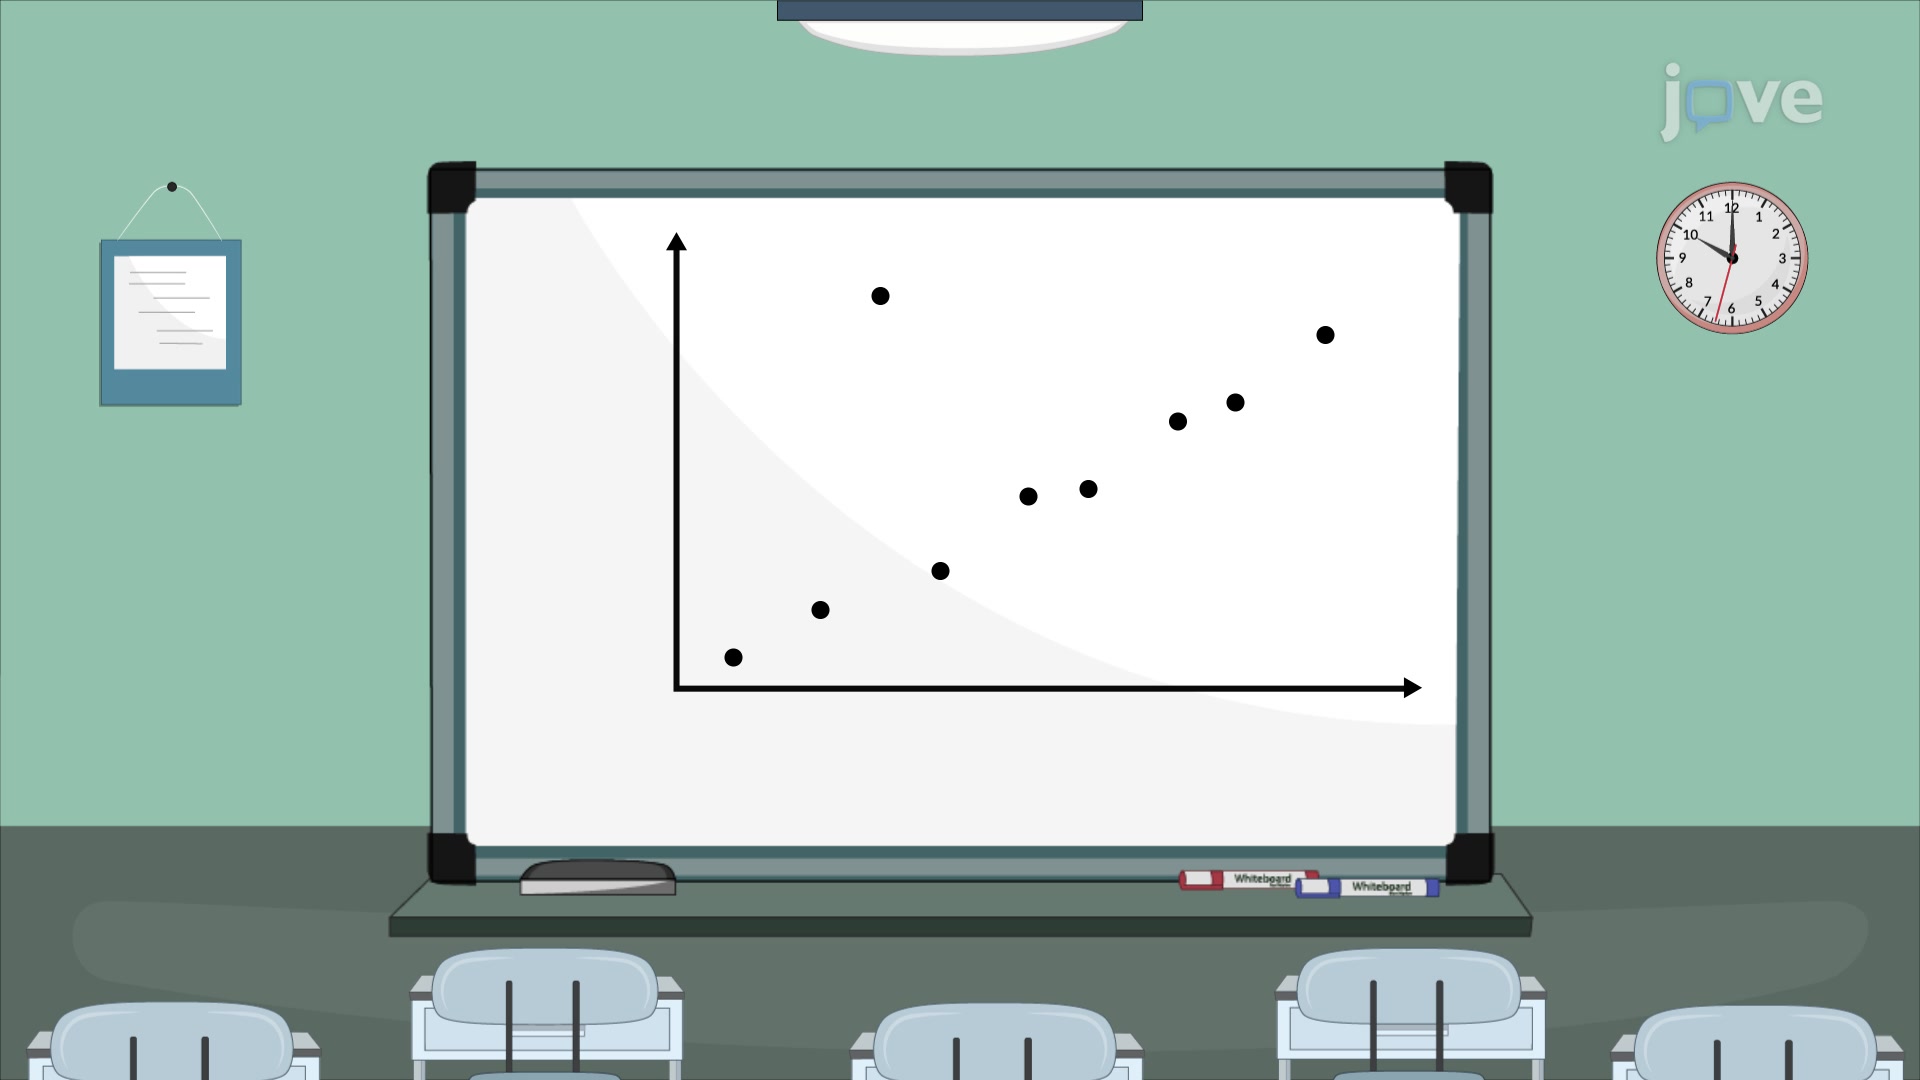
An outlier is an observation of data that does not fit the rest of the data. It is sometimes called an extreme value. When you graph an outlier, it will ...
The vertical distance between the actual value of y and the estimated value of y. In other words, it measures the vertical distance between the actual ...
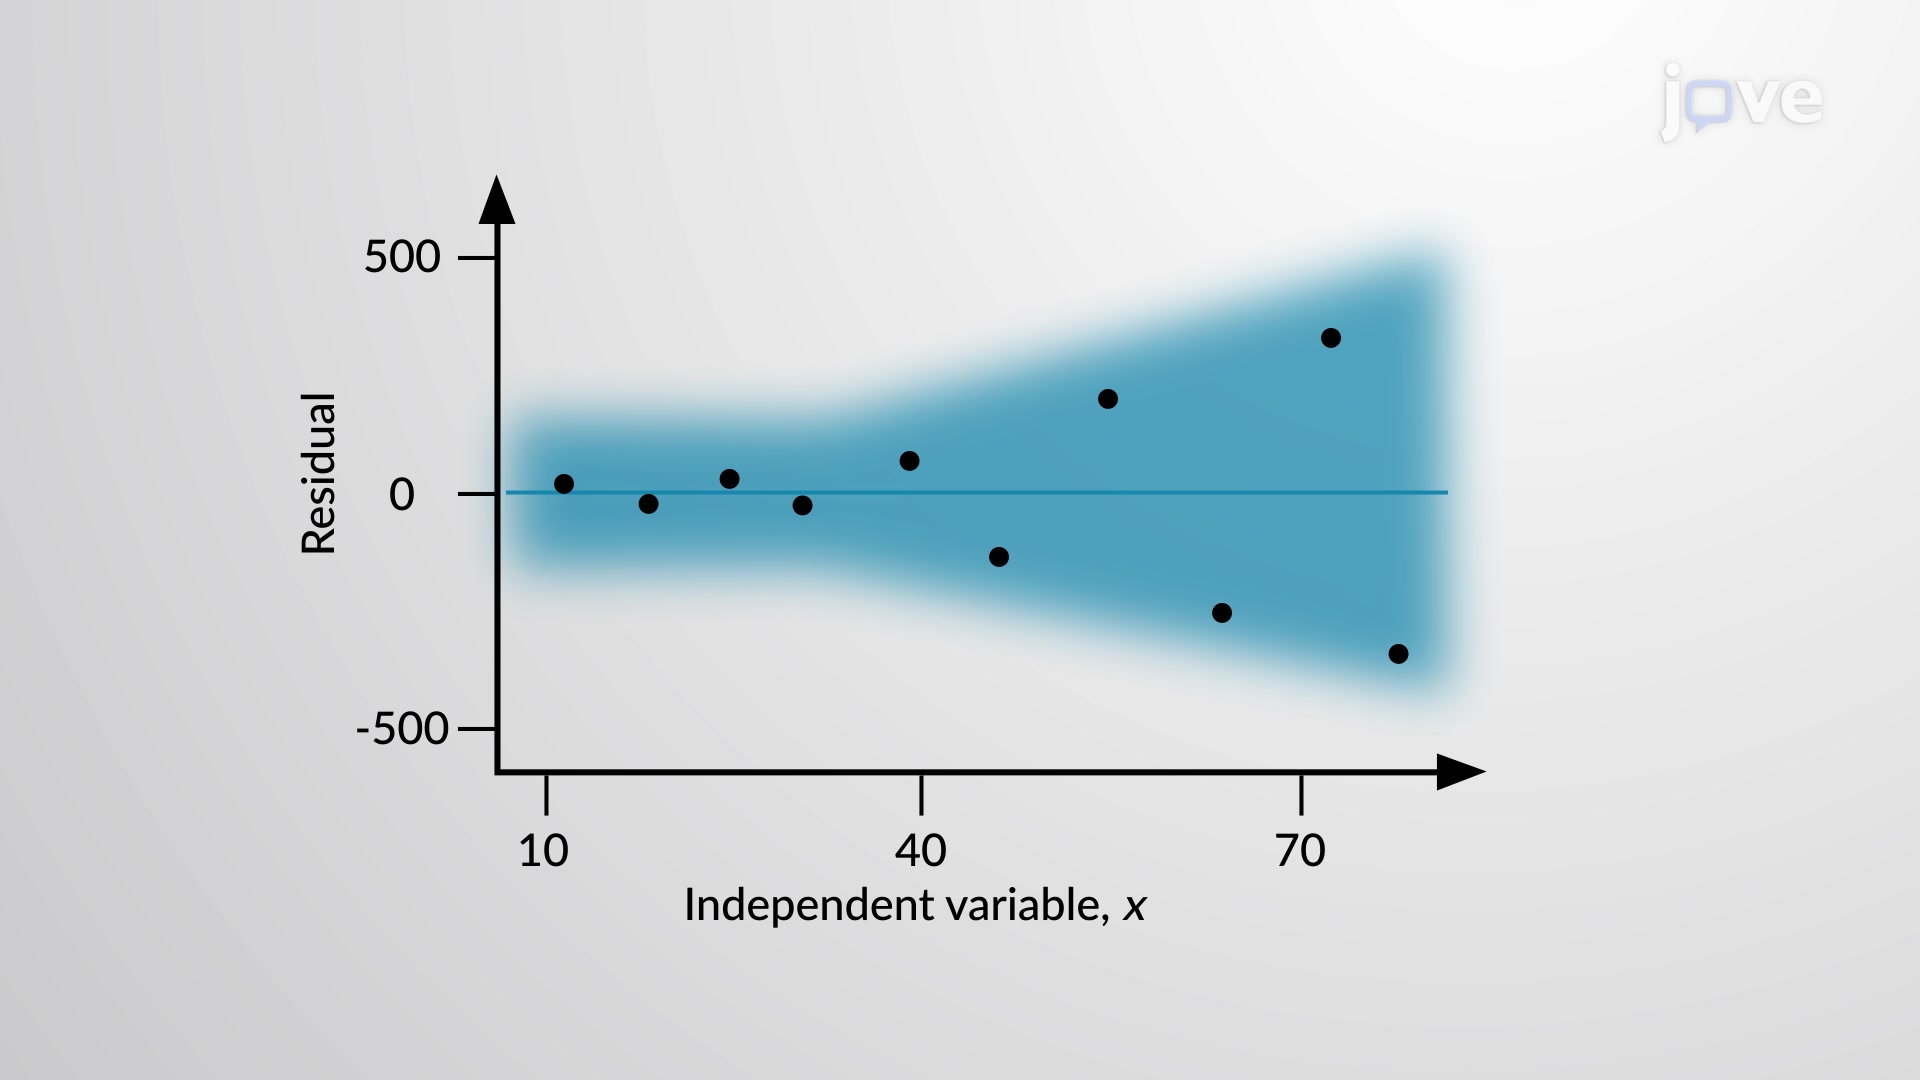
A residual plot is a statistical representation of data used to analyze correlation and regression results. It helps verify the requirements for drawing ...
An important characteristic of any set of data is the variation in the data. In some data sets, the data values are concentrated closely near the mean; in ...
The interval estimate of any variable is known as the prediction interval. It helps decide if a point estimate is dependable. However, the point estimate ...
Multiple regression assesses a linear relationship between one response or dependent variable and two or more independent variables. It has many practical ...
개인 정보 보호
이용 약관
정책
연락처
사서에게 추천하기
JoVE 뉴스레터
JoVE Journal
연구 방법 컬렉션
JoVE Encyclopedia of Experiments
아카이브
JoVE Core
JoVE Science Education
JoVE Lab Manual
JoVE Quiz
JoVE Playlist
저자
사서
액세스
JoVE 소개
JoVE Sitemap
Copyright © 2025 MyJoVE Corporation. 판권 소유