
12.6 : Chi-square Analysis
The chi-square test is a statistical hypothesis test. It is used to check whether there is a significant difference between an expected value and an observed value. In the context of genetics, it enables us to either accept or reject a hypothesis, based on how much the observed values deviate from the expected values.
The chi-square test was developed by Pearson in 1990.
The first step of performing a Chi-square analysis is to establish a null hypothesis, which assumes that there is no real difference between the expected value and the observed value. Any apparent deviations from the expected value are simply due to chance.
The null hypothesis is rejected if the probability value is less than 5%. Consider, for example, a cross in a plant species with yellow and green seeds. All the F1 generation plants had green seeds. Upon self-fertilization among the F1 generation, the expected value in F2 generation is 660 plants with green seeds and 220 plants with yellow seeds. However, the observed value in the F2 generation is 620 plants with green seeds and 260 plants with yellow seeds. Now chi-square is used to find out if the difference between observed and expected values are significant? Can we conclude that the observed inheritance follows Mendelian monohybrid cross?
The chi-squared value is calculated using the formula given below:
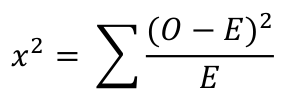
Where O is the observed value and E is the expected value.
The chi-square value is calculated as 9.69. To accept or reject the hypothesis, the degrees of freedom are required. The degree of freedom is the number of classes minus one. It refers to the values involved in the calculation that vary.
In the above example, two different colors of seeds are observed. So the degree of freedom will be 2 - 1 = 1. To check if the result is statistically significant, the calculated chi-square value and the degree of freedom are analyzed on the probability chart under α=0.05. The value from the table is 3.841. Since the chi-squared value 9.69 is greater than 3.841, we have statistically significant evidence to reject the null hypothesis. In other words, the differences observed between the experimental and expected values is due to chance alone.
来自章节 12:

Now Playing
12.6 : Chi-square Analysis
Mendelian Genetics
36.2K Views

12.1 : Punnett 方块
Mendelian Genetics
12.0K Views

12.2 : 单杂交杂交
Mendelian Genetics
7.8K Views

12.3 : 双杂交杂交
Mendelian Genetics
5.5K Views

12.4 : 三杂交杂交
Mendelian Genetics
22.8K Views

12.5 : 独立分类法则
Mendelian Genetics
5.5K Views

12.7 : 系谱分析
Mendelian Genetics
12.4K Views

12.8 : 多个等位基因性状
Mendelian Genetics
10.7K Views

12.9 : 不完全支配
Mendelian Genetics
20.6K Views

12.10 : 致命等位基因
Mendelian Genetics
13.9K Views

12.11 : 多基因性状
Mendelian Genetics
6.5K Views

12.12 : 背景和环境影响表型
Mendelian Genetics
6.4K Views

12.13 : X 和 Y 染色体
Mendelian Genetics
20.6K Views

12.14 : Y 染色体决定男性
Mendelian Genetics
6.4K Views

12.15 : X 染色体与常染色体的比率
Mendelian Genetics
8.4K Views
See More
版权所属 © 2025 MyJoVE 公司版权所有,本公司不涉及任何医疗业务和医疗服务。