The chi-square test is a statistical hypothesis test. It is used to check whether there is a significant difference between an expected value and an observed value. In the context of genetics, it enables us to either accept or reject a hypothesis, based on how much the observed values deviate from the expected values.
The chi-square test was developed by Pearson in 1990.
The first step of performing a Chi-square analysis is to establish a null hypothesis, which assumes that there is no real difference between the expected value and the observed value. Any apparent deviations from the expected value are simply due to chance.
The null hypothesis is rejected if the probability value is less than 5%. Consider, for example, a cross in a plant species with yellow and green seeds. All the F1 generation plants had green seeds. Upon self-fertilization among the F1 generation, the expected value in F2 generation is 660 plants with green seeds and 220 plants with yellow seeds. However, the observed value in the F2 generation is 620 plants with green seeds and 260 plants with yellow seeds. Now chi-square is used to find out if the difference between observed and expected values are significant? Can we conclude that the observed inheritance follows Mendelian monohybrid cross?
The chi-squared value is calculated using the formula given below:
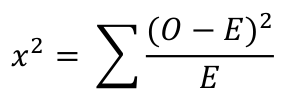
Where O is the observed value and E is the expected value.
The chi-square value is calculated as 9.69. To accept or reject the hypothesis, the degrees of freedom are required. The degree of freedom is the number of classes minus one. It refers to the values involved in the calculation that vary.
In the above example, two different colors of seeds are observed. So the degree of freedom will be 2 - 1 = 1. To check if the result is statistically significant, the calculated chi-square value and the degree of freedom are analyzed on the probability chart under α=0.05. The value from the table is 3.841. Since the chi-squared value 9.69 is greater than 3.841, we have statistically significant evidence to reject the null hypothesis. In other words, the differences observed between the experimental and expected values is due to chance alone.
Dal capitolo 12:

Now Playing
12.6 : Chi-square Analysis
Genetica mendeliana
33.0K Visualizzazioni

12.1 : Quadrati di Punnet
Genetica mendeliana
11.6K Visualizzazioni

12.2 : Incroci monoibridi
Genetica mendeliana
7.4K Visualizzazioni

12.3 : Incroci diibridi
Genetica mendeliana
5.2K Visualizzazioni

12.4 : Incroci triibridi
Genetica mendeliana
22.4K Visualizzazioni

12.5 : Legge dell'assortimento indipendente
Genetica mendeliana
5.2K Visualizzazioni

12.7 : Analisi del pedigree
Genetica mendeliana
11.8K Visualizzazioni

12.8 : Tratti allelici multipli
Genetica mendeliana
8.3K Visualizzazioni

12.9 : Dominanza incompleta
Genetica mendeliana
18.5K Visualizzazioni

12.10 : Alleli letali
Genetica mendeliana
11.6K Visualizzazioni

12.11 : Tratti poligenici
Genetica mendeliana
4.1K Visualizzazioni

12.12 : Circostanze e ambiente influenzano il fenotipo
Genetica mendeliana
6.4K Visualizzazioni

12.13 : Cromosomi X e Y
Genetica mendeliana
17.5K Visualizzazioni

12.14 : Il cromosoma Y determina il sesso maschile
Genetica mendeliana
6.3K Visualizzazioni

12.15 : Il rapporto tra il cromosoma X e gli autosomi
Genetica mendeliana
8.3K Visualizzazioni
See More
Personale delle biblioteche
Copyright © 2025 MyJoVE Corporation. Tutti i diritti riservati