
18.5 : Cell Potential and Free Energy
Thermodynamics of a Redox Reaction
Thermodynamics is the branch of physics dealing with the relationship between heat and other forms of energy. In an electrochemical cell, chemical energy is converted into electrical energy.
Thus, a link can be predicted between cell potential, free energy change, and the equilibrium constant for the reaction. Cell potential can also be measured as the oxidant or the reducing strength, and similar acid-base strength measures are reflected in equilibrium constants.
Gibbsâ Free Energy and the Relationship Between E°cell  and ÎG°
The Gibbs free energy is a quantity used to calculate the maximum amount of reversible work performed by a thermodynamic system maintained at constant temperature and pressure conditions. It is denoted by the symbol G, and its change is represented as âG. The standard free energy change of a system, ÎG°, is defined as the maximum work performed by a system, wmax. For a redox reaction occurring within a galvanic cell under standard conditions, all the work done is associated with electron transferring from the reducing agent to the oxidizing agent, welec. Thus,

However, any work associated with electron transfer depends on the charge transferred in Coulombs as well as the cell potential:

where n = the number of moles of transferred electrons, F is Faradayâs constant, which represents the coulombic charge of 1 mole of electrons, and E°cell is the standard cell potential. The relation between ÎG° and ÎE°cell confirms the sign conventions and the criteria for reaction spontaneity. Spontaneous redox reactions have positive potential and negative values of free energy.
Relationship between E°cell and K
The standard free energy change ÎG° is related to the equilibrium constant K of a redox reaction as follows:

Combining a previously derived relation between ÎG° and K and the equation relating to ÎG° and E°cell yields the following:

Therefore,

This equation indicates that redox reactions with large or positive standard cell potentials will proceed towards completion, reaching equilibrium when most reactants have been converted to product.
Nonspontaneous reactions or reactions proceeding in reverse directions exhibit negative cell potentials, positive free energy values, and an equilibrium constant of less than one. An equilibrium constant of one and cell potential and free energy values equal to zero is associated with a reaction under equilibrium at standard conditions.
The relationship between the cell potential under standard conditions and the thermodynamic constants ÎG° and K can be explained by the figure given below:
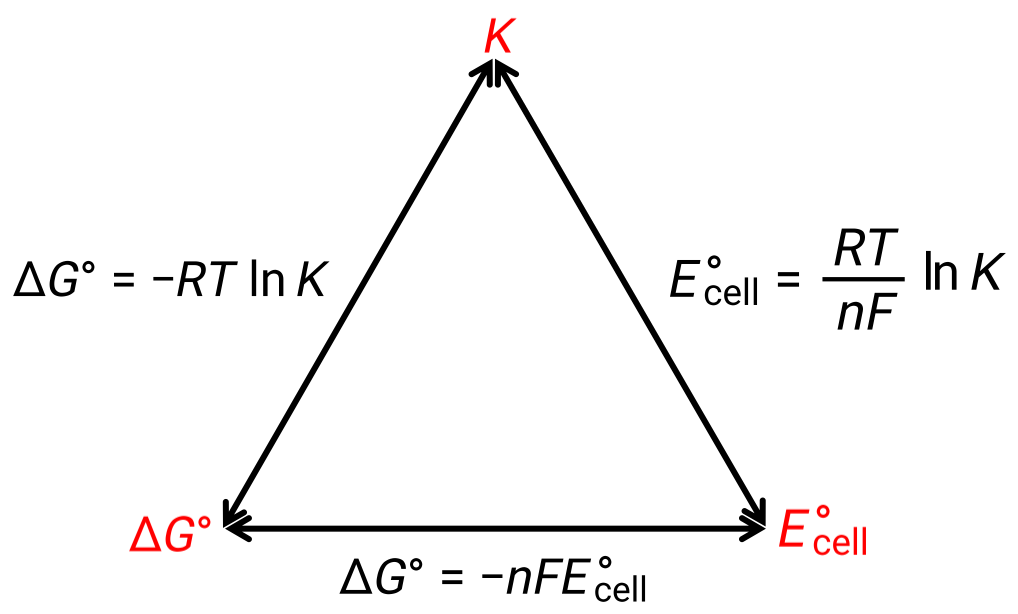
Figure 1: Graphic depicting the relation between three important thermodynamic properties.
This text is adapted from Openstax,Chemistry 2e, Section 17.4: Potential, Free Energy, and Equilibrium.

Copyright © 2025 MyJoVE Corporation. Alle Rechte vorbehalten