All
Research
Education
Business
Solutions
EN
EN - English
CN - 中文
DE - Deutsch
ES - Español
KR - 한국어
IT - Italiano
FR - Français
PT - Português
TR - Türkçe
JA - 日本語
PL - Polski
RU - Русский
HE - עִברִית
AR - العربية
Sign In
Chapter 16
Statistical software is pivotal in research and clinical trials for data analysis and deriving insights. These tools ensure accurate data processing and ...
Microsoft Excel is a statistical tool widely used for data analysis and interpretation. Excel simplifies data analysis by offering a spreadsheet format ...
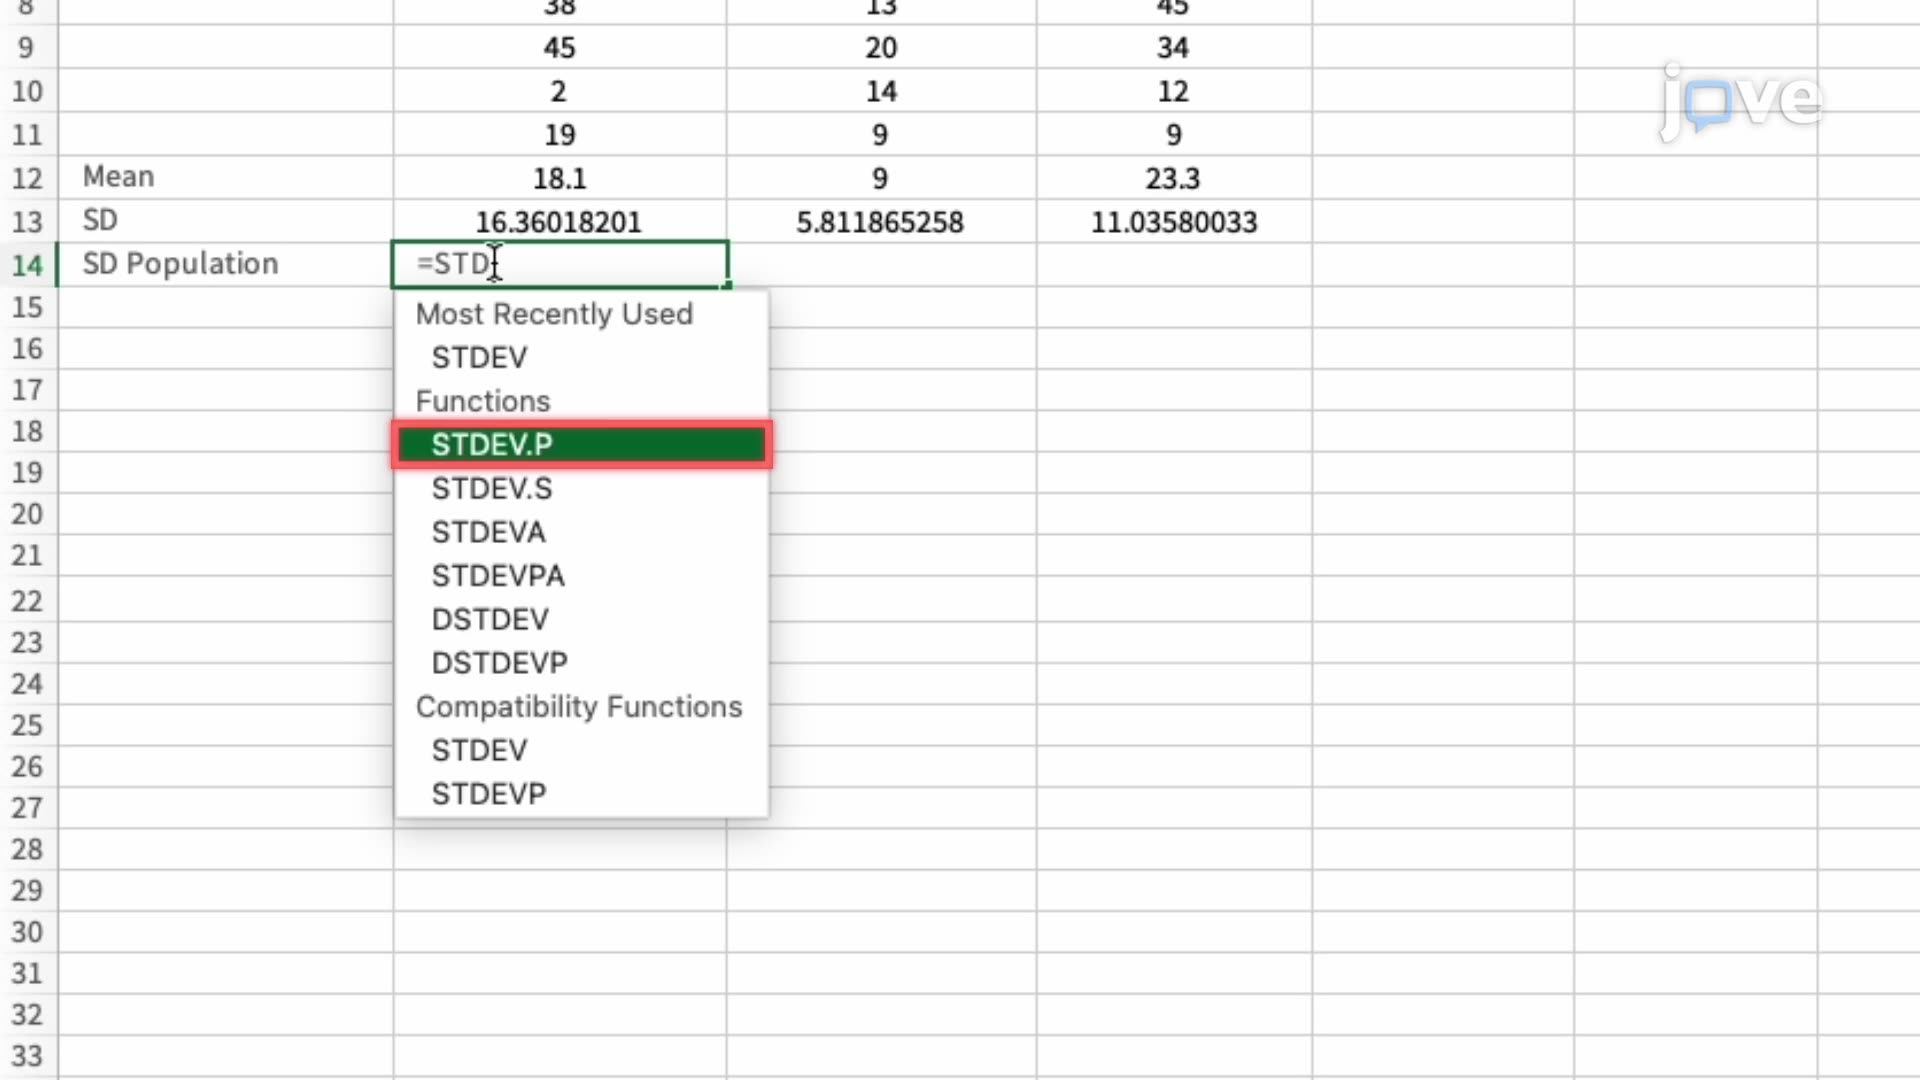
Microsoft Excel facilitates simple and complex statistical data analysis with various functions. A simple function like AVERAGE calculates the arithmetic ...
The Statistical Package for the Social Sciences, or SPSS, is a data analysis software initially designed for social sciences. SPSS's key features ...
R is an open-source software environment for statistical computing and graphics widely used in biostatistics, econometrics, and social sciences. The R ...
The Statistical Analysis System, or SAS, was developed by the SAS Institute in the 1970s for data management, analysis, and visualization. It is utilized ...
MATLAB, short for Matrix Laboratory, is a programming language and computing platform created by MathWorks. It has various industrial applications, ...
Minitab, developed at Pennsylvania State University in 1972, is renowned for its statistical analysis prowess. It simplifies data visualization and ...
Econometric Views or EViews is a robust statistical tool for econometric analysis. It is equipped for time series analysis, forecasting, and model ...
Statgraphics, initially developed at Princeton University in 1980, is a statistical software suite with extensive data analysis capabilities. The suite ...
Consider the following three hypothetical datasets plotted in Microsoft Excel. Now, three measures of the central tendency — mean, median, and mode ...
Consider three hypothetical datasets organized in Microsoft Excel. Below each column of the data, calculate the arithmetic mean using the function AVERAGE ...
Consider the following three datasets. Now, select them together, select the Insert option, select Insert Statistic Chart, and then Box and Whisker. In a ...
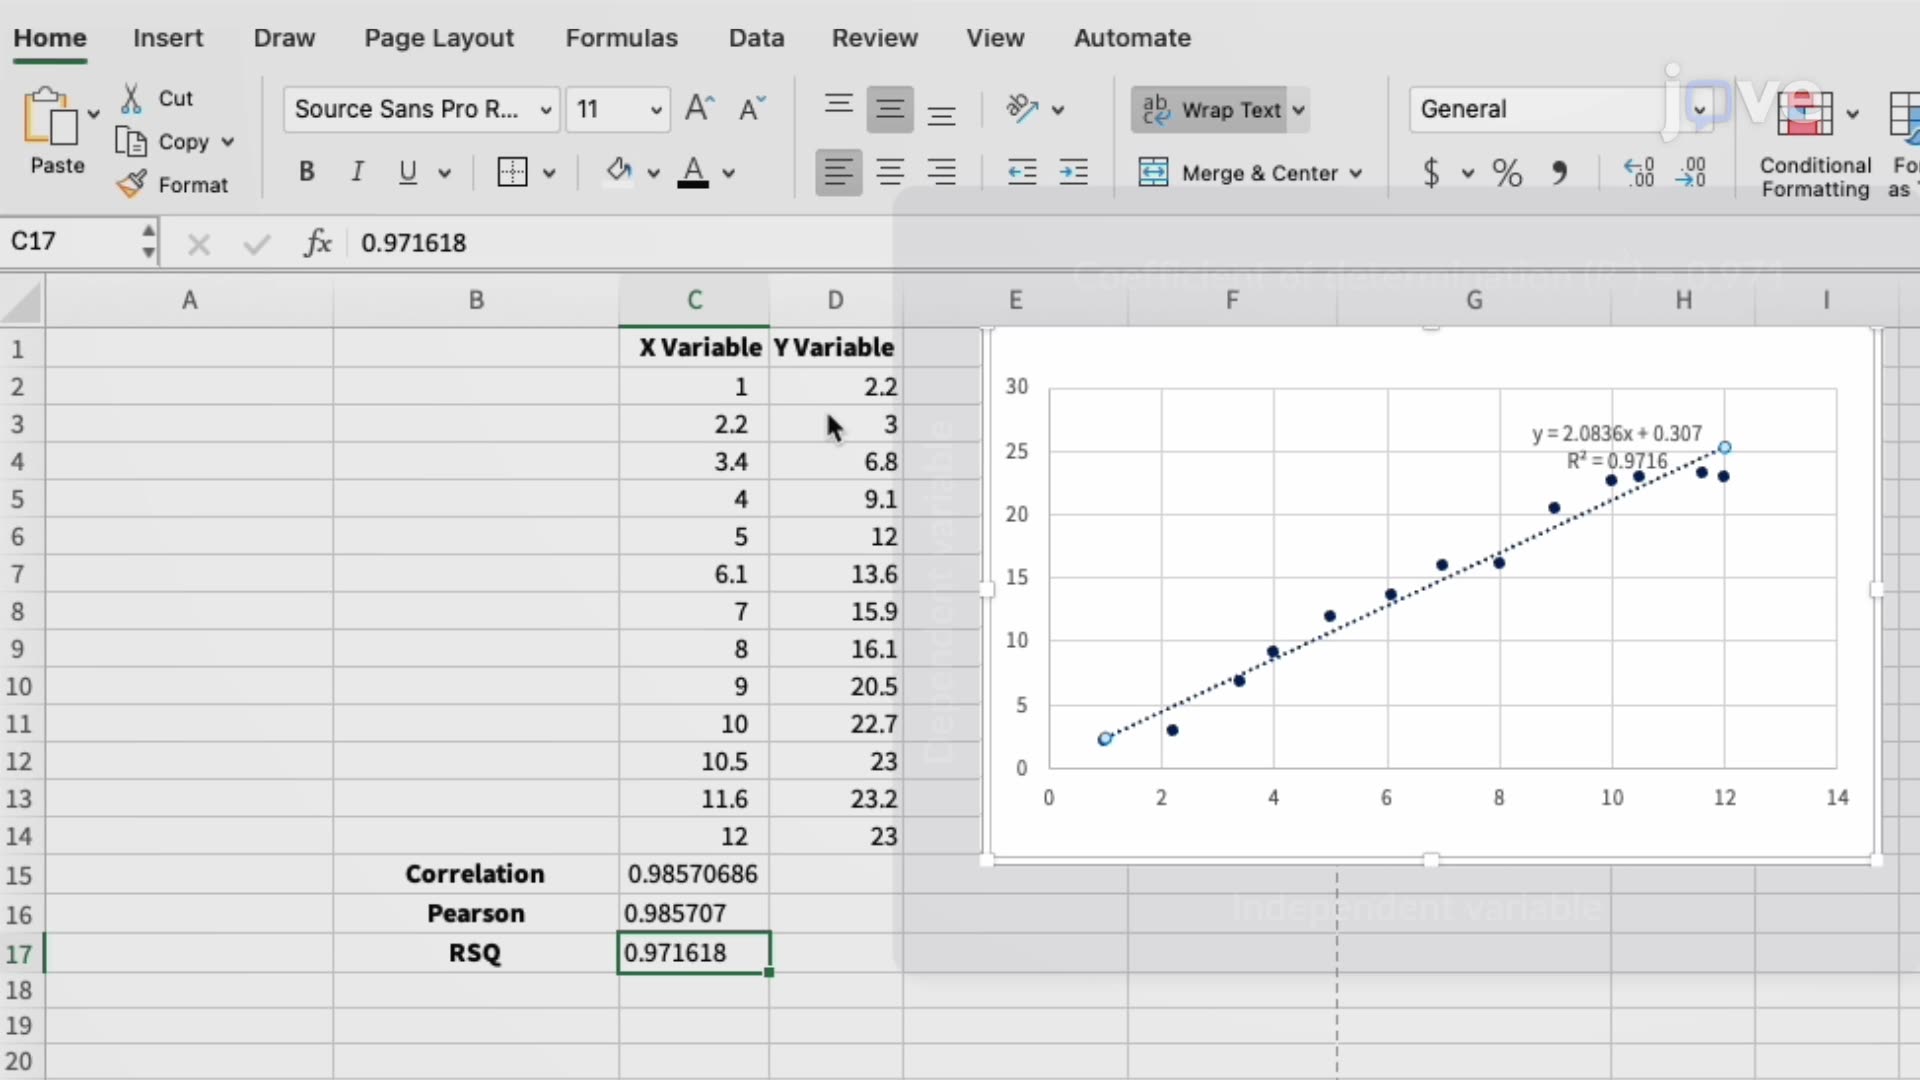
The correlation is a relationship between two variables. Consider the following hypothetical data organized in Microsoft Excel. To perform univariate ...
Regression analysis is critical in statistics. Consider the data as shown here in the Microsoft Excel worksheet. The scatter plot of variables has a ...
The Student's t test determines if the two groups' means are significantly different. Consider the dataset organized in the Microsoft Excel ...
Privacy
Terms of Use
Policies
Contact Us
Recommend to library
JoVE NEWSLETTERS
JoVE Journal
Methods Collections
JoVE Encyclopedia of Experiments
Archive
JoVE Core
JoVE Science Education
JoVE Lab Manual
JoVE Quiz
JoVE Playlist
Authors
Librarians
Access
ABOUT JoVE
JoVE Sitemap
Copyright © 2025 MyJoVE Corporation. All rights reserved