このコンテンツを視聴するには、JoVE 購読が必要です。 サインイン又は無料トライアルを申し込む。
Method Article
動き定義形状による視野視力測定のための運動視力試験
Erratum Notice
要約
ここでは、低視力および健康な人の中枢および周辺視覚処理の評価を可能にする新しいモーションベースの視力検査と、MRIプロトコルと互換性のある周辺視野を制限するゴーグルについて説明します。この方法は、視覚系の機能障害と機能障害に対する包括的な視力評価を提供します。
要約
標準的な視力測定は、静止した刺激に最も敏感な視覚系の領域によって処理され、静止した刺激(スネレンチャート)、垂直線(バーニア視力)、または耳障りなチャートのいずれかの静止刺激に依存し、視野の中央部分から視覚入力を受け取ります。ここでは、動き刺激に感受性があり、周辺視野からの入力も受信する視覚領域によって処理されるランダムドットキネマトグラム(RDK)内のドットの動きによって定義される単純な形状の識別に基づく視力測定が提案されています。運動視力テストでは、参加者は円と楕円を区別するよう求められ、RDKから構築され、コヒーレンス、方向、またはドットの速度のいずれかによって背景のRDKから分離された一致する表面を持つ。視力測定は楕円検出に基づいており、正しい応答ごとに、視力のしきい値に達するまでより循環します。運動視力検査は、負のコントラスト(白い背景に黒い点)または正のコントラスト(黒い背景に白い点)で提示できます。モーション定義の形状は、8 視覚度以内の中央に配置され、RDK 背景で囲まれています。中央で測定された視力に対する視界の影響をテストするために、中央に配置された穴のある不透明なゴーグルを使用して、視野を10度に機械的に狭めることが提案されています。この簡単で複製可能なナローイングシステムは、MRIプロトコルに適しており、周辺視覚入力の機能をさらに調査することができます。ここでは、形状と運動知覚を同時に測定する簡単な測定を提案します。この簡単なテストでは、中枢視野と周辺視野の入力に応じて視力障害を評価します。提案された運動視力検査は、これまで検出されなかった視覚系を損傷した患者の予備または強化された視力機能を明らかにするための標準検査の能力を向上させます。
概要
利用可能な視覚検査のほとんどは、中心網膜1に由来する入力に依存して、中心視力によって処理された特徴を調べるように指示されています。中心網膜は、最大の視力を得るために最も密度の高い錐体視細胞集団を有し、末梢網膜を支配する桿体視細胞を欠いている2。高密度に詰め込まれた光受容体の存在は、神経節細胞の密度の増加にも反映されており、これは、より多くの軸索が視神経に向けられ、最終的には視覚野に向けられることを意味します。中心窩の外側から周辺に向かって、桿体は錐体視細胞3を上回っています。桿体の体幅が広く、光受容体のモザイクがまばらであるため、網膜末梢部は主に暗視と運動認識に反応します4。
古典的には、視野の中央部分の刺激に依存する視覚処理は静止した物体の微細な分析に専念し、その周辺部分は動きを検出し、物体を中心の中心窩視に運び、そこでさらに分析されることに特化していると考えられていました5,6。しかし、皮質レベルでは、静止経路の詳細な分析が運動感受性経路から完全に分離されていないことを示す新たな証拠があります6,7,8。形態と運動知覚を同時にテストすることは、古典的には、移動格子9とガラスパターン10、および同心円状のリング運動11を使用して実行されます。私たちの目標は、視覚障害者の通常の生活に近いテストを導入し、視覚処理のいくつかの機能が依然として保存され、強化されている可能性があることを明示的に示すことで、欲求不満を軽減し、希望を与えることです。ランダムドットキネマトグラム(RDK)に基づく提案された運動視力テストは、動きと形状の知覚分析を組み合わせ、同時に動きと形状の知覚の機能をテストします。運動視力テスト内では、RDKのさまざまな速度、方向、コントラストなど、テストする心理物理学的特徴の多くの可能性があります。パラメータを変更することにより、中央処理または末梢処理に特異的な刺激の強さを操作できます。例えば、高速移動する物体の検出は、周辺視覚処理12に特有のよく記述された特徴であるが、一方、明るい背景の暗さの処理は、中心視13によって優先的に処理される。この検査は、最初に、中枢網膜または末梢網膜内に特異的に位置する光受容体の網膜変性を有する患者に対して実施された14。網膜色素変性症 (RP) は末梢損傷を伴い、世界中で ~1/5000 の患者に蔓延しています15。有病率は~1/10000のシュタルガルト病(STGD)は、若年性黄斑変性症(MD)の最も一般的な原因です16。黄斑変性症や網膜末梢の網膜色素変性症のように、網膜中心の光受容体が損傷すると、対応する視野が失われます。これらの視野喪失は、所与の視覚系領域に特異的な特徴の障害に反映される17。重要なことに、網膜の影響を受けていない部分から入力を受け取る視覚系の領域も影響を受けます。黄斑変性症の動物モデルでは、両眼網膜中心損傷後、視力が悪化するだけでなく、末梢処理の特徴である運動知覚が強化されることが以前に示されました。ここで説明する運動視力検査は、視覚リハビリテーション手順を計画するための重要な洞察を提供します。視野の中央部分と周辺部分の間の相互作用の全体像は、失われた機能がどのように視覚系の予備部分に引き継がれるか、そしてこのプロセスが視覚トレーニングのリハビリテーション手順によってどのようにサポートされるかを理解する上で重要な役割を果たします。インラインでは、局所的な網膜変性が視覚処理にどのように影響するか、特にその損傷した部分を超えて、まだ不完全なままです。光学テストは、定常形状の特徴の測定に基づいています。たとえば、視力測定は、文字(スネレンチャート)、グレーティングチャート、またはバーニア視力チャートのいずれかの定常刺激に依存しています。
健康な眼と中枢・末梢視機能障害のある眼の中心視と周辺視のダイナミクスを広く理解することを目的として、形状と運動知覚を同時に測定する運動ベースの視力検査を導入しました。運動視力テストは、ネガティブまたはポジティブコントラスト(暗いドットまたは明るいドット)、ランダムドットキネマトグラム(RDK)から構築され、速度、コヒーレンス、または方向によって同じRDK背景から分離された、一致する表面を持つ楕円と円の中央に配置された形状の検出に基づいています。視力は、円と楕円の寸法の間で知覚される最小の差として測定され、結果は、被験者が違いを知覚するのをやめる視覚的な程度で与えられます。さらに、輝度コントラストが測定された運動視力に影響を与えるかどうかを確認するために、刺激を負(白い背景に黒い点)または正のコントラスト(黒い背景に白い点)で提示することができます。視覚系における正のコントラスト(ONタイプ)および負のコントラスト(OFFタイプ)処理に関する利用可能なすべての情報は、中心視野19,20の静止刺激から得られる。しかし、運動信号の周辺処理がコントラストにどのように依存するかは、かなり不明のままである14,21。高速に対する感度は周辺処理に特異的であるのに対し、中心運動処理は正のコントラスト(ONタイプ)で提示されるより高い空間周波数で低速に作用することが確立されただけです12。運動視力刺激の正と負のコントラストバージョン、およびドットの速度、およびコヒーレンスまたは方向を変更する機能は、視野全体をより詳細に記述するために重要です。さらに、レンズを中央に配置された穴のある不透明なものに交換したゴーグルを使用して、視野を中央に10度機械的に狭めることが提案されています。fMRIおよびTMSプロトコルに適したこの簡単に複製可能な狭窄システムは、末梢視覚入力の機能と、視覚末梢が中央で測定された視力にどのように影響するかをさらに調査することができます。同様のシステムは、以前の研究14で最初に検証され、陰性のコントラストと高速の動きでの動きの視力テストは、視覚周辺を強く活性化し、すべての参加者にとって最も困難であることがわかりました。シュタルガルト病の患者にとって、それらは手に負えませんでした。重要なことに、RDKの速度を低下させることによる視覚周辺刺激の減衰は、すべてのテスト対象者の視力閾値を改善します。結論として、単純な形状識別に基づく運動視力測定を伴う課題を提案する。そのため、患者さんや介護者にとっても分かりやすく、わかりやすい結果が得られます。ここで紹介する運動視力検査は、学界以外のユーザーにも対応しています。この課題は、幅広い年齢層や患者団体に説明しやすい。
Access restricted. Please log in or start a trial to view this content.
プロトコル
すべての手順は、関連するガイドラインと規制に従って実行され、WUM(KB / 157/2017)の倫理委員会によって承認されました。すべての参加者から書面による同意を得て、実験の一般的な目的を理解し、統計分析目的でデータを含めることを理解したことを確認しました。提示されたすべての視覚刺激は、これらの実験の目的で作成されたJavaベースのデスクトップアプリケーション(Viscacha2)を使用して生成されます。
1. セットアップ
- 静かで薄暗い部屋を確保します。コンピューター、キーボード、フラットディスプレイ、アイトラッカー(研究課題と目的に応じてオプション、 資料の表を参照)、机、あご当て、椅子で構成されるセットアップを構築します。参加者があごをあご当てに乗せて座り、目をディスプレイの上半分の中央の真正面に置き、手をキーボードの矢印キーに手を伸ばして座れるように配置してください。ディスプレイと目の間の水平距離は85cmである必要があります。
注: 参加者は訓練を受けており、手順全体を通して中心固定十字を固定するように具体的に求められていますが、アイトラッカーを使用したテストは、視線の変動が多すぎる参加者の分析中にフィルタリングするための追加のコントロールを構成する場合があります。さらに、研究の目的によっては、アイトラッカーの結果は、参加者のさまざまなコホートの固定パターン、瞳孔のサイズ、または関心のある場所に関する興味深い洞察を提供する場合があります。 - https://github.com/grimwj/Viscacha2 にアクセスし、[ コード ]ボタンをクリックしてZIPをダウンロードし、ソフトウェアをダウンロードします。zip ファイルを解凍し、作業ディレクトリに保存します。
- README.txt ファイルに記載されているインストール手順に従います。アイトラッカーでテストする場合は、アイトラッカーのソフトウェアインストール手順に従ってください。指示に従ってアイトラッカーを取り付けます。
- 初期チェックを実行するには、Viscacha2.jarファイルをダブルクリックしてプログラムを実行します。初期画面が表示されたら、キーボードの Esc キーを押してプログラムを終了します。
- 新しく作成したフォルダ(experiment_data、TestPatient、Shape_Brt)をナビゲートし、スプレッドシートエディタを使用して.csvファイルを開きます(フィールド区切り文字としてセミコロンを設定します)。画面サイズや画面からの距離などのパラメータが正しいことを確認します。
注:ここから、プロトコルは、1920 x 1080、31.5インチのディスプレイが使用され、患者と画面の間の距離が85cmであるという仮定に基づいています。これは、画面が水平方向の視覚空間の44.6°を占めることを意味します。これらのパラメータを満たせない場合は、手順 5 を参照してプログラムを再設定できます。
2. テストの初期難易度の決定
- config.txt ファイルを開き、patient_name=TestPatient を含む行を見つけます。TestPatient を、検査対象のサブジェクトを識別するテキストに置き換えます。
- config.txt ファイルで、次の行を見つけます filename=Shape_Brt.txt。この行がハッシュ記号 # (コメントなしの行) で始まっていないことを確認します。
- 被験者に、顎を乗せて、ディスプレイの上半分の中央の真正面に目を向けて、ディスプレイの前に座ってもらいます。画面からの距離が正しいことを確認します。被写体が使用するキーボードのキーに簡単にアクセスできることを確認してください。
- Viscacha2.jarディレクトリに移動し、プログラムを実行します。実験の全期間、画面中央の固定十字に照準を合わせるように参加者に教えます。
- 画面の両側に、中央の固定十字から同じ距離に円または楕円が表示されます。タスクは、キーボードの左右の矢印キーを使用して楕円の上の円を選択することです。参加者にタスクを説明し、準備ができたら s キーを押して実験を開始します。実験は、参加者が矢印キーの1つを押すまで続きます。
- プログラムは、4 回の逆転が発生するか、最大試行回数に達すると終了します。逆転は、被験者が以前に正しい応答を選択した後に間違った応答を選択した場合、またはその逆の場合に発生します。
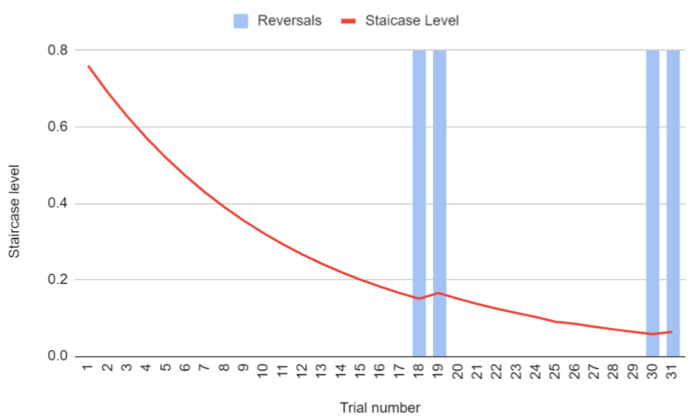
注:これは階段タイプの手順です。各試行の難易度は、正解するたびに増加し、誤答すると減少します。 図 1 は、1 人の代表的な参加者の試行で階段レベルがどのように変化するかを示しています。 - タスクが終了し、検出しきい値が確立されるまでの 4 回の反転に注意してください。結果を含む対応する.csvファイルを開きます。ファイルの末尾付近にある THRESHOLD 列を見つけます。この列の値を使用して、後続のタスクの初期難易度を計算します。
注:このテストは、init.txtファイルのExperiment_Type=Constant行からハッシュ記号を削除し、Experiment_Type=階段の行の前にハッシュ記号を追加することで、難易度のレベルが固定され、変化しない定数パラダイムで提示することもできます。

図1:Shape_Brt実験期間中の階段レベルの変化(その後の試行)。 赤いプロットは階段レベルを表しており、S-(楕円)のアスペクト比に変換されます。4回の反転(青いバー)が発生した後、被験者の検出しきい値が確立され、タスクが終了します。 この図の拡大版を見るには、ここをクリックしてください。
- 新しく取得した閾値を、次の刺激提示のベースラインとして使用します(ステップ2.3〜2.5)。すべての刺激定義ファイルの新しい閾値を置き換えるには、replacerフォルダ内のPythonスクリプトを使用して、画面の指示に従います。
3.刺激手順
注:合計10回の実験が行われます:5回は黒の背景に白い点、5回は白の背景に黒い点があります。
- コヒーレンスタスク
- 件名の準備ができたら、config.txtファイルを開き、filename=Shape_Brt.txt行にコメント(つまり、ハッシュ記号を挿入)し、shape_dotsB_C.txtタスクを含む下の行のコメントを解除します。このタスクでは、円と楕円は、10°/sの速度でランダムに移動するドットで構成されています。背景は、円や楕円と同じ速度でコヒーレントに上向きに移動するドットで構成されています。
注: 各タスクの定義ファイル内の Direction パラメータを編集することで、背景ドットの異なる移動方向を定義することができます。 - Viscacha2.jarを実行します。課題を簡単な言葉で説明してください、例えば、常に円を指してください。参加者の準備ができたら、s キーを押して実験を開始します。実験が完了するまで待ちます。
- config.txtファイルを開き、行filename=shape_dotsB_C.txtをコメント化し、shape_dotsW_C.txtタスクを含む下の行のコメントを解除します。手順3.1.2を繰り返します。
- 件名の準備ができたら、config.txtファイルを開き、filename=Shape_Brt.txt行にコメント(つまり、ハッシュ記号を挿入)し、shape_dotsB_C.txtタスクを含む下の行のコメントを解除します。このタスクでは、円と楕円は、10°/sの速度でランダムに移動するドットで構成されています。背景は、円や楕円と同じ速度でコヒーレントに上向きに移動するドットで構成されています。
- 指示タスク
- 件名の準備ができたら、config.txtファイルを開き、以前に選択したファイル名にコメントします。filename=shape_dotsB_D.txtタスクを含む行のコメントを解除します。このタスクでは、円と楕円は、10°/sの速度でコヒーレントに上向きに移動するドットで構成されています。背景は、円や楕円と同じ速度でコヒーレントに左に移動するドットで構成されています。
- Viscacha2.jarを実行します。被験者にタスクを説明します。参加者の準備ができたら、 s キーを押して実験を開始します。実験が完了するまで待ちます。
- config.txt ファイルを開き、行filename=shape_dotsB_D.txtをコメント化し、shape_dotsW_D.txtタスクを含む下の行のコメントを解除します。手順3.2.2を繰り返します。
- 速度タスク
- 件名の準備ができたら、config.txtファイルを開き、以前に選択したファイル名にコメントを付けます。タスクを含む行filename=shape_dotsB_V10_20.txtコメントを解除します。このタスクには3つの条件があります。円と楕円と背景は、首尾一貫して上に移動するドットで構成され、円と楕円内のドットは常に背景のドットよりも遅く移動します:i)10°/ s対20°/ s。ii)5°/ s対10°/ s。iii)1°/s対2°/s。
- Viscacha2.jarを実行します。被験者にタスクを説明します。参加者の準備ができたら、s キーを押して実験を開始します。実験が完了するまで待ちます。
- config.txtファイルを開き、shape_dotsB_V10_20.txt行にコメントし、shape_dotsW_V10_20.txtタスクを含む下の行のコメントを解除します。手順3.2.2を繰り返します。
- 手順3.3.1〜3.3.3を2回繰り返して、タスクshape_dotsB_V5_10.txtとshape_dotsW_V5_10.txt、およびshape_dotsB_V1_2.txtとshape_dotsW_V1_2.txtについて繰り返します。
- タスクの完了後に各タスクのファイル名を手動で変更しないようにするには、sweep_file オプションを使用します。config.txt ファイルで、sweep_files フィールドを 0 に設定して、各タスク プロシージャの終了後にプロシージャを終了します。
- この設定をShape_Brt.txtタスクに使用して、初期ベースラインしきい値を定義します。ベースラインを設定したら、複数のタスクを連続して実行するには、スイープ ファイルを 1 から 9 までの整数に設定します。ここでの整数は、連続するタスク間の変更の数を決定します(たとえば、1に設定され、shape_dotsB_D.txtがコメントされていない場合、プログラムはこのタスクと次のタスクを実行します。9に設定すると、すべてのタスクが実行されます)。内部的には、これにより、各実験の完了後に新しい構成ファイルが再生成され、以前に選択したファイル名がコメントされ、後続のファイル名が次の実験用に選択されます。
4.視界を制限するゴーグル
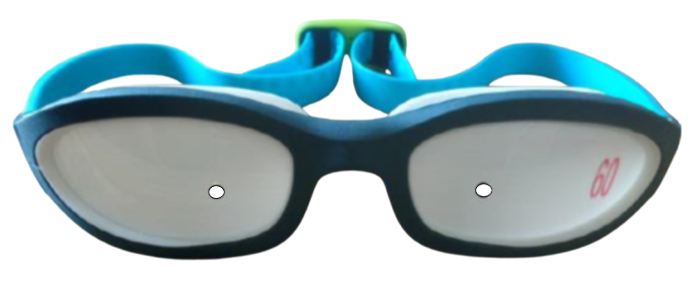
- 周辺視野を一時的に取り除くには、透明なレンズを白い不透明なレンズに交換する水泳用ゴーグル(図2)を使用します。レンズの口径は1.4mmで、視野は中央の10°に制限されていました。ゴーグルをすべての被写体に適させ、自然な個々の眼間距離を可能な限り考慮するために、58 mmから72 mmの間隔の穴のある14組のゴーグルを作成します(各ゴーグルの間に1 mmのステップがあります)。

図2:ナローゴーグル。 中央の穴の直径は1.4mmです。穴の間の距離が58mmから72mmのゴーグルが14組ありました 。
- 定規を使用して、参加者の目と目の間の距離を定義します。定規を目のすぐ上、眉毛に合わせて、値0を片方の目の上に置きます。2番目の目の上の値を確認して、2番目の瞳孔がmmでどれだけ離れているかを計算します。処置中は、参加者に視線をできるだけ安定させるように依頼します。
- より適切なペアを選択したら、15分間休憩します。この間、参加者に部屋の中を自由に動き回ったり、電話を使ったり、本を読んだりして、新しい視覚状態に目を慣らしてもらいます。
- 手順 3 から手順をもう一度開始します。
5. 再構成
- 画面サイズと距離の調整
- 別のディスプレイを使用している場合は、画面の寸法(解像度と対角線)を構成ファイルに挿入します(垂直解像度の場合はresolution_v、水平解像度の場合はresolution_h、画面の対角線はインチ単位ですdiagonal_inch)。
- Viscacha2.jarを実行します。初期画面が表示されたら、 ESC を押して終了します。結果を含む .csv ファイルを開きます。
- [距離 mm] のテキストを含む行を見つけて、値を書き留めます。
- 被験者が新しく計算された距離に座ることができるように、実験設定を再調整します。画面の幅が水平方向の視覚空間の 44.6° を占めるように距離を計算します。これは full_angle_h パラメータで定義され、config.txt ファイルでも変更できます。
注意: キャリブレーションは、full_angle_vパラメータを使用して画面の高さに対しても実行できます。これらのパラメータのうち1つだけを設定でき、もう1つは#プレフィックスでコメント化する必要があることに注意してください。
- 刺激の定義
- 刺激パラメーターを別々のファイル(例:shape_dotsB_C.txt)で定義します。S-の寸法(Ellipse_X、Ellipse_Y)などの一部の値はピクセル単位で与えられます。ピクセルから視度まで計算するには、結果を含む csv ファイルから抽出されたピクセル対角度乗数を値に掛けます。
注:ドットのコヒーレンスなどの刺激パラメータは、各層(背景、形状S+、形状S-、ノイズ)に対して事前に定義され、調整可能です。たとえば、コヒーレンスタスクでは、円と楕円は、速度10°/s(コヒーレンス= 0.0)でランダムに移動するドットで構成されます。背景は、円や楕円と同じ速度でコヒーレントに上向きに移動するドットで構成されています(コヒーレンス = 1.0)。Viscacha2には、まだ公式のユーザーマニュアルがありません。スティミュラス定義の詳細については、Viscacha2リポジトリのstimuli_description.odsファイルを参照してください。
- 刺激パラメーターを別々のファイル(例:shape_dotsB_C.txt)で定義します。S-の寸法(Ellipse_X、Ellipse_Y)などの一部の値はピクセル単位で与えられます。ピクセルから視度まで計算するには、結果を含む csv ファイルから抽出されたピクセル対角度乗数を値に掛けます。
Access restricted. Please log in or start a trial to view this content.
結果
運動視力タスクは、各参加者について、各刺激手順に対して1つの結果ファイルを生成します。テスト参加者の模範的なログ ファイルが、doc フォルダー内のリポジトリに含まれています。1行目から31行目までは、患者名や構成設定など、さまざまな設定が報告されます。タスクブロックは34行目から開始し、イベント時間、イベントタイプ、試行、期間、選択、正解、成功、実験者、外部刺?...
Access restricted. Please log in or start a trial to view this content.
ディスカッション
ここでは、ランダムなドットキネマトグラムに基づく一連の刺激を使用して視力を測定するための新しい方法が説明されています。その結果、円と楕円の知覚される違いが最小限に抑えられ、被験者がいつ形を互いに区別しなくなったかを見ることができます。達成された差が小さいほど、視力は向上します:それは、楕円とほぼ同じであっても、被験者が円がどこにあるかを検出できること...
Access restricted. Please log in or start a trial to view this content.
開示事項
著者らは何も開示していない。
謝辞
このプロトコルは、ポーランドのワルシャワにあるNencki Institute of Experimental Biologyの脳イメージング研究所で実施され、K.BとJ.S.に授与された国立科学センター(ポーランド)からの助成金2018/29/B/NZ4/02435によって支援されました。
Access restricted. Please log in or start a trial to view this content.
資料
| Name | Company | Catalog Number | Comments |
| Chinrest | custom-made | ||
| Computer | Windows 10 or higher | ||
| Display | 1920 × 1080, 31 inches | ||
| EyeLink 1000 Plus | SR Research | desktop mount | |
| USB Keyboard | |||
| USB mouse |
参考文献
- Wells-Gray, E. M., Choi, S. S., Bries, A., Doble, N. Variation in rod and cone density from the fovea to the mid-periphery in healthy human retinas using adaptive optics scanning laser ophthalmoscopy. Eye. 30 (8), 1135-1143 (2016).
- Kolb, H. How the retina works. Am Sci. 91, 28-35 (2003).
- Østerberg, G. Topography of the layer of rods and cones in the human retina. Acta Ophthal. 6, 1(1935).
- Kolb, H. The Organization of the Retina and Visual System. Circuitry for Rod Signals through the Retina. , University of Utah Health Sciences Center. USA. (2011).
- Burnat, K. Are visual peripheries forever young. Neural Plast. 2015, 307929(2015).
- Donato, R., Pavan, A., Campana, G. Investigating the interaction between form and motion processing: A review of basic research and clinical evidence. Front Psychol. 11, 566848(2020).
- Geisler, W. S. Motion streaks provide a spatial code for motion direction. Nature. 400, 65-69 (1999).
- Apthorp, D., et al. Direct evidence for encoding of motion streaks in human visual cortex. Proc Biol Sci. 280, 20122339(2013).
- Kelly, D. H. Moving gratings and microsaccades. J Opt Soc Ame. A, Opt Image Sci. 7 (12), 2237-2244 (1990).
- Glass, L. Moiré effect from random dots. Nature. 223 (5206), 578-580 (1969).
- Tagoh, S., Hamm, L. M., Schwarzkopf, D. S., Dakin, S. C. Motion adaptation improves acuity (but perceived size doesn't matter). J Vis. 22 (11), 2(2022).
- Orban, G. A., Kennedy, H., Bullier, J. Velocity sensitivity and direction selectivity of neurons in areas V1 and V2 of the monkey: influence of eccentricity. J Neurophysiol. 56 (2), 462-480 (1986).
- Rahimi-Nasrabadi, H., et al. Image luminance changes contrast sensitivity in visual cortex. Cell Rep. 34 (5), 108692(2021).
- Kozak, A., et al. Motion based acuity task: Full visual field measurement of shape and motion perception. Transl Vis Sci Technol. 10 (1), 9(2021).
- Cross, N., van Steen, C., Zegaoui, Y., Satherley, A., Angelillo, L. Retinitis pigmentosa: Burden of disease and current unmet needs. Clin Ophthalmol. 16, 1993-2010 (2022).
- Cremers, F. P. M., Lee, W., Collin, R. W. J., Allikmets, R. Clinical spectrum, genetic complexity and therapeutic approaches for retinal disease caused by ABCA4 mutations. Prog Retin Eye Res. 79, 100861(2020).
- Plank, T., et al. matter alterations in visual cortex of patients with loss of central vision due to hereditary retinal dystrophies. Neuroimage. 1556, 65(2011).
- Burnat, K., Hu, T. T., Kossut, M., Eysel, U. T., Arckens, L. Plasticity beyond V1: Reinforcement of motion perception upon binocular central retinal lesions in adulthood. J Neurosci. 37 (37), 8989-8999 (2017).
- Jansen, M., et al. Cortical balance between ON and OFF visual responses is modulated by the spatial properties of the visual stimulus. Cereb Cortex. 29 (1), 336-355 (2019).
- Pons, C., et al. Amblyopia affects the ON visual pathway more than the OFF. J Neurosci. 39 (32), 6276-6290 (2019).
- Luo-Li, G., Mazade, R., Zaidi, Q., Alonso, J. M., Freeman, A. W. Motion changes response balance between ON and OFF visual pathways. Commun Biol. 1, 60(2018).
- Jackson, A., Bailey, I. Visual acuity. Opto Pract. 5, 53-70 (2004).
- Baker, C. I., Peli, E., Knouf, N., Kanwisher, N. G. Reorganization of visual processing in macular degeneration. J Neurosci. 25 (3), 614-618 (2005).
- Gilbert, C. D., Li, W. Adult visual cortical plasticity. Neuron. 75 (2), 250-264 (2012).
- Guadron, L., et al. The saccade main sequence in patients with retinitis pigmentosa and advanced age-related macular degeneration. Invest Ophthalmol Vis Sci. 64 (3), 1(2023).
- Gameiro, R. R., et al. Natural visual behavior in individuals with peripheral visual-field loss. J Vis. 18 (12), 10(2018).
- Sammet, S. Magnetic resonance safety. Abdom Radiol. 41 (3), 444-451 (2016).
- Potok, W., et al. Modulation of visual contrast sensitivity with tRNS across the visual system, evidence from stimulation and simulation. eNeuro. 10 (6), (2023).
- Pearson, J., Tadin, D., Blake, R. The effects of transcranial magnetic stimulation on visual rivalry. J Vis. 7 (7), 1-11 (2007).
Access restricted. Please log in or start a trial to view this content.
Erratum
Formal Correction: Erratum: Motion-Acuity Test for Visual Field Acuity Measurement with Motion-Defined Shapes
Posted by JoVE Editors on 4/01/2024. Citeable Link.
This corrects the article 10.3791/66272
転載および許可
このJoVE論文のテキスト又は図を再利用するための許可を申請します
許可を申請さらに記事を探す
This article has been published
Video Coming Soon
Copyright © 2023 MyJoVE Corporation. All rights reserved