
Method Article
고기 인증에 펩티드 응용의 MRM 질량 분석을 사용하여 혼합물에서 종 결정 및 정량
요약
We present a protocol for identifying and quantifying the components in mixtures of species possessing similar proteins. Mass spectrometry detects peptides for identification, and gives relative quantitation by ratios of peak areas. As a tool food for fraud detection, the method can detect 1% horse in beef.
초록
We describe a simple protocol for identifying and quantifying the two components in binary mixtures of species possessing one or more similar proteins. Central to the method is the identification of 'corresponding proteins' in the species of interest, in other words proteins that are nominally the same but possess species-specific sequence differences. When subject to proteolysis, corresponding proteins will give rise to some peptides which are likewise similar but with species-specific variants. These are 'corresponding peptides'. Species-specific peptides can be used as markers for species determination, while pairs of corresponding peptides permit relative quantitation of two species in a mixture. The peptides are detected using multiple reaction monitoring (MRM) mass spectrometry, a highly specific technique that enables peptide-based species determination even in complex systems. In addition, the ratio of MRM peak areas deriving from corresponding peptides supports relative quantitation. Since corresponding proteins and peptides will, in the main, behave similarly in both processing and in experimental extraction and sample preparation, the relative quantitation should remain comparatively robust. In addition, this approach does not need the standards and calibrations required by absolute quantitation methods. The protocol is described in the context of red meats, which have convenient corresponding proteins in the form of their respective myoglobins. This application is relevant to food fraud detection: the method can detect 1% weight for weight of horse meat in beef. The corresponding protein, corresponding peptide (CPCP) relative quantitation using MRM peak area ratios gives good estimates of the weight for weight composition of a horse plus beef mixture.
서문
The European horse meat scandal of 2013, in which undeclared horse meat was found in a number of supermarket beef products1, highlights the need for testing methods capable of detecting and measuring food fraud in meat. Several technologies have been explored, especially enzyme-linked immunosorbent assay (ELISA) and DNA-based methods2. An alternative route, based on mass spectrometry, targets species-specific peptides which in turn arise from species-specific proteins. Here we outline one such peptide-based approach that offers both identification and relative quantitation of the adulterant species in a meat mixture3.
The protocol is framed in the context of red meats and the desire to determine the presence of one in another at the level of 1% by weight, the level considered by some to represent fraudulent food adulteration as opposed to contamination4. The method relies in the first instance on identifying a protein which is nominally 'the same' in all target meats. Myoglobin, the protein responsible for the red color of meat, is a good candidate since it is abundant, relatively heat tolerant and water soluble, and has been used for species determination of meat previously5,6. The myoglobins for beef (Bos Taurus), pork (Sus scrofa), horse (Equus caballus) and lamb (Ovis aries)3, for instance, are nominally the same, as required, but their sequences are not identical. Such groups of 'similar but different' proteins, like these four myoglobins, can conveniently be described as 'corresponding proteins'. The sequence differences in these four myoglobins are species-specific: for example, the full myoglobin proteins for beef and horse, P02192 and P68082 respectively, each comprise 154 amino acids with 18 sequence differences between the two. Subject to proteolysis using trypsin these proteins produce two sets of peptides, some of which are identical, and some which show one or more species-specific amino acid differences: corresponding proteins therefore give rise to corresponding peptides.
The CPCP approach, therefore, seeks first to identify proteins from two or more species where these proteins exhibit limited species-specific sequence variants. These are corresponding proteins. Following proteolysis, corresponding proteins give rise to peptides, some of which likewise display species-specific sequence variants inherited from the parent protein. These are corresponding peptides. The CPCP approach can be used to compare levels of two corresponding proteins in a mixed species sample by monitoring the levels of corresponding peptides.
The natural technology for the detection of known peptides is multiple reaction monitoring mass spectrometry, or MRM-MS7. Species-specific peptides yield precursor ions, which along with their mass spectrometry fragment ions, are easily itemized in advance by software tools. These lists are then used to instruct the mass spectrometer to record only specific precursor plus fragment ion pairs, called transitions. A particular target peptide is therefore identified not only by its retention time in the chromatography preceding the mass spectrometer, but also by a set of transitions sharing a common precursor ion. This is a highly selective means of detecting known peptides that makes efficient use of the mass spectrometer resource.
Other authors have used mass spectrometry to test for meat adulteration via peptide markers but from disparate proteins8-14. Using the corresponding proteins, corresponding peptides (CPCP) scheme, however, means experimental conditions can be optimized, aiding identification of the species in the mixture from known species-specific transitions. In addition, corresponding proteins and peptides will generally behave similarly in the extraction, proteolysis and detection stages. Since transition peak areas are quantitative and reproducible, ratios of peak areas arising from pairs of corresponding peptides from different species provide a direct estimate of the relative quantities of two meats in a mixture. In contrast, more traditional quantitation routes exploit calibrations based on reference materials to establish absolute quantitation14,15.
Though the protocol is outlined in the context of myoglobin and meat, proteins other than myoglobin could be used for identification and relative quantitation via the CPCP strategy in meat mixtures, though potentially with modifications to the protocol. In addition the strategy is also applicable to binary mixtures of other species sharing one or more corresponding proteins.
The starting point for the protocol is purified 'reference' myoglobin, which for some species can be purchased but which for others must be prepared by conventional size-exclusion chromatography. The procedure for preparing reference myoglobin is not included in the protocol, but is described elsewhere3. Software tools16 are used to list candidate peptides and transitions arising from myoglobins of interest. Each reference myoglobin is subjected to proteolysis and the resultant peptides analyzed by liquid chromatography electrospray ionization tandem mass spectrometry (LC-ESI-MS/MS) to discover which of the candidate precursor ions and transitions are most useful, and to determine the matching peptide retention times. The outcome of this stage is a revised list of target peptides with their transitions, suitable for species determination, and a list of CPCP pairs, suitable for relative quantitation. To test real meats, sample extractions are prepared then subjected to proteolysis to generate peptides both from myoglobin and other extraneous proteins. The myoglobin-based peptides are then monitored by LC-ESI-MS/MS based on their listed transitions. The species present in a mixture are identified by the transition peaks associated with marker peptides. Estimates of the relative amounts of two meats in a binary mixture are calculated using ratios of transition peak areas. A set of test mixtures of pairs of meats will allow the ratio of peak areas for a given pair of transitions to be checked and calibrated against actual mixtures.
프로토콜
1. 단백질 분해 및 참조 Myoglobins 분석
- 참조 myoglobins의 단백질 분해
- (- 25 MM의 중탄산 암모늄 0.5 ㎎ / ㎖ 범위 0.2) 3 정제 된 기준 myoglobins의 솔루션을 준비합니다.
- 전송 한 2 mL의 원심 분리 튜브에 각 시료 용액의 분취.
- 열적으로 30 분 동안 95 ° C에서 핫 블록 내의 샘플을 가열함으로써 상기 추출 된 단백질을 변성시킨다. 실온에 도달 할 때까지 약 15 분 동안 샘플을 냉각. 다음, 소화를 향상 혼합 요소 (최종 농도 0.5 M) 30 mg을 추가합니다.
- 트립신 단백질 분해
- 25 mM의 중탄산 암모늄의 트립신의 1 ㎎ / ㎖ 용액을 제조하고 필요에 따라 얼음에 저장합니다. 트립신의 충분한 볼륨을 추가 최종 효소 활성이 420 BAEE입니다 (N- 벤조일-L 아르기닌 에틸 에스테르 염산염) 단위 / 추출 된 단백질의 ㎎을 한 후 부드러운 텍싱하여 혼합 3에서 하룻밤 proteolyze 수 등7 ° C.
- 단백질 분해의 완전성을 입증 소듐 도데 실 설페이트 폴리 아크릴 아미드 겔 전기 영동 (SDS-PAGE) (17)를 수행한다.
- 후 단백질 분해 시료의 탈염
- 2 V : 물 V 샘플 1을 희석.
- 중합체 역상 활성화 (RP) 카트리지를 메탄올 1 ㎖를 첨가하여 30 mg을 RP 물질로 채워진 후, 1 ml의 1 % 포름산을 첨가하여 카트리지 평형.
- 중력에서 카트리지에 샘플을로드합니다.
- 중력에서 5 % 메탄올 / 1 % 포름산 1 ㎖로 세척.
- 중력에서 5 μL의 디메틸 설폭 사이드 (DMSO)로 채워져 2 ml의의 microcentrifuge 튜브에; : 아세토 니트릴 / 물 1 ㎖ (0.1 % 포름산 V 90:10 V)로 펩티드를 용출.
- 그런 다음 250 ㎕의 아세토 니트릴 / 물에 재용 해 잔사를 120 분 동안 원심 증발기를 사용하여 50 ℃에서 진공하에 용매를 제거한다 (3:97 V : V, 0.1 % 포름산).
- 이전낮은 볼륨 오토 샘플러 바이알에 대한 해결책.
참고 : 시료는 액체 크로마토 그래피 질량 분석법 (LC / MS) 분석을 위해 준비 될 때까지 4 ℃에서 저장 될 수있다.
- MRM에 대한 전환 목록의 생성
- UniProt 데이터베이스에서 다른 고기에 대한 미오글로빈 시퀀스를 찾습니다.
- (예 스카이) 펩티드 및 전이 예측 소프트웨어 '타겟'박스로 미오글로빈 서열을 입력한다. 필요한 경우, 그 조각 목록을 표시 할 수있는 펩타이드를 위로 마우스.
- '설정'을 클릭하고 '펩타이드 설정'을 선택합니다. 입력 소화를위한 환경 설정 (즉, 트립신) 및 놓친 분열의 수 (0). 특히, 추가 매개 변수에 필요한 선택 입력 펩타이드 길이 (6-25)는 N 말단 제외 (0) 및 (없음) 아미노산 수정을지지 않습니다.
- '전환 설정'을 '설정'을 클릭하여 선택합니다. 에 대한 환경 설정을 선택합니다LC / MS 분석을 위해 사용되는 기기 종류.
- '내보내기'를 클릭하고 생성 된 MRM 전환 및 매개 변수를 포함하는 스프레드 시트를 작성하는 '전환 목록'을 선택합니다.
- LC / MS 분석으로
- 고성능 액체 크로마토 그래피 (HPLC) 오토 샘플러 C18 코어 쉘 HPLC 컬럼 (10cm X 2.1 mm 바이너리 구배 시스템 (V 물 (A) 및 아세토 니트릴 (B) 0.1 % 포름산 V 각각)를 설정 , MRM 검출 긍정적 인 전기 분무 모드에서 작동 삼중 사중 극자 질량 분석기에 연결된 2.6 μm의 입자 크기).
- 데이터 수집 소프트웨어 (예를 들어, 애널리스트)에서 '파일'과 '새'를 선택하고 팝업 상자에서 '취득 방법'을 클릭 한 후 '확인'을 클릭합니다.
참고 :이 새로운 LC / MS 방식의 설정을 가능하게 연결된 장치의 목록이 들어있는 계기 방법 편집기를 엽니 다. - '바이너리 펌프'그리고 난을 클릭nput 5 분, 23 분에서 100 % B까지 증가 유량 값 (300 μL / 분), 22 분에 걸쳐 30 % B로 3 % B의 바이너리 구배 프로파일을 설정 테이블의 구배 시간, 세척 또 6 분 동안 초기 조건 및 재 평형에 반환하기 전에.
- '오토 샘플러'를 클릭하고 주입량 (5 μl를) 삽입합니다. '바늘 세척주기를'사용하고 '세척 시간'(30 초)를 입력하고 '세척 포트'를 선택합니다.
- '온도 조절 열 컨트롤러'와 '열 오븐 등록 정보'설정 '왼쪽 온도'와 '마우스 오른쪽 버튼으로 온도'(40 ° C)을 클릭합니다.
- '질량 분석기'를 클릭 한 다음 소스 가스 조건을 입력하는 '매개 변수 편집'을 클릭합니다. '긍정적'으로 'MRM (MRM)'와 '극성'와 '스캔 유형'를 선택합니다. 액정 분석를 들어, 총 시간을 '기간 요약'으로 이동하고 '지속 시간'을 입력D 평형 (35 분).
- 표에서 마우스 오른쪽 버튼을 클릭하고 테이블에 이러한 열을 추가하는 '디 클러스터링 잠재력 (DP)'와 '충돌 에너지 (CP)를'를 선택합니다. 전환 목록 (단계 1.4.5 참조)에서 만든 하나의 고기 종에 대한, 모든 전환에 대한 Q1, Q3, 시간 (밀리 초), ID, DP 및 CE 값을 입력합니다.
주 : 시간 (밀리 초)을, 드웰 시간 질량 분석기 각 전이 스캔 소요 시간을 의미 합은 3 초를 초과하지 않아야한다. - 획득 방법 파일 (파일 확장자 .dam)를 저장합니다.
참고 : - 1.5.8 각 고기 종에 대해 반복 할 필요가 1.5.2이 단계를 반복합니다. 이 아래 분석을위한 준비 화면 모드에서 각각의 고기 종에 대해 하나의 방법 파일을 생성합니다. - 데이터 수집 소프트웨어에서 '획득'을 클릭하고 '평형'를 선택합니다. 상자가 열리면, 악기 평형을 시작하기 위해 필요한 취득 방법을 선택합니다.
- 아칸소에서 샘플 튜브를 넣어자동 샘플러에 ACK.
- '파일'을 클릭하고 '새'다음 '취득 배치'를 선택합니다. '샘플'탭에서 '샘플 추가'후 '설정 추가'를 선택합니다. 샘플의 수를 분석 할 삽입하고 '확인'을 클릭합니다. '취득'상자에서 드롭 다운 메뉴에서 분석을 위해 사용되는 방법 파일을 선택합니다.
- 표에서 '플레이트 코드'를 선택하고 드롭 다운 메뉴에서 해당 용지함 구성을 선택합니다. 그 후에 마우스 오른쪽 버튼으로 클릭을 열 머리글 '코드 플레이트'를하고 '아래로 채우기'에 왼쪽을 클릭합니다. '유리 병 위치'에서 행 오토 샘플러의 각 샘플의 위치를 입력합니다.
- '데이터 파일'에서 인수에 대한 파일 이름을 입력 열 머리글에서 다음 왼쪽 버튼을 클릭 마우스 오른쪽 버튼으로 클릭 한 다음 및 '아래로 채우기'를 선택합니다. '샘플 이름'에서 각각의 시료의 식별이 분석 될 삽입한다. 획득 배치 파일로 저장 (파일 전자xtension .dab).
- 다음 LC / MS에서 분석 할 필요가 샘플을 선택한 후 '제출'탭을 클릭합니다. '제출'을 클릭합니다. 분석을 시작하기 위해 '샘플 시작' '취득'을 클릭합니다.
참고 : 각 취득 방법은 하나의 고기 종에 대한 크로마토 그래프의 전체 길이에 걸쳐 MRM 전이를 검색합니다. MRM 획득을위한 질량 분석기 설정은 기기 종류와 펩타이드에 따라 다릅니다. - 데이터 열람 소프트웨어를 사용하여 생성 된 데이터 파일을보기. XIC (추출 이온)과 하나의 전구체 (Q1)에 대한 모든 조각 (Q3 값)을 강조 드롭 다운 목록을 클릭합니다. 새 창은 만 선택한 전환을 보여줍니다 열립니다.
- 이러한 단일 펩티드에 상응 때문에 동시 천이 그룹의 유지 시간 (t R 용)을 기록한다.
- 각각에 대한 각각의 펩티드에 피크를 할당하기 위해 전환의 각 세트에 대해 이전 두 단계를 반복합니다고기 종의.
- 종의 식별을 제공하기위한 적합한 표식 펩티드를 기록 (예를 들면, 펩티드 HPGDFGADAQGAMTK 전구체 m / z = 752, R의 t = 말 12.0 분) 상대 정량에 적합한 대응하는 쌍 형성되는 동시에 그 체류 시간을 갖는, 한주의 .
참고 : 예를 들어, 말 마커 펩타이드 (전구체 m / z = 752)는 해당 쇠고기 펩타이드, HPSDFGADAQAAMSK (전구체 m / z = 767, R의 t = 13.2 분)가 있습니다. - 차례로 각 고기 종 데이터 열람 소프트웨어 고기 종을 모두 수용하는 단일 동적 메소드를 생성 (1.5.8의 특정 펩타이드에 지정된) 각각의 전구체에 대한 XIC 전이 데이터를 열기 위해.
- 왼쪽 버튼으로 클릭하여 선택한 유지 시간에 피크 클러스터 확대 및 클러스터 아래에 커서를 드래그. (피크 레이블을 마우스 오른쪽 버튼으로 클릭) 가장 강렬한 전환을 확인합니다.
- 수동으로 전환을 기록스프레드 시트 및 체류 시간.
- 액정 / MS 소프트웨어에 대한 새로운 동적 방법으로 매개 변수를 입력하려면 '질량 분석기'를 클릭 한 다음 소스 가스 조건을 입력하려면 '매개 변수 편집'을 클릭합니다. '긍정적'으로 'MRM (MRM)'와 '극성'와 '스캔 유형'를 선택합니다.
- '기간 요약'로 이동합니다 (LC 분석 및 평형의 총 시간으로 설정) 지속 시간을 입력합니다. 표에서 마우스 오른쪽 버튼을 클릭하고 테이블에 이러한 열을 추가하는 '디 클러스터링 잠재력 (DP)'와 '충돌 에너지 (CP)를'를 선택합니다.
참고 : '시간'열은 이제 각각의 전환에 대한 예상 체류 시간 (분)을 의미한다. - 액정 / MS 데이터 수집 소프트웨어의 '매개 변수 편집'섹션에서 '예약 MRM'확인란을 선택합니다. Q1, Q3, 시간 (분), ID, 스프레드 시트 (1.5.21)에서 만든 전환에 대한 DP 및 CE 값과 취득 방법을 저장 (FIL 입력전자 확장 .dam).
주 :이 방법은 일반적 MRM 수가 각 펩티드에 대해 4 개의 가장 강한로 천이 향상된 감도 데이터의 품질을주는 각 펩티드 피크 유지 시간 창에 걸쳐 스캔 줄인다. A '동적'방법은 '유도 보유 시간 윈도우'방법이라고도 일정입니다.
교정 샘플 2. 준비 및 분석
- 고기 혼합물의 추출
- 이전 다음 분말로 분쇄 냉동 고기를 사용하여, 15 ml의 플라스틱 원심 분리 튜브에 고기 각각 양 (약 300 mg의 총 중량)을 칭량하여 고기 혼합물의 범위를 준비한다.
- 추출 완충액 (pH 6.5에서 + 0.15 M 인산 완충액 0.15 M 염화칼륨)의 4 ML을 추가합니다. 30 초 동안 소용돌이. 250 회 / 분으로 실온에서 2 시간 동안 실험실 진탕 추출 하였다.
참고 : 사이클 / 분은 진동 운동을 의미한다. - 의 2 ml의 이동2 ML의 microcentrifuge 관에 압축을 풉니 다. 17,000 X g에서 4 ° C에서 5 분 동안 원심 분리기.
- 전송 200 μL를 2 mL의 원심 분리 튜브로 상청액의 분취 액 (단백질 분석 용 소량 비축 2.2 참조), 원심 증발기를 이용한 드라이 (미리 설정된 프로그램 : 50 ° C, 아니 배기 120 분의 지속 시간).
- 단백질 분석
- 이전 96 웰 플레이트의 각 웰에 삼중으로 예약 상청 7 μL 씩 (2.1.4 참조).
- 전송 중으로 단백질 표준 시리즈 7 μL 씩 범위 0-1.0 ㎎ / ㎖ 소 혈청 알부민 (BSA), 동일한 96 웰 플레이트.
- 각 웰에 쿠마 플러스 단백질 분석 시약 200 μl를 추가합니다.
- 육안으로 샘플을 검정 표준의 범위에 체크 단백질 표준 시료 웰의 색을 비교한다. 필요한 경우이 범위가되도록 희석 샘플을 반복합니다.
- 일에 접시를 남겨주세요3 분.
- 피하 주사 바늘을 형성 한 모든 거품을 버스트.
- 595 nm의 파장에서 종료점 표준 프로토콜을 이용하여 플레이트 판독기에서 플레이트를 분석한다.
- 단백질 수준에서 캘리브레이션 데이터를 사용하여 샘플의 단백질 농도를 결정한다.
주 :이 트립신 다이제스트에 사용 트립신의 양의 계산에 필요하다.
- 고기 혼합물의 단백질 분해
- 25 mM의 중탄산 암모늄 용액 1 ㎖의 단계 2.1.4에서 건조 잔류 재용. rotamixer 잘 섞는다.
- 1.3.7에 단계 1.1.3에서 프로토콜을 따르십시오.
- LC / MS 분석으로
- 이전에 (단계 1.5.1)로 LC / MS를 설정합니다.
- 고기 종을 모두 결합 동적 LC / MS 방법을 사용 1.5.24에서 단계에서 생성 된 수집 방법을 선택, 그리고에 대한 데이터를 수집 - 이전에 설명 된대로 새 획득 배치 만들기 (1.5.14 1.5.9 단계) diges테드 고기 샘플.
- 데이터보기 소프트웨어의 전체 크로마토 그램을 표시합니다. 다시 설정 한 각 전환에 대한 XIC을 표시합니다. 시각 각 클러스터함으로써 선택된 펩티드의 존재를 확인하고, 예상되는 유지 시간 종형 피크의 필요한 수를 포함 확인.
- 탐색 줄에 '정량 방법을 구축'을 두 번 클릭하여 관심의 전환의 각 피크 면적을 통합 할 수있는 소프트웨어를보고있는 데이터를 사용하여 정량을 수행합니다.
- '선택 샘플'창에서 '데이터 파일'및 '샘플'을 선택하는에 '분석 물'테이블을 생성하기 위해 분석된다.
- 통합 할 수있는 전환 (분석 물)의 첫 번째 표시하는 '통합'탭을 클릭합니다.
- 전환의 드롭 다운 목록을 표시하는 '분석 대상'상자를 클릭합니다. 를 표시하고 시각적으로 정확한 피크 통합을위한 선택 확인 차례로 각 전환을 선택합니다. m에odify 또는 통합, 왼쪽 클릭을 강제로 대상 피크 위에 커서를 (이 녹색으로 강조 표시됩니다) 드래그합니다. '선택 피크'버튼을 클릭하고 '적용'을 클릭합니다.
- 방법 파일 (.qmf)로 작업 영역을 저장합니다.
참고 :이 샘플 피크 면적의 후속 계산에 대한 정량 방법 파일을 만듭니다. - 탐색 줄에 더블 클릭 '정량 마법사'. '선택 샘플'창에서 다음, 하나 또는 그 이상의 '사용 가능한 샘플'하나의 '데이터 파일'을 선택하여 '정량 설정'을 만들 수 있습니다. 선택 '다음' '설정을 선택하고 검색어'상자를 표시합니다. '다음'을 '선택 방법'을 표시하도록 선택, 기본값으로 둡니다. '방법'상자 단계 2.4.8에서 만든 '통합 방법'파일을 선택 드롭 다운에서 다음 '마침'을 선택합니다.
참고 :이 고기 혼합물에서 발생하는 전이 피크 면적을 포함하는 '결과 표'를 작성합니다. <리>는 '결과 테이블'(파일 확장자 .rdb), 텍스트 파일로 내보내기 (이 .txt)를 저장하고 데이터를 검토 할 스프레드 시트에서 엽니 다. - , 펩티드를 대응하는 두 개의 조각이 포함되어 이러한 경우에 초점을 맞추고에서 선택한 전환을위한 선택 MRM의 두 고기의 측정 비율에 비해 또 다른 하나의 고기 (전이 피크 면적) 비율의 플롯 그래프 (w / w) C- 말단 단부로부터 계산으로 아미노산 동일한 번호.
참고 : 동일한 분열 사이트와 동일한 조각이 최적의 결과를 제공합니다. - 위의 2.4.11에서 플롯을 검사합니다. 육안 또는 플로팅 패키지 추세선 도구를 이용하여 선형 구배 유사한 두 플롯이다들의 그룹을 식별한다. 실제 육류 시료 교정이 CPCP 플러스 단편의 조합 중 어느 하나 이상을 사용한다.
참고 : 이상한 그라데이션을 보여주는 그래프는 신호 헤어 구조 강화의 결과의 감소와 펩타이드 또는 단편 억제를 표시 할 수있다ngth. 비선형 플롯 불량 피크 검출이나 다른 문제를 나타낼 수있다.
3. 고기 샘플
- 대상 고기 시료에서 단백질을 추출
- 어디 주걱을 사용하여 샘플에서 적용 소비세 외부가 아닌 고기 재료. 예를 들어, 냉장 라자냐에서 소스와 파스타를 멀리 쳤어요.
- 금속 비커에 고기 20g의 무게.
- pH가 6.5에서 0.15 M 염화칼륨 / 0.15 M 칼륨 모노 포스페이트 버퍼 100 ㎖를 추가합니다.
- 1 분 동안 고속 균질에서 고기를 혼합하여 단백질을 추출합니다.
- 2.3.2 - 2.1.4 단계에서 프로토콜을 따르십시오.
- LC / MS에 의한 분석 샘플
- 반복 단계 2.4.2 동적 LC / MS 방법을 사용하여 데이터를 획득한다.
- 단계 2.4.3에서 수행 각 고기 미오글로빈에서 펩티드를 확인합니다.
- 정량을 위해, 관심있는 각각의 전환에 대한 피크 면적을 정량 통합 소프트웨어를 사용하여,로 단계 2.4.9에 설명.
- 혼합물에서 종의 식별을 위해, 전환의 숫자 합의 된 기준을 만족하는 마커 펩티드를 기록하고 그 전환에 대한 잡음 신호.
- 정량 전이 피크 면적 비율을 이용하여, 단계 2.4.12의 합의 통합 전이 피크 면적을 사용하고, 혼합물에서 두 종 마이오글로빈의 비율을 계산한다.
- 샘플에 존재하는 두 개의 고기의 상대적인 w / w 금액을 추정하기 위해 고기의 가능성이 미오글로빈 수준의 문학 (18)의 사전 지식을 사용합니다.
결과
단일 동적 모드 MRM 실험에서, 각 프로그램의 전환 별도로 기록 지정된 체류 시간 윈도우 위에 (초당 검출기 카운트 CPS 등). 모든 데이터는 하나의 실험에서 수집 따라서, 각각의 전이에 대한 피크 세기를 개별적으로 추출 할 수있다. 이어서 오직 제한된 신호는 전이 설정된 유지 시간 윈도우에 대한 것이다. 윈도우의 외부 신호는 정의에 의해 제로이다. 예를 들어 어느 한 전환의 신호, 말에서 752 → 1269 (질량 1,501.66 달톤은, 전구체 이온 m / z 751.84 달톤이 상태 = 2, 조각 이온 Y (13)를 충전 모노 이소 토픽 펩타이드)는 일반적으로 측정 노이즈가 아닌에서만 경쟁 할 수있다 아마도 다른 종에서 할 수있는 다른 전이 피크에서. 출력은 따라서 일반적인 이온 전구체를 공유 이러한 전환을위한 공통 유지 시간 깨끗한 피크 전이마다 하나의 세트이다.
그림 1 w / w 1 %의 혼합물 네 전환 (752) → (1269, 706, 248, 1366)의 세트에 대한 출력을 보여줍니다 쇠고기의 말. 표시되는 네 개의 전환이 말과 관련된, 순수 쇠고기, 양고기 또는 돼지 고기의 샘플에 결석하고 있기 때문에,이 피크는 말의 존재를 의미. 잡음 레벨이 식별을 확립 강건성 기준 둘 이상의 천이의 세트에 따라 각 일부 특정 신호를 초과. 이 그림은 따라서 쇠고기의 말 w / w는 1 %의 혼합물에 말의 존재를 설정합니다.
때때로, 단일 절연 전환이 검출된다. 이 질량 분석기로 시스템에서 예상 프로그램시켜 사람들과, 아마도 외부 단백질에서, 전구체 이온 및 단일 조각의 기회 일치를 나타냅니다. 단수 피크의 본질 및 예기치 유지 시간의 발생은 SI 인무시 될 수있는 사고의 전환 gnature.
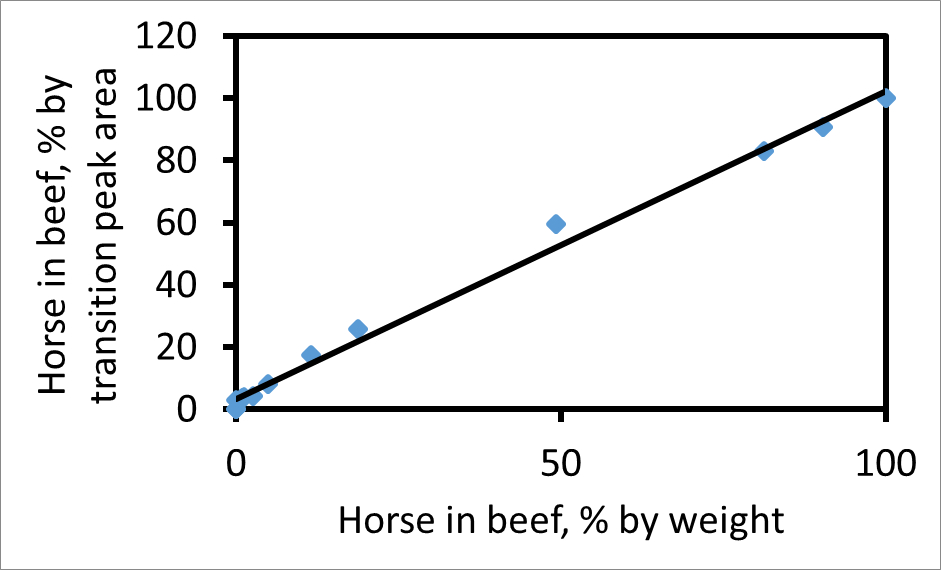
각 전이 피크 아래의 면적을 개별적으로 산출 할 수있다. 767가 → 1,299 (쇠고기). 혼합물의 실제 고기의 비율에 비례도 2 할이를 보여줍니다에 예 → 1,269 752 (말)에 적합한 조각, 쇠고기 전이 피크 면적에 말의 비율에 기초하여 쇠고기와 말의 혼합물에서 말의 무게 비율 무게에 비해 두 전환에 대한 피크 면적 비율의 줄거리. 백분율 전이 피크 면적 고기의 중량에 대한 퍼센트 중량 일치한다면 경사면이 곡선에서 기울기가 이러한 전환 및 CPCP 쌍에 대해, 상기 전이 피크 면적은 상대적인 양의 안정적인 측정을주고 있음을 나타내는, 1.03 1. 인 혼합물에서 두 고기. 의 기울기, 다른 요인 변화와 샘플의 말 고기 후, 쇠고기 등 미오글로빈의 두 배 풍부한 경우 라인 1보다 클 것이다.

그림 쇠고기의 말 w / w 1 %를위한 체류 시간 대 1. MRM 전이 강도. 트랜지션은 → (1269, 706, 248, 1366) 752입니다, 오렌지, 각각 검정, 파랑과 녹색으로 표시. 표식 펩티드 HPGDFGADAQGAMTK이다. 네 개의 전이 단편의 Y, n은 상기 펩티드의 C 말단으로부터 N 개의 아미노산 카운트 각각 나타내고, Y 13, Y 7, Y 2, Y (14)을, 표시 할 수있다. 잡음 신호는 23에서 4 개의 전환을 통해 53 다릅니다. 추가 빨간색 선은 0 % 말, 비교를 위해 100 % 쇠고기에 대한 752 → 1269 전환을 의미한다. 체류 시간 만 비제 영역이 표시된다. 이 수치는 왓슨 등. 3에서 수정되었습니다.에스 / ftp_upload / 54420 / 54420fig1large.jpg "대상 ="_ 빈 ">이 그림의 더 큰 버전을 보려면 여기를 클릭하십시오.

그림. 줄거리는 펩타이드 쇠고기 (767)와 말 (752) 모두에 대한 Y (13) 조각 이온의 쌍을 사용 %의 전이 피크 면적으로 쇠고기의 말에 비해 무게 %의 무게로 쇠고기의 말 2. 플롯,. A는 피크 면적을 나타낸다 경우 종축 (100) H / (A + H A B)이다. 가장 적합한 선 (R 2 = 0.99)의 기울기는 1.03이다. 이 그림은 왓슨 등. 3에서 수정되었습니다. 이 그림의 더 큰 버전을 보려면 여기를 클릭하십시오.
토론
적당한 표적 단백질의 선택은 중요하다. 좋은 표적 단백질 관심 종에 대응하는 형태로, 충분한 종에 의존하는 순서 변화, 종 특이성을 가지고 생물체 내에서 액세스 할 수있는 수량에 존재해야합니다. 처리를 거친 혼합물 (예를 들면, 열 처리)을 평가하기 위해, 그 처리에 비교적 면역 서열을 갖는 단백질이 바람직하다. 미오글로빈 조리 붉은 육류 포함 붉은 육류, 좋은 후보이지만, 유일한 가능성이 아니다. 표적 단백질이 결정되면, 프로토콜의 가장 중요한 부분은 단백질 분해 단백질이다. 미오글로빈 상이한 단백질은 또한 다른 단백질 분해 프로토콜을 요구할 수있다.
기술 된 바와 같이 프로토콜을 참조하여 정제 된 단백질에 기초하여 세그먼트를 포함한다. 이것은 고정 된 시간 윈도우 적합한 전구체 및 단편 이온을 발견하는 것이다. 이 세그먼트는 매우 유용하지만 필수적인 것은 아니다.
때로는 순서 차이 분해 프로파일에 극적인 영향을 갖는 경우이다. 예를 들어, 펩티드 쌍 VLGFHG (소) 및 ELGFQG (말) (구배도 2 미만 매니페스트) 변칙적 정량 결과를 제공한다. 후자의 펩티드 혼합물 중 말의 레벨의 과소 추정을 일으키는 비교적 억제 KE 절단에서 발생하기 때문이다. 다른 아미노산으로 시작하는 해당 펩티드 때문에 피해야한다. 종종 두 대응 펩타이드의 단편은 동일한 아미노산 서열을 가지고 잘 작동되지만, 항상 그런 것은 아니다 및 방법 개발 과정에서 체크 될 필요가있다. 종 식별이 훨씬 덜 민감 상대 정량보다이 문제입니다.이 프로토콜은 4 개의 빨간 고기 입증되었다의 3. 너무 많은 마커 펩티드 공동 용출 경우 전이 피크 형상의 품질을 효과적으로 유지 시간을 감소시키고, 궁극적으로 상대적 정량 평가를 저하 떨어질 수 있지만 추가 고기 종을 포함 할 수있다. 이미 개선 된 계측은이 향상됩니다. 이와 관련된 문제는 모든 고기는 다른 myoglobins을 가지고있다. 예를 들어, 말, 당나귀 얼룩말 myoglobins는 동일하므로 엄격하게하는 방법을 아는 것은 쇠고기 또는 말, 당나귀 또는 얼룩말를 단지 검출 할 수있다. 어떤 경우 myoglobins 동일하지 않더라도, 일부 키 펩타이드 일 수있다. 예를 들어, 일부 양고기 미오글로빈 유래 마커 펩티드는 염소에 나타납니다.
이것과 다른 단백질 기반 정량 방법에 대향 합병증 단백질 또는 펩티드 수준은 혼합물의 고기 수준 사소 동등 할 경우, 단백질 수준은 모든 종에 걸쳐 일정한 것으로 가정되어야한다는 것이다. 미오글로빈과 4 개의 빨간색 m에 대한이 보편적으로 사실이 아니다 먹는다. 일반적으로 레벨은 네 가지의 가장 낮은 수준을 보이는 돼지 고기 의존하는 종이다. 또한, 미오글로빈 수준은 고기 컷과 동물의 연령에 따라 달라집니다. 전이 피크 면적의 비율이 미오글로빈의 비율에 안정적으로 매핑하지만 그래서, 실제 고기의 비율에 매핑 혼합물에서 고기의 가능성이 소스에 관한 가정에 추정 도면이다.
이 연구에서 제시된 방법은 다른 번역 기부에서 다수의 방식으로 다르다. 더 일반적인 경로는 다른 종을위한 마커가 서로 8-12,14,19과 특별한 관계를 보유하지 않는 경우에 다양한 다른 종 - 의존성 표식 펩티드를 식별하기 위해 프로테오믹스 방법을 사용하는 것이다. 대조적으로, 우리는 종에 의존하는 순서가 3 변종까지 관심의 모든 종에 공통 단백질을 선택했습니다. 상대 정량 외에도 우리 전략의 핵심되는이 그 샘플 이점을 갖는다제조 전략이 최적화 될 수있다. 또, 해당 단백질을 추출 또는 이러한 조리 또는 통조림 등의 상업용 샘플의 처리, 예를 들면, 유사하게 동작 할 것으로 예상 될 수있다. 종 식별은 일반적으로 통상적으로 하나 또는 두 서열의 차이를 갖는 밀접하게 관련 펩티드의 검출을 통해 CPCP 접근 종 식별에서 진행하는 반면, 다른 표식 펩티드의 검출로 진행한다. 마지막으로, 단백질의 정량은 통상적으로 별도 알려진 표준 7,14,15에 따라 각 단백질의 절대 정량을 통해 진행 수도 다른 한 종의 중량 비율을 추정합니다. 그러나 교정 방법에 대한 필요가없고 CPCP 방법을 사용. 대신, 상대 수준은 모두 절대 측정 단계를 거치지 않고 두 종에서 두 대응하는 펩타이드의 신호 강도를 비교하여 추정된다. 궁극적 인 목표는 항문에 한 종의 중량 비율이기 때문에THER 상대적인 정량은 다음 CPCP 모두 직접적인 두 절대 정량 측정들을 비교하는 것보다 간단하다. 이러한 기능 식품 사기 탐지의 영역에서 빠른 감시 도구와 기술이 유용하게 정제 된 프로토콜을 사용하여 약 2 시간이 될 것으로 예상 짧은 실험 시간으로 변환합니다.
공개
The authors have nothing to disclose.
감사의 말
We acknowledge financial support from Institute of Food research BBSRC Core Strategic Grant funds, BBSRC Project BB/J004545/1.
자료
| Name | Company | Catalog Number | Comments |
| Uniprot database | www.uniprot.org | Freely accessible database of protein sequences | |
| Skyline software | www.skyline.gs.washington.edu | Free software to download that enables the creation of targeted methods for proteomic studies, peptide and fragment prediction | |
| Ammonium bicarbonate | Sigma-Aldrich Co Ltd, Gillingham, UK www.sigmaaldrich.com | O9830 | |
| Methanol, HPLC grade | Fisher Scientific, Loughoborough, UK www. fisher.co.uk | 10674922 | |
| Acetonitrile, HPLC grade | Fisher Scientific, Loughoborough, UK www. fisher.co.uk | 10010010 | |
| Urea | Sigma-Aldrich Co Ltd, Gillingham, UK www.sigmaaldrich.com | U5378 | |
| Trypsin(from bovine pancreas treated with TPCK) | Sigma-Aldrich Co Ltd, Gillingham, UK www.sigmaaldrich.com | T1426 | |
| Formic acid | Sigma-Aldrich Co Ltd, Gillingham, UK www.sigmaaldrich.com | F0507 | |
| Coomassie Plus Protein Assay Reagent | Thermo Fisher Scientific www.thermofisher.com | 1856210 | |
| Protein standard | Sigma-Aldrich Co Ltd, Gillingham, UK www.sigmaaldrich.com | P0914 | |
| Ultra Turrax homogeniser T25 | Fisher Scientific, Loughoborough, UK www. fisher.co.uk | 13190693 | |
| Edmund and Buhler KS10 lab shaker | |||
| Heraeus Fresco 17 Centrifuge | Thermo Fisher Scientific www.thermoscientific.com | 75002420 | |
| Vacuum centrifuge RC 1022 | Jouan | ||
| Plate Reader | |||
| Strata-X 33u polymeric reversed-phase cartridges 60 mg/3 ml tubes | Phenomenex, Macclesfield, UK | 8B-S100-UBJ | |
| 4000 QTrap triple-quadrupole mass spectrometer | AB Sciex, Warrington, UK www.sciex.com | ||
| 1200 rapid resolution LC system | Agilent, Stockport, UK | ||
| XB C18 reversed-phase capillary column (100 mm x 2.1 mm, 2.6 µm particle size) | Phenomenex, Macclesfield, UK www.phenomenex.com | ||
| Analyst 1.6.2 software | AB Sciex, Warrington, UK www.sciex.com | QTrap data acquisition and analysis, including peak area integration | |
| Autosampler vials |
참고문헌
- O'Mahony, P. J. Finding horse meat in beef products-a global problem. QJM-An Int. J. Med. 106, 595-597 (2013).
- Sentandreu, M. A., Sentandreu, E. Authenticity of meat products: Tools against fraud. Food Res. Int. 60, 19-29 (2014).
- Watson, A. D., Gunning, Y., Rigby, N. M., Philo, M., Kemsley, E. K. Meat Authentication via Multiple Reaction Monitoring Mass Spectrometry of Myoglobin Peptides. Anal. Chem. 87, 10315-10322 (2015).
- Food Standards Agency. . Report of the investigation by the Food Standards Agency into incidents of adulteration of comminuted beef products with horse meat and DNA. , (2013).
- Taylor, A. J., Linforth, R., Weir, O., Hutton, T., Green, B. Potential of electrospray mass-spectrometry for meat pigment identification. Meat Science. 33, 75-83 (1993).
- Ponce-Alquicira, E., Taylor, A. J. Extraction and ESI-CID-MS/MS analysis of myoglobins from different meat species. Food Chem. 69, 81-86 (2000).
- Gallien, S., Duriez, E., Domon, B. Selected reaction monitoring applied to proteomics. J. Mass Spectrom. 46, 298-312 (2011).
- Orduna, A. R., Husby, E., Yang, C. T., Ghosh, D., Beaudry, F. Assessment of meat authenticity using bioinformatics, targeted peptide biomarkers and high-resolution mass spectrometry. Food Addit. Contam. Part A-Chem. 32, 1709-1717 (2015).
- Claydon, A. J., Grundy, H. H., Charlton, A. J., Romero, M. R. Identification of novel peptides for horse meat speciation in highly processed foodstuffs. Food Addit. Contam. Part A-Chem. 32, 1718-1729 (2015).
- von Bargen, C., Brockmeyer, J., Humpf, H. U. Meat Authentication: A New HPLC-MS/MS Based Method for the Fast and Sensitive Detection of Horse and Pork in Highly Processed Food. J. Agric. Food Chem. 62, 9428-9435 (2014).
- von Bargen, C., Dojahn, J., Waidelich, D., Humpf, H. U., Brockmeyer, J. New Sensitive High-Performance Liquid Chromatography Tandem Mass Spectrometry Method for the Detection of Horse and Pork in Halal Beef. J. Agric. Food Chem. 61, 11986-11994 (2013).
- Montowska, M., Alexander, M. R., Tucker, G. A., Barrett, D. A. Authentication of processed meat products by peptidomic analysis using rapid ambient mass spectrometry. Food Chem. 187, 297-304 (2015).
- Montowska, M., Alexander, M. R., Tucker, G. A., Barrett, D. A. Rapid detection of Peptide markers for authentication purposes in raw and cooked meat using ambient liquid extraction surface analysis mass spectrometry. Anal. Chem. 86, 10257-10265 (2014).
- Sentandreu, M. A., Fraser, P. D., Halket, J., Patel, R., Bramley, P. M. A Proteomic-Based Approach for Detection of Chicken in Meat Mixes. J. Proteome Res. 9, 3374-3383 (2010).
- Elliott, M. H., Smith, D. S., Parker, C. E., Borchers, C. Current trends in quantitative proteomics. J. Mass Spectrom. 44, 1637-1660 (2009).
- MacLean, B., et al. Skyline: an open source document editor for creating and analyzing targeted proteomics experiments. Bioinformatics. 26, 966-968 (2010).
- Keeton, J. T., Ellerbeck, S. M., Nunez de Gonzalez, M. T., Devine, C., Dikeman, M. . Encyclopedia of Meat Sciences. 1, 235-243 (2014).
- Montowska, M., Alexander, M. R., Tucker, G. A., Barrett, D. A. Rapid Detection of Peptide Markers for Authentication Purposes in Raw and Cooked Meat Using Ambient Liquid Extraction Surface Analysis Mass Spectrometry. Anal. Chem. 86, 10257-10265 (2014).
재인쇄 및 허가
JoVE'article의 텍스트 или 그림을 다시 사용하시려면 허가 살펴보기
허가 살펴보기더 많은 기사 탐색
This article has been published
Video Coming Soon
Copyright © 2025 MyJoVE Corporation. 판권 소유