
Aby wyświetlić tę treść, wymagana jest subskrypcja JoVE. Zaloguj się lub rozpocznij bezpłatny okres próbny.
Method Article
Eye-tracking Technology and Data-mining Techniques used for a Behavioral Analysis of Adults engaged in Learning Processes
W tym Artykule
Podsumowanie
We present a protocol for a behavioral analysis of adults (ages 18 to 70-year-old) engaged in learning processes, undertaking tasks designed for Self-Regulated Learning (SRL). The participants, university teachers and students, and adults from the University of Experience, were monitored with eye-tracking devices and the data were analyzed with data-mining techniques.
Streszczenie
Behavioral analysis of adults engaged in learning tasks is a major challenge in the field of adult education. Nowadays, in a world of continuous technological changes and scientific advances, there is a need for life-long learning and education within both formal and non-formal educational environments. In response to this challenge, the use of eye-tracking technology and data-mining techniques, respectively, for supervised (mainly prediction) and unsupervised (specifically cluster analysis) learning, provide methods for the detection of forms of learning among users and/or the classification of their learning styles. In this study, a protocol is proposed for the study of learning styles among adults with and without previous knowledge at different ages (18 to 69-year-old) and at different points throughout the learning process (start and end). Statistical analysis-of-variance techniques mean that differences may be detected between the participants by type of learner and previous knowledge of the task. Likewise, the use of unsupervised learning clustering techniques throws light on similar forms of learning among the participants across different groups. All these data will facilitate personalized proposals from the teacher for the presentation of each task at different points in the chain of information processing. It will likewise be easier for the teacher to adapt teaching materials to the learning needs of each student or group of students with similar characteristics.
Wprowadzenie
Eye-tracking methodology applied to behavioral analysis in learning
Eye-tracking methodology, among other functional uses, is applied to the study of human behavior, specifically during task resolution. This technique facilitates monitoring and analysis during the completion of learning tasks1. Specifically, the attention levels of students at different points of the learning process (start, development, and end) in different subjects (History, Mathematics, Science, etc.) can be studied with the use of eye-tracking technology. In addition, if the task includes the use of videos with a voice that guides the learning process, Self-Regulated Learning (SRL) is facilitated. Therefore, the implementation of eye-tracking technology in the analysis of tasks to which SRL (that include the use of videos) is proposed as a significant resource to understand how learning is developed2,3,4. This combination will also mean that the differences between instructional methods (with or without SRL, etc.) may be checked with different types of students (with or without prior knowledge, etc.)5. In contrast, the presentation of multi-channel information (simultaneous presentation of both auditory and visual information, whether verbal, written, or pictorial) can facilitate both the recording and the analysis of relevant versus non-relevant information from the above-mentioned variables6. Students with prior knowledge exposed to multimedia learning channels appear to learn more effectively than those with little or no prior knowledge. Students with high levels of prior knowledge of the subject matter will integrate textual and graphical information more effectively7. This functionality has been observed in the learning of texts8 that include images9. Eye-tracking technology offers information on where attention is focused and for how long. These data give insight into the development of a learning process in a more precise way than through the simple observation of the resolution process during the completion of a task. Also, the analysis of these indicators facilitates the study of whether the student develops deep or superficial learning. Furthermore, the relationship between these data and the learning results facilitates the validation of the information obtained with eye-tracking technology4,10. In fact, this technique together with SRL are increasingly used in Higher Education and in Adult Education11 learning environments, both on regulated and on non-regulated courses12.
Eye-tracking technology offers different metrics: distance, speed, acceleration, density, dispersion, angular velocity, transitions between Areas of Interest (AOI), sequential order of AOI, visits in the fixations, saccades, scan path and heat map parameters. However, the interpretation of these data is complex and requires the use of supervised (regression, decision trees, etc.) and unsupervised (k-means cluster techniques, etc.)13,14 data-mining techniques. These metrics can be applied for monitoring the behavior of the same subject over time or for a comparison between several subjects and their performance with the same task15, by analyzing the difference between participants with previous knowledge versus no previous knowledge16. Recent research11,17 has revealed that novice apprentices fixate longer on the stimuli (i.e., there is a greater fixation frequency while similar scan-path patterns are recorded). The average duration of fixation was longer for experts than for novices. The experts presented their focus of attention on the middle points of the information (proximal and central), differences that may also be seen in the visualization points within the AOI on the heat maps.
Interpretation of metrics in eye tracking
Recent studies18 have indicated that information acquisition is related to the number of ocular fixations on the stimuli. Another important metric is the saccade, which is defined as the rapid and sudden movement of a fixation with an interval of [10 ms, 100 ms]. Sharafi et al. (2015)18 found differences in the number of saccades, depending on the information coding phase of the student. Another relevant parameter is the scan-path, a metric that captures the chronological order of the steps that the participant performs for the resolution of the learning task within the AOI defined by the researcher18. Similarly, eye-tracking technology can be used to predict the participant's level of understanding, which appears to be related to the number of fixations. Recent studies have indicated that variability in gaze behavior is determined by the properties of the image (position, intensity, color, and orientation), the instructions for performing the task, and the type of information processing (learning style) of the participant. These differences are detected by analyzing the student's interaction with the different AOI19. Quantitative20 (frequency analysis) and/or qualitative or dynamic21 (scan path) techniques can be used to analyze the data collected from the different metrics. The former techniques are analyzed with traditional statistical techniques (frequency analysis, mean difference, variance difference, etc.) and the latter are analyzed with Machine Learning techniques (Euclidean distances with string-edit methods21,22, and clustering17). The application of these techniques facilitates clustering, by considering different characteristics of the subjects. One study17 found that the more expert the student, the more effective the spatial and temporal information processing strategy that is implemented. A descriptive table of the measurement parameters that were used in this study can be consulted below in Table 1.
Table 1: Most representative parameters that can be obtained with the eye-tracking technique, adapted from Sáiz, Zaparaín, Marticorena, and Velasco (2019).20 Please click here to download this Table.
Application of the eye-tracking methodology to the study of the learning process
The use of the technological advances and the data-analysis techniques described above5 will add greater precision to behavioral analysis of learners during problem solving in the different phases of information processing (task initiation, information processing, and task resolution). It will all facilitate individual behavioral analysis, which will in turn permit the grouping of students with similar characteristics24. Likewise, predictive techniques (decision trees, regression techniques, etc.)25 can be applied to learning, related both to the number of fixations and to the task-resolution results of each student. This functionality is a very important advance in the knowledge of how each student learns and for the proposal of personalized learning programs within different groups (people with or without learning difficulties26). Therefore, the use of this technique will contribute towards the achievement of personalization and optimization of learning27. Life-long learning must be understood as a cycle of continuous improvement since the knowledge of society is constantly advancing and progressing. Evolutionary psychology indicates that resolution skills and effectiveness in information processing decrease with age. Specifically, saccade frequency, amplitude, and speed of eye movements among adults have been found to decrease with age. In addition, at older ages, attention is focused on the lower areas of visual scenes, which is related to deficits in working memory14. Nevertheless, activation increases in the frontal and prefrontal areas at an older age, which appears to compensate for these deficits in task resolution. This aspect includes the level of previous knowledge and the cognitive compensation strategies that the subject can apply. Experienced participants learn more efficiently, since they manage attention more effectively, due to the application of automated supervision processes28. In addition, if the information to be learned is imparted through SRL techniques, the aforementioned deficiencies are mitigated17. The use of such techniques means that visual tracking patterns are very similar, both in subjects without prior knowledge and in subjects with prior knowledge7.
In summary, the analysis of multimodal-multichannel data on SRL obtained with the use of advanced learning (eye-tracking) technologies is key to understanding the interaction between cognitive, metacognitive, and motivational processes, and their impact on learning29. The results and the study of differences in learning have implications for the design of learning materials and intelligent tutoring systems, both of which will enable personalized learning that is likely to be more effective and satisfactory for the student30.
In this research, there were two investigation questions asked: (1) Will there be significant differences in the learning results and in the ocular fixation parameters between students and expert versus non-expert teachers in Art History differentiating students with official degrees versus students with non-official degrees (University of Experience - Adult education)? and (2) Will clusters of each participant with learning results and ocular fixation parameters coincide with the type of participants (students with official degrees, students with non-official degrees (University of Experience - Adult education) and teachers)?
Access restricted. Please log in or start a trial to view this content.
Protokół
This protocol was performed in compliance with the procedural regulations of the Bioethical Committee of the University of Burgos (Spain) nº Nº IR27/2019. Prior to their participation, the participants had been made fully aware of the research objectives and had all provided their informed consent. They received no financial compensation for their participation.
1. Participant recruitment
- Recruit participants from among a group of adults within two environments (students and teachers), with an age rank of 18 to 69 year-old in the environment of Higher Education (formal and non-formal education).
- Include participants with normal or corrected-to-normal vision and hearing.
- Exclude participants with neurological, psychiatric, and sleep disorders, disabilities related to educational special needs, perceptual difficulties (impaired sight and hearing), and cognitive disabilities.
NOTE: In this study we worked with a sample of 40 participants, 6 students from the University of Experience (one participant was excluded in the category of students from the university of experience because of visual difficulties), 25 university professors in the disciplines of health sciences, engineering, and history and heritage, and 9 undergraduate and master's students following courses in health sciences, engineering, and history and heritage. The participants had no cognitive, hearing, nor visual problems, and they all had normal or corrected-to-normal vision (Table 2). That is why, one of the participants was eliminated before starting the experiment because nystagmus had been detected on him and therefore the task was applied to a sample of 39 participants. The participants received no financial nor professional compensation; that is why participants' motivation was high as it was only based on their interest to know how this eye-tracking method works during a learning process related with cultural heritage, specifically the origin of European monasteries.
Table 2. Characteristics of the sample. Please click here to download this Table.
2. Experimental Procedure
- Session 1: Collection of informed consent, personal data, and background knowledge
- Obtain informed consent. Before the test, inform each participant of the aims of the study and the collection, treatment, and storage of their data. The agreement of each participant is given by signing the informed consent form.
NOTE: Participation in this study was voluntary and there was no financial reward. This aspect ensured that the completion of the tasks had no economic motivation. Before starting the task, the interviewer, an expert in the field, fills up a questionnaire with questions on age, gender, occupation, and prior knowledge of the subject matter, in this case, the origin and historical development of monasteries in Europe (see Table 3). This study is part of a European Project (2019-1-ES01-KA204-095615-Coordinator 6) on adult learning about the Cultural Heritage of Humanity throughout life; that is why this type of task was chosen. Each investigator will choose the topic depending on his or her work field.
- Obtain informed consent. Before the test, inform each participant of the aims of the study and the collection, treatment, and storage of their data. The agreement of each participant is given by signing the informed consent form.
Table 3. Interview questionnaire. Please click here to download this Table.
- Session 2: Calibration
- Inform the participant about how eye-tracking technology works and how the information will be collected and recorded and calibrate: "We will use eye-tracking technology to observe the completion of the learning task on the origin and the development of European monasteries. Eye tracking is a technology that allows you to follow your gaze while you perform the activity and it has no side effects, nor it is invasive, since in this study only eye tracking is recorded".
- Explain to the participant that a valid test requires proper positioning. Have the participant must sit at a certain distance [45 to 60 cm] from the monitor. The distance will depend on the height of the participant, the lower the height, the shorter the distance.
- Inform the participant that a series of points will appear on the cardinal points of the screen and that as each point appears the participant must observe it with the eyes. The participant can move from one point to another by using the "enter" cursor. The calibration phase has a duration of 10-15 minutes.
NOTE: An Eye-tracking iViewer XTM, SMI Experimenter Center 3.0, and SMI Be Gaze and a monitor with a resolution of 1680×1050 were used for the task-resolution exercise. This equipment registers ocular movements, their coordinates, and pupillary diameters of each eye. In this study, 60 Hz were applied, scan-path metrics and dynamic scan-path metrics were used, and AOI statistics were determined. - Check the calibration setting. The professional supervising the test analyzes the calibration setting on the control screen.
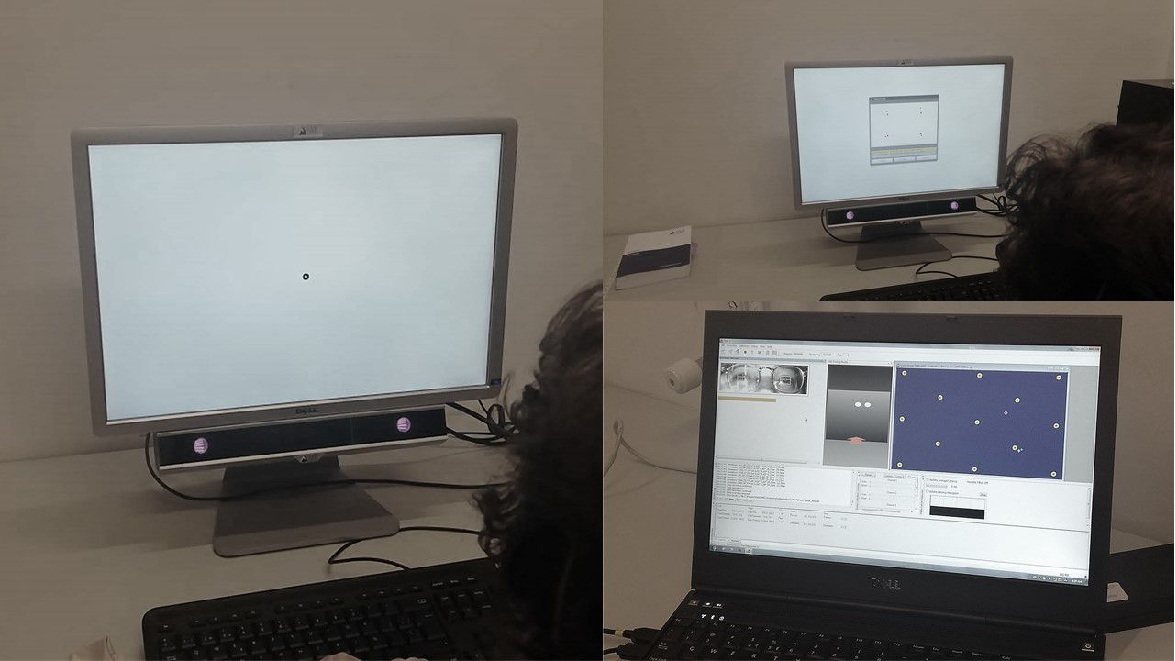
- Perform calibration through the calibrating system that is included in the Eye-tracking iViewer XTM. Before starting this task, each participant realizes a visual follow-up of four points on a screen to the four corners (up-right, up-left, down-right, down-left). Afterward, the software has an execution verification process of the right position of these stimuli and gives information on the parameter adjustment in degrees. If this adjustment is situated between 0.6º ± 1 in the right and left eye, it is considered that the calibration is correct, and the task execution starts. An example of the process can be verified in Figure 1.
NOTE: Correct task completion is considered when the degrees in the right and left eye are set at 0.6º ± 1 standard deviation. In this study, two calibrations were detected among the group of university professors that exceeded the adjustment criterion of 0.6º ± 1 and two participants were therefore removed. The 25 participants in the first sample were therefore reduced to 23 participants.
- Perform calibration through the calibrating system that is included in the Eye-tracking iViewer XTM. Before starting this task, each participant realizes a visual follow-up of four points on a screen to the four corners (up-right, up-left, down-right, down-left). Afterward, the software has an execution verification process of the right position of these stimuli and gives information on the parameter adjustment in degrees. If this adjustment is situated between 0.6º ± 1 in the right and left eye, it is considered that the calibration is correct, and the task execution starts. An example of the process can be verified in Figure 1.

Figure 1. Process of eye-tracking calibration Please click here to view a larger version of this figure.
- Session 3: Performing the learning task
- Explain the contents of the task to the participant. An expert in instructional psychology explains to the participant what the task will consist of and how to perform it: "The video is 1:14 seconds long and consists of 5 voice-over images. At the end, the participant is invited to complete a small crossword puzzle to check that the information presented in the video has been understood".
- Watch the video clip. The video used in the task can be viewed at the following link: https://youtu.be/HlGGgrYDTFs.
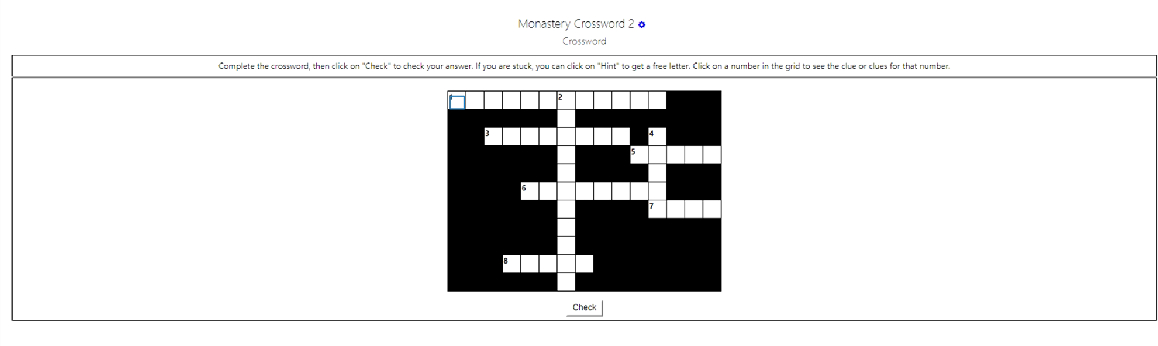
NOTE: The task consists in watching a video that offers information on the origins of European monasteries. The information has been elaborated by a specialist, an Art History teacher. The information is organized in two channels, one visual which includes images and written information presented as outlines and another audio one because a SRL specialist teacher is speaking throughout the video insisting on the most significant contents using verbal emphasis. - Performing the crossword puzzle on a Moodle-based virtual platform. Clicking on the crossword icon takes the participant to a virtual platform where the crossword may be completed, to check whether the knowledge has been acquired. The crossword puzzle is presented in Figure 2.

Figure 2. Crossword puzzle to check the acquired knowledge. Please click here to view a larger version of this figure.
- Session 4: Data analysis
- Choose the Areas Of Interest (AOI). AOIs are defined in the video and are divided into AOIs that contain relevant information versus AOIs that include non-relevant information.
NOTE: The AOI assignation is realized by the experimenter who decides which are the relevant or irrelevant AOIs in relation to the presented information. - Extract the database relating to the parameters for AOI Fixations ("Event Start Trial Time", "Event End Trial Time" and "Event Duration"; "Fixation Position X", "Fixation Position Y", "Fixation Average Pupil Size", "Fixation Average Pupil Size Y px", "Fixation Average Pupil Diameter", "Fixation Dispersion X" and "Fixation Dispersion Y").
- Import the database into a statistical processing software package and select the option analyze and then classify, followed by the option k-means cluster. Then select cross-table in the statistical software package, for example SPSS, followed by the 'ANOVA' option, to analyze the differences between the participants (type of adult groups and degree of prior knowledge) with regard to their AOI Fixation parameters31.
NOTE: Clustering or cluster analysis is an 'unsupervised' machine-learning technique, and, within k-means, it is a grouping method, the aim of which is to partition a set of n observations into k groups, in which each observation belongs to the group with the closest mean value. In this experiment, k-means clustering was used to check the clusters of participants in the learning task. This correspondence is important, because it offers the teacher or therapist information on the homogeneous functional development of users that goes beyond the diagnosis, providing information to propose similar intervention programs in some areas of functional development. This option is expected to facilitate full use of the educational or therapeutic service and its personal and material resources. - Perform a visualization analysis of the data (descriptive and cluster analysis) that are processed, using a visualization software such as Orange32.
- Extract the data on the parameters of Detailed Statistics: Dwell Time, Glance Duration, Diversion Duration, Glance Count, Fixation Count, Average Fixation, and Duration then import that database into a statistical software package. Select the option 'ANOVA' in the statistical package and then conduct a visualization analysis of the data that were processed (means). Use the spreadsheet to generate a spider chart and specific bar graphs for the groups of participants.
- Choose the Areas Of Interest (AOI). AOIs are defined in the video and are divided into AOIs that contain relevant information versus AOIs that include non-relevant information.
- Session 5: Personalized learning proposals
- Perform an intervention program to improve learning outcomes among the participants detected in the cluster analysis, due to their lower scores.
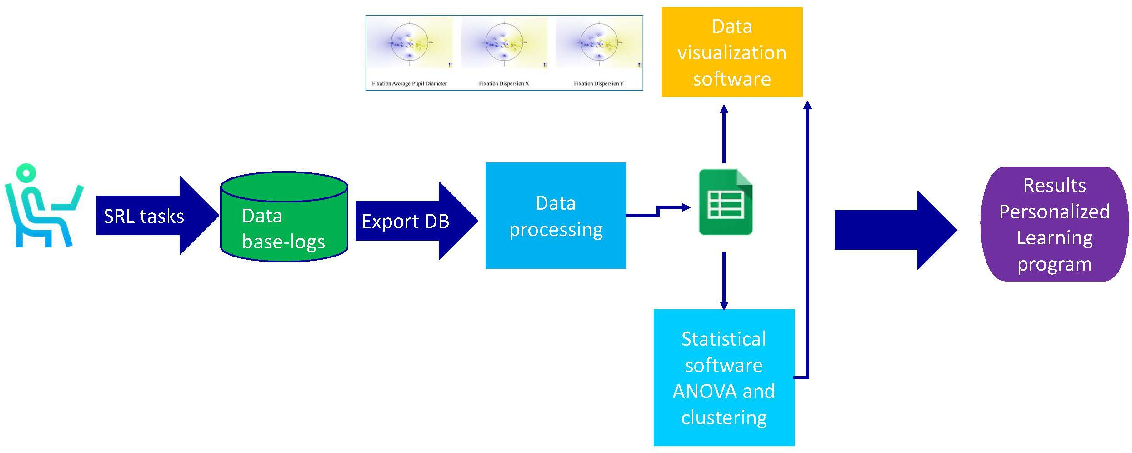
NOTE: A summary of the phases followed in the experimental Procedure is shown in Figure 3.
- Perform an intervention program to improve learning outcomes among the participants detected in the cluster analysis, due to their lower scores.

Figure 3. Phases of the experimental procedure. Please click here to view a larger version of this figure.
Access restricted. Please log in or start a trial to view this content.
Wyniki
The 36 participants recruited for the present study were from three groups of adults (students from the university of experience, university professors, and undergraduate and master's degree students) with ages ranging between [18 and 69] years (Table 2). The protocol was tested over 20 months at the University of Burgos. An outline of the development can be seen in Table 4.
Tab...
Access restricted. Please log in or start a trial to view this content.
Dyskusje
The research results indicated that the average fixation duration on the relevant stimuli was longer among participants with previous knowledge. Likewise, the focus of attention on this group is on the middle points of information (proximal and distal)7. The results of this study have revealed differences in the way participants processed the information. Furthermore, their processing was not always linked to the initial grouping (University of Experience Students, University Teachers and Graduate...
Access restricted. Please log in or start a trial to view this content.
Ujawnienia
The authors declare that they have no competing financial interests.
Podziękowania
The work has been developed within the Project "Self-Regulated Learning in SmartArt Erasmus+ Adult Education" 2019-1-ES01-KA204-095615-Coordinator 6, funded by the European Commission. The video of the task completion phase had the prior informed consent of Rut Velasco Sáiz. We appreciate the participation of teachers and students in the task implementation phase.
Access restricted. Please log in or start a trial to view this content.
Materiały
| Name | Company | Catalog Number | Comments |
| iViewer XTM | iViewer | ||
| SMI Experimenter Center 3.0 | SMI | ||
| SMI Be Gaze | SMI |
Odniesienia
- van Marlen, T., van Wermeskerken, M., Jarodzka, H., van Gog, T. Effectiveness of eye movement modeling examples in problem solving: The role of verbal ambiguity and prior knowledge. Learning and Instruction. 58, 274-283 (2018).
- Taub, M., Azevedo, R., Bradbury, A. E., Millar, G. C., Lester, J. Using sequence mining to reveal the efficiency in scientific reasoning during STEM learning with a game-based learning environment. Learning and Instruction. 54, 93-103 (2018).
- Cloude, E. B., Taub, M., Lester, J., Azevedo, R. The Role of Achievement Goal Orientation on Metacognitive Process Use in Game-Based Learning. Artificial Intelligence in Education. Isotani, S., Millan, E., Ogan, A., Hastings, P., McLaren, B., Luckin, R. , Springer International Publishing. Switzerland. 36-40 (2019).
- Azevedo, R., Gašević, D. Analyzing Multimodal Multichannel Data about Self-Regulated Learning with Advanced Learning Technologies: Issues and Challenges. Computers in Human Behavior. 96, 207-210 (2019).
- Sáiz-Manzanares, M. C., Rodríguez-Diez, J. J., Marticorena-Sánchez, R., Zaparín-Yáñez, M. J., Cerezo-Menéndez, R. Lifelong learning from sustainable education: An analysis with eye tracking and data mining techniques. Sustainability. 12 (5), 2-18 (2020).
- Alemdag, E., Cagiltay, K. A systematic review of eye tracking research on multimedia learning. Computers & Education. 125, 413-428 (2018).
- Ho, H. N. J., Tsai, M. -J., Wang, C. -Y., Tsai, C. -C. Prior knowledge and online inquiry-based science reading: evidence from eye tracking. International Journal of Science and Mathematics Education. 12, 525-554 (2014).
- Catrysse, L., Gijbels, D., Donche, V. It is not only about the depth of processing: What if eye am not interested in the text. Learning and Instruction. 58, 284-294 (2018).
- Mayer, R. E. Using multimedia for e-learning. Journal of Computer Assisted Learning. 33 (5), 403-423 (2017).
- Prokop, M., Pilař, L., Tichá, I. Impact of think-aloud on eye-tracking: A comparison of concurrent and retrospective think-aloud for research on decision-making in the game environment. Sensors. 20 (10), (2020).
- DuMouchel, W. Data Squashing: Constructing Summary Data Sets. Handbook of Massive Data Sets. Abello, J., Pardalos, P. M., Resende, M. G. C. , Springer. Boston, MA, US. 579-591 (2002).
- Stull, A. T., Fiorella, L., Mayer, R. E. An eye-tracking analysis of instructor presence in video lectures. Computers in Human Behavior. 88, 263-272 (2018).
- König, S. D., Buffalo, E. A. A nonparametric method for detecting fixations and saccades using cluster analysis: Removing the need for arbitrary thresholds. Journal of Neuroscience Methods. 30 (227), 121-131 (2014).
- Maltz, M., Shinar, D. Eye Movements of Younger and Older Drivers. Human Factors. 41 (1), 15-25 (1999).
- Burch, M., Kull, A., Weiskopf, D. AOI rivers for visualizing dynamic eye gaze frequencies. Computer Graphics Forum. 32 (3), 281-290 (2013).
- Dzeng, R. -J., Lin, C. -T., Fang, Y. -C. Using eye-tracker to compare search patterns between experienced and novice workers for site hazard identification. Safety Science. 82, 56-67 (2016).
- Kurzhals, K., Weiskopf, D. Space-time visual analytics of eye-tracking data for dynamic stimuli. IEEE Transactions on Visualization and Computer Graphics. 19 (12), 2129-2138 (2013).
- Sharafi, Z., Soh, Z., Guéhéneuc, Y. -G. A systematic literature review on the usage of eye-tracking in software engineering. Information and Software Technology. 67, 79-107 (2015).
- Dalrymple, K. A., Jiang, M., Zhao, Q., Elison, J. T. Machine learning accurately classifies age of toddlers based on eye tracking. Scientific Reports. 9 (1), 6255(2019).
- Seifert, L., Cordier, R., Orth, D., Courtine, Y., Croft, J. L. Role of route previewing strategies on climbing fluency and exploratory movements. PLoS One. 12 (4), 1-22 (2017).
- Takeuchi, H., Habuchi, Y. A quantitative method for analyzing scan path data obtained by eye tracker. IEEE Symposium on Computational Intelligence and Data Mining, CIDM 2007. , Honolulu, HI, USA. 283-286 (2007).
- Takeuchi, H., Matsuda, N. Scan-path analysis by the string-edit method considering fixation duration. 6th International Conference on Soft Computing and Intelligent Systems, and 13th International Symposium on Advanced Intelligence Systems, SCIS/ISIS 2012. , Kobe, Japan. 1724-1728 (2012).
- Sáiz, M. C., Marticorena, R., Anaiz, Á, Zaparaín, M. J. Task analysis with eye tracking technology. srl at Smartart. II Congress of the International Scientific Association of Psychopedagogy Proceedings. Peralbo, M., Risso, A., Barca, A., Duarte, B., Almeda, L., Brenlla, J. C. , Asociacion Cientifica Internacional de Psicopedagogia. Coruña, Spain. 4093-4104 (2019).
- Khedher, A. B., Jraidi, I., Frasson, C. Tracking Students' Analytical Reasoning Using Visual Scan Paths. IEEE 17th International Conference on Advanced Learning Technologies (ICALT). , IEEE. Timisoara, Romania. 53-54 (2017).
- Xia, C., Han, J., Qi, F., Shi, G. Predicting Human Saccadic Scanpaths Based on Iterative Representation Learning. IEEE Trans Image Process. 8 (7), 3502-3515 (2019).
- Cerezo, R., Fernández, E., Gómez, C., Sánchez-Santillán, M., Taub, M., Azevedo, R. Multimodal Protocol for Assessing Metacognition and Self-Regulation in Adults with Learning Difficulties. Journal of Visualized Experiments. , e60331(2020).
- Scherer, R., Siddiq, F., Tondeur, J. The technology acceptance model (TAM): A meta-analytic structural equation modeling approach to explaining teachers' adoption of digital technology in education. Computers & Education. 128 (0317), 13-35 (2019).
- Bruder, C., Eißfeldt, H., Maschke, P., Hasse, C. Differences in monitoring between experts and novices. Proceedings of the Human Factors and Ergonomics Society Annual Meeting. 57 (1), 295-298 (2013).
- Azevedo, R., Gašević, D. Analyzing Multimodal Multichannel Data about Self-Regulated Learning with Advanced Learning Technologies: Issues and Challenges. Computers in Human Behavior. 96, 207-210 (2019).
- Taub, M., Azevedo, R. How Does Prior Knowledge Influence Eye Fixations and Sequences of Cognitive and Metacognitive SRL Processes during Learning with an Intelligent Tutoring System. International Journal of Artificial Intelligence in Education. 29 (1), 1-28 (2019).
- IBM Corp. SPSS Statistical Package for the Social Sciences (SPSS) (Version 24). , Madrid, Spain. (2016).
- Orange Software Package. , Available from: https://orange.biolab.si/docs/ (2020).
Access restricted. Please log in or start a trial to view this content.
Przedruki i uprawnienia
Zapytaj o uprawnienia na użycie tekstu lub obrazów z tego artykułu JoVE
Zapytaj o uprawnieniaPrzeglądaj więcej artyków
This article has been published
Video Coming Soon
Copyright © 2025 MyJoVE Corporation. Wszelkie prawa zastrzeżone