
A subscription to JoVE is required to view this content. Sign in or start your free trial.
Method Article
Induction of Graft-versus-host Disease and In Vivo T Cell Monitoring Using an MHC-matched Murine Model
In This Article
Summary
Murine bone marrow transplantation is a widely used technique to study immunological mechanisms governing graft-versus-host disease in humans. The ability to monitor T cell trafficking patterns in vivo allows for detailed analysis of the development and perpetuation of T cell responses during graft-versus-host disease.
Abstract
Graft-versus-host disease (GVHD) is the limiting barrier to the broad use of bone marrow transplant as a curative therapy for a variety of hematological deficiencies. GVHD is caused by mature alloreactive T cells present in the bone marrow graft that are infused into the recipient and cause damage to host organs. However, in mice, T cells must be added to the bone marrow inoculum to cause GVHD. Although extensive work has been done to characterize T cell responses post transplant, bioluminescent imaging technology is a non-invasive method to monitor T cell trafficking patterns in vivo.
Following lethal irradiation, recipient mice are transplanted with bone marrow cells and splenocytes from donor mice. T cell subsets from L2G85.B6 (transgenic mice that constitutively express luciferase) are included in the transplant. By only transplanting certain T cell subsets, one is able to track specific T cell subsets in vivo, and based on their location, develop hypotheses regarding the role of specific T cell subsets in promoting GVHD at various time points. At predetermined intervals post transplant, recipient mice are imaged using a Xenogen IVIS CCD camera. Light intensity can be quantified using Living Image software to generate a pseudo-color image based on photon intensity (red = high intensity, violet = low intensity).
Between 4-7 days post transplant, recipient mice begin to show clinical signs of GVHD. Cooke et al.1 developed a scoring system to quantitate disease progression based on the recipient mice fur texture, skin integrity, activity, weight loss, and posture. Mice are scored daily, and euthanized when they become moribund. Recipient mice generally become moribund 20-30 days post transplant.
Murine models are valuable tools for studying the immunology of GVHD. Selectively transplanting particular T cell subsets allows for careful identification of the roles each subset plays. Non-invasively tracking T cell responses in vivo adds another layer of value to murine GVHD models.
Protocol
1. Lethal Irradiation
- Place up to 10 recipient mice into a microisolator cage compatible with the irradiator to be used.
- Irradiate in 2 equal doses summing total dose (total dose = 9 cGy for BALB.B recipients). Second irradiation should be 3 hr after first. Injection should occur between 4-6 hr after final irradiation. Irradiate mice in either Cs137 source or RS2,000, irradiator.
- Following the second radiation dose, store mice in microisolator cage with acidified water until the time of transplant.
2. Splenocyte Preparation
- Euthanize one donor mouse according to institutional guidelines. Each donor generally yields 75x106 - 125x106 splenocytes. Using CD8 purification kits, each mouse generally yields 6x10⁶ - 12x106 CD8 T cells.
- Remove the spleen by first making a vertical 2 cm incision 2 cm right of the midline directly under the rib cage. Cut through the fur, skin, and visceral membrane.
- Remove spleen and create single cell suspension by placing spleen in 40 μl mesh screen in a Petri dish with 1640 RPMI with 5% FBS. Use a syringe plunger to break apart the spleen until the entire spleen has been passed through mesh screen.
- Repeat this process for each WT and L2G85.B6 donor. Collect all the WT single cell suspensions in 1-50 ml conical tube, and collect all the L2G85.B6 single cell suspensions in a separate 50 ml conical tube.
- Centrifuge cells at 1,200 rpm for 10 min at 4 °C. Resuspend pellets in 1640 RPMI with 5% FBS and count cells.
3. Bone Marrow Preparation
- Remove skin from one hind limb of a donor mouse.
- Carefully cut away as much muscle tissue as possible from femur and tibia/fibula.
- Remove hind limb by cutting femur away at the hip joint. Cut away rear paw just below tibia/fibula intersection. All bone cuts should be made using sturdy scissors.
- Carefully remove any remaining muscle tissue. Cut off fibula-relatively little bone marrow is found in fibula and not worth the effort.
- Place hind limb in cold 1640 RPMI 5% FBS and repeat process with the second hind limb. Each mouse should yield between 20x106 - 40x106 bone marrow cells.
4. Bone Marrow Removal
- Remove one hind limb from media and place in large Petri dish with a small amount of cold media (~1 ml).
- Cut away the knee joint. Using a syringe (volume > 5 ml), insert subcutaneous needle into tibia and depress syringe until all red material is removed from interior of tibia. Repeat process with femur. Discard remaining bones devoid of bone marrow. Repeat process with second hind limb.
- Create single cell suspension by pipetting media containing bone marrow into large Petri dish and use syringe plunger and 40 μl mesh screen. Pipette single cell suspension into 50 ml conical tube and keep on ice.
5. CD3 Depletion
There are a variety of ways to deplete CD3+ cells from the bone marrow. Our lab uses a kit made by Miltenyi Biotec (CD3-biotin - 130-093-021). Deplete CD3+ cells from the bone marrow following manufacturer's protocol. The buffer for Miltenyi kits will henceforth be called MACS Buffer (2 mM EDTA, 0.5% BSA in PBS, pH 7.2).
- Wash cells by centrifuging splenocytes and bone marrow cells at 1200 rpm for 10 min at 4 °C and count cells.
- Remove ALL supernatant. Resuspend bone marrow cells in 100 μl per 10 million bone marrow cells in MACS Buffer.
- Continue with CD3 depletion using manufactures' protocol.
- Wash CD3 depleted bone marrow cells 3 times in sterile PBS. Count CD3 depleted bone marrow cells and resuspend at an appropriate volume to inject 107 cells.
6. L2G85.B6 CD8+ T Cell Purification
There are a variety of ways to purify CD8 T cells from L2G85.B6 mice. Also, there are several ways to deplete CD8 T cells from WT splenocyte donors. Our lab uses kits from Miltenyi Biotec (CD8 depletion - 130-049-401, CD8 purification - 130-095-236).
- Resuspend the WT pellet in 90 μl MACS Buffer per 107 cells. Continue with CD8 T cell depletion according to manufactures' protocol (CD8 depletion - 130-049-401).
- Resuspend the L2G85.B6 pellet in 40 μl MACS Buffer per 107 cells. Continue with CD8 T cell purification according to manufactures' protocol (CD8 purification - 130-095-236).
- Count each cell population and wash each population 3 times with sterile PBS. Resuspend each population in appropriate volume to inject 18x106 WT (CD8 depleted) splenocytes and 2x10⁶ L2G85.B6 purified CD8 T cells.
7. Injection Preparation
- Combine 107 CD3 depleted bone marrow cells, 18x106 WT (CD8 depleted) splenocytes, and 2x10⁶ L2G85.B6 purified CD8 T cells in a microcentrifuge tube. Wash with sterile PBS and resuspend in 300 μl.
- Inject cell preparation into the tail vein of recipient mice. Injections should be done using 28 gauge needles.
- Store mice in microisolator cage with acidified water. Score mice daily using scoring GVHD scoring system developed by Cooke et al1.
8. Bioluminescent Imaging
- Six days post transplant, inject recipient mice with 4 mg D-luciferin. Allow 5 min for luciferin to react with luciferase.
- Anesthetize mouse in isoflurane chamber of bioluminescence imager and image recipients for 5 min with small binning. This will create a high resolution image while gathering as many events as possible.
- Analyze data using Living Image software. The scale of the pseudo-color image can be changed to yield the best results. However, it is imperative that the same scale be used across experiments.
- Regions of interest can be created using Living Image software and light emittance can be quantified by calculating the flux (photons/sec) being emitted from each region of interest.
9. Representative Results
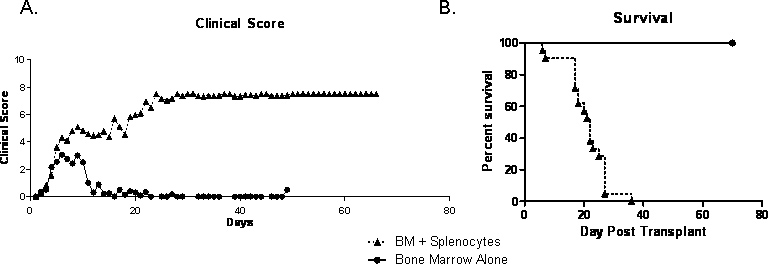
Approximately 7-10 days post transplant, mice begin showing clinical signs of GVHD. Mice appear scruffy due to lack of grooming. Recipients will also begin to lose weight between 7-10 days post transplant. Activity and posture of recipient mice will remain relatively normal until approximately day 12-14 post transplant. Cumulative GVHD scores will steadily increase through the first 2-3 weeks post transplant (Figure 1A). Disease course is quite variable between mice; however, recipients should uniformly succumb to GVHD by 30-40 days post transplant (Figure 1B).
Figure 2 shows recipient mice that were imaged 6 days post transplant. Pseudo-colored scale shows varying light emittance throughout the body with the highest light intensity being emitted in the spleen and the gut. CD8 T cell accumulation in the gut is consistent with previous findings6. Recipient mice can be placed back in microisolator cage to be imaged at a later time point or euthanized for ex vivo imaging.
| Criteria | Grade 0 | Grade 1 | Grade 2 |
| Weight loss (wkly.) | < 10% | > 10% - < 25% | >25% |
| Posture | Normal | Hunching only at rest | Several hunching; impairs movement |
| Activity | Normal | Mild to moderate decrease in activity | Stationary unless stimulated |
| Fur texture | Normal | Mild to moderate ruffling | Severe ruffling/poor grooming |
| Skin texture | Normal | Scaling of paws/tail | Obvious areas of denuded skin |
Table 1. Cooke et al developed this scoring system in 19961. Mice should be scored daily on each of the criteria on the left. Each mouse is given a score of 0-2 for each criteria and the total score is a sum of all the individual scores.

Figure 1. Lethally irradiated BALB.B were transplanted with 107 bone marrow cells alone or with 18x106 CD8 T cell depleted WT splenocytes and 2x10⁶ purified L2G85.B6 CD8 T cells. A) Clinical score data of recipients of bone marrow alone or with CD8 T cell depleted WT splenocytes and purified L2G85.B6 CD8 T cells. B) Survival data of recipients of bone marrow alone or with CD8 T cell depleted WT splenocytes and purified L2G85.B6 CD8 T cells. Click here to view larger figure.

Figure 2. Lethally irradiated BALB.B mice were transplanted with 107 bone marrow cells alone or with 18x106 CD8 T cell depleted WT splenocytes and 2x10⁶ purified L2G85.B6 CD8 T cells. Recipients were injected with 4 mg D-luciferin via intraperitoneal injection and were imaged using Xenogen IVIS for 5 min at small binning. Pseudo-colored images are shown where purple represents low intensity and red represents high intensity Regions of interest were drawn around the entire mouse and total flux (photons/sec) were quantified.

Figure 3. Lethally irradiated BALB.B mice were transplanted with 107 bone marrow cells alone or with 18x106 CD8 T cell depleted WT splenocytes and 2x10⁶ purified L2G85.B6 CD8 T cells. Recipients were injected with 4 mg D-luciferin via intraperitoneal injection and were imaged using Xenogen IVIS for 5 min at small binning. Pseudo-colored images are shown where purple represents low intensity and red represents high intensity. Recipients were imaged on A) day 4, B) day 6, and C) day 8 post transfer.
Discussion
The protocol for inducing GVHD in mice presented here represents a clinically relevant model of murine GVHD. Originally established by Berger et al. in 1994, the C57Bl/6 into BALB.B strain combination is MHC-matched, with GVHD mortality mediated by CD4 dependent, CD8 T effectors2, highly similar to the most common clinical scenario3. It is known that transplanting CD8 T cells alone does not cause GVHD in this model; however, disease progression is significantly worse when both CD4 and CD8 T...
Disclosures
No conflicts of interest declared.
Acknowledgements
We are indebted to Alice Gaughan and Jiao-Jing Wang whose outstanding technical support, intellectual input, and moral support were instrumental in moving these studies ahead. These studies were supported by the NIH grant AI036532 to GAH.
Materials
| Name | Company | Catalog Number | Comments |
| RPMI 1640 | Invitrogen | 12633-012 | |
| Fetal Calf Serum | Invitrogen | 10439016 | |
| 40 μM Cell Strainer | BD Biosciences | 352340 | |
| CD3e-Biotin | Miltenyi Biotec | 130-093-021 | |
| Anti-Biotin Microbeads | Miltenyi Biotec | 130-091-147 | |
| CD8a Microbeads | Miltenyi Biotec | 130-049-401 | Used to deplete CD8 T cells from spleen. |
| CD8a Purification Antibody Cocktail | Miltenyi Biotec | 130-095-236 | Used to purify CD8 T cells from spleen. |
| D-Luciferin | Caliper Life Sciences | 122796 |
References
- Cooke, K. R. An experimental model of idiopathic pneumonia syndrome after bone marrow transplantation: The roles of minor H antigens and endotoxin. Blood. 88, 3230-3239 (1996).
- Berger, M. T cell subsets involved in lethal graft-versus-host disease directed to immunodominant minor histocompatibility antigens. Transplantation. 57, 1095-1102 (1994).
- Nimer, S. D. Selective depletion of CD8+ cells for prevention of graft-versus-host disease after bone marrowtransplantation. A randomized controlled trial. Transplantation. 57, 82-87 (1994).
- Korngold, R., Sprent, J. Surface markers of T cells causing lethal graft-vs-host disease to class I vs class II H-2 differences. Journal of Immunology. 135, 3004-3010 (1985).
- Cao, Y. A. Molecular imaging using labeled donor tissues reveals patterns of engraftment, rejection, and survival in transplantation. Transplantation. 80, 134-139 (2005).
- Asady, R. E. l. TGF-{beta}-dependent CD103 expression by CD8(+) T cells promotes selective destruction of the host intestinal epithelium during graft-versus-host disease. J. Exp. Med. 201, 1647-1657 (2005).
- Larson, R. S., Springer, T. A. Structure and function of leukocyte integrins. Immunol Rev. 114, 181-217 (1990).
- Karecla, P. I. Recognition of E-cadherin on epithelial cells by the mucosal T cell integrin alpha M290 beta 7 (alpha E beta 7). Eur. J. Immunol. 25, 852-856 (1995).
- Cepek, K. L. Adhesion between epithelial cells and T lymphocytes mediated by E-cadherin and the alpha E beta 7 integrin. Nature. 372, 190-193 (1994).
- Malarkannan, S. The molecular and functional characterization of a dominant minor H antigen, H60. J. Immunol. 161, 3501-3509 (1998).
Reprints and Permissions
Request permission to reuse the text or figures of this JoVE article
Request PermissionThis article has been published
Video Coming Soon
Copyright © 2025 MyJoVE Corporation. All rights reserved