Method Article
Investigation of Early Plasma Evolution Induced by Ultrashort Laser Pulses
In This Article
Summary
An experimental method to examine the early plasma evolution induced by ultrashort laser pulses is described. Using this method, high quality images of early plasma are obtained with high temporal and spatial resolutions. A novel integrated atomistic model is used to simulate and explain the mechanisms of early plasma.
Abstract
Early plasma is generated owing to high intensity laser irradiation of target and the subsequent target material ionization. Its dynamics plays a significant role in laser-material interaction, especially in the air environment1-11.
Early plasma evolution has been captured through pump-probe shadowgraphy1-3 and interferometry1,4-7. However, the studied time frames and applied laser parameter ranges are limited. For example, direct examinations of plasma front locations and electron number densities within a delay time of 100 picosecond (ps) with respect to the laser pulse peak are still very few, especially for the ultrashort pulse of a duration around 100 femtosecond (fs) and a low power density around 1014 W/cm2. Early plasma generated under these conditions has only been captured recently with high temporal and spatial resolutions12. The detailed setup strategy and procedures of this high precision measurement will be illustrated in this paper. The rationale of the measurement is optical pump-probe shadowgraphy: one ultrashort laser pulse is split to a pump pulse and a probe pulse, while the delay time between them can be adjusted by changing their beam path lengths. The pump pulse ablates the target and generates the early plasma, and the probe pulse propagates through the plasma region and detects the non-uniformity of electron number density. In addition, animations are generated using the calculated results from the simulation model of Ref. 12 to illustrate the plasma formation and evolution with a very high resolution (0.04 ~ 1 ps).
Both the experimental method and the simulation method can be applied to a broad range of time frames and laser parameters. These methods can be used to examine the early plasma generated not only from metals, but also from semiconductors and insulators.
Protocol
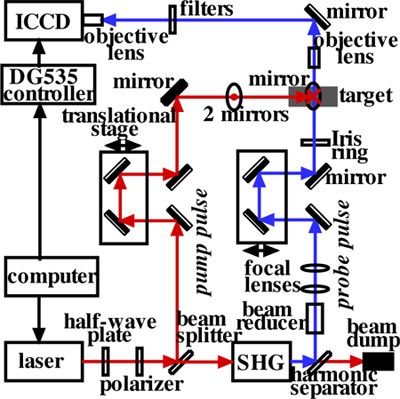
1. Optical System Setup (Fig. 1)
- Set up a half-wave plate and a polarizer following the laser output to adjust the laser pulse energy.
- Set up a beam splitter after the polarizer to split the laser pulse to two pulses: pump pulse and probe pulse.
- Use four reflecting mirrors and a manual translational stage to construct an optical delay device for the pump pulse.
- Use another four reflecting mirrors to guide the pump pulse to reach the target surface vertically.
- Set up a second harmonic generator (SHG) to transform the laser pulse wavelength from 800 nm to 400 nm.
- Use a harmonic separator to transmit the 800-nm pulse and reflect the 400-nm pulse.
- Set up a beam reducer and a pair of focally lenses to adjust the size and convergence of the probe pulse.
- Set up another optical delay device, as mentioned in Step 1.3, for the probe pulse.
- Use an Iris ring to adjust the area of the probe pulse and make sure the probe pulse pass the target surface horizontally and intersect with the pump pulse.
- Set up two objective lenses and several filters to generate the image of the plasma region to be received by the intensified charge-coupled device (ICCD) camera.
- Connect the computer, the laser, the ICCD camera and its controller using BNC cables or USB cables.
- Adjust the delay time of the camera controller till the camera captures an image of the probe pulse. Thus, the probe pulse and the camera are synchronized.
2. Pump-probe Synchronization
- Place a beam splitter at the intersection of the pump pulse and the probe pulse, and set up two photodiodes to receive these two pulses. These two photodiodes should have a same distance away from the beam splitter.
- Use an oscilloscope to receive the signals of these two photodiodes, and move the delay stage on the pump pulse beam path till the profiles of the pump pulse and the probe pulse overlap with each other on the oscilloscope screen. An accuracy of 20 ps is achieved owing to the temporal resolution of the oscilloscope.
- Remove the beam splitter and the two photodiodes as mentioned in Step 2.1.
- Adjust the delay stage on the pump pulse beam path till the air breakdown region could just be observed on the ICCD screen. The time when the formation of air breakdown could be detected instead of a uniform background is determined as delay time zero.
3. Sample and Stage Preparation
- Set up a lab-jack and two manual linear stages in order to move the sample with three degrees of freedom.
- Use a dial indicator and high precision shims to achieve a high flatness of the stages. The height difference should be within 1 μm per a distance of 25.4 mm.
- Cut a square piece (30 mm × 30 mm) out of a Cu sheet with a thickness of 0.8 mm using a milling machine.
- Polish a narrow side (30 mm × 0.8 mm) of the Cu piece until the surface roughness is below 0.5 μm.
- Fix the Cu piece on the top manual stage with the polished narrow face up.
- Move the target by one manual stage as mentioned in Step 3.1) while monitor its position via the ICCD camera such that any tilt could be adjusted by inserting high precision shims below the target.
- Repeat Step 3.6 with the other manual stage.
- Drill a dozen of holes on the target while vary the position of the focal lens by a third high accuracy manual stage. The focal point location corresponds to the position of the focal lens where the smallest hole is drilled.
4. Ablation and Measurement
- Move the focal lens up to a distance of about 50 μm away from the focal point.
- Move the delay stage on the probe pulse beam path with an interval of 0.3 mm to capture the image every 2 ps till 10 ps, or with an interval of 3 mm to capture the image every 20 ps till 480 ps.
- Repeat Step 4.2 for several times for repeatability and accuracy.
- Move the focal lens down to a distance of about 50 μm away from the focal point, and repeat Step 4.3.
5. Representative Results
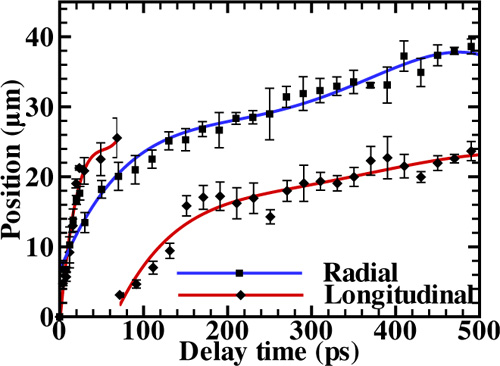
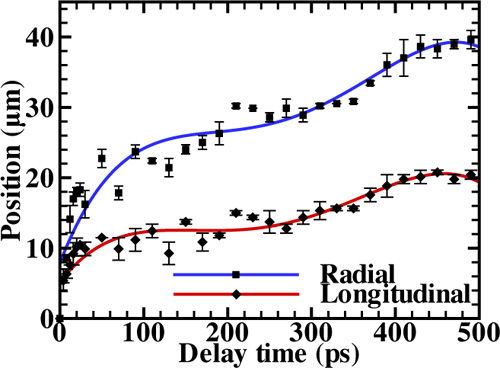
The measured shadowgraph images are shown in Fig. 2 and Fig. 3, for the focal point slightly above and below the target surface, respectively. The longitudinal and radial expansion positions are plotted in Fig. 4 and Fig. 5. The longitudinal expansions of these two cases in the first 100 ps are significantly different; however, their longitudinal expansions in the following 400 ps and their radial expansions are similar. For the first case, the early plasma within 100 ps has a one-dimensional expansion structure consisting of multiple layers. For the second case, the early plasma has a two-dimensional expansion structure that does not change very much within 100 ps.
The simulation model12 is used to investigate the mechanism of early plasma evolution. Time zero is defined as the time when the laser pulse peak reaches the target surface. The simulated early plasma evolution processes agree well with the measured results for both of these two cases, as shown in Fig. 6 and Fig. 7, respectively. The formation of the early plasma within 1 ps is also predicted for the first case using the simulation model and shown in Fig. 8. The early plasma is found to have an air breakdown region and a Cu plasma region. The air breakdown is first caused by multi-photon ionization and then followed by avalanche ionization. For the second case, however, the focal point is below the target surface and no separate air breakdown region is formed. Instead, air ionization occurs near the Cu plasma front and is caused by impact ionization owing to the free electrons ejected from the Cu target.

Figure 1. Schematic of the pump-probe shadowgraph measurement.

Figure 2. Cu plasma expansion at successive delay times with the focal point slightly above the surface. Laser wavelength: 800 nm; pulse duration: 100 fs; power density: 4.2 × 10¹⁴ W/cm2; target: Cu.

Figure 3. Cu plasma expansion at successive delay times with the focal point slightly below the surface. Laser wavelength: 800 nm; pulse duration: 100 fs; power density: 4.2 × 10¹⁴ W/cm2; target: Cu.

Figure 4. Plasma longitudinal and radial expansion positions at successive delay times with the focal point slightly above the surface. Laser wavelength: 800 nm; pulse duration: 100 fs; power density: 4.2 × 10¹⁴ W/cm2; target: Cu.

Figure 5. Plasma longitudinal and radial expansion positions at successive delay times with the focal point slightly below the surface. Laser wavelength: 800 nm; pulse duration: 100 fs; power density: 4.2 × 10¹⁴ W/cm2; target: Cu.
Figure 6. Animation of measured and calculated plasma expansion within a delay time of 70 ps with the focal point slightly above the surface. Laser wavelength: 800 nm; pulse duration: 100 fs; power density: 4.2 × 10¹⁴ W/cm2; target: Cu. Click here to view animation.
Figure 7. Animation of measured and calculated plasma expansion within a delay time of 70 ps with the focal point slightly below the surface. Laser wavelength: 800 nm; pulse duration: 100 fs; power density: 4.2 × 10¹⁴ W/cm2; target: Cu. Click here to view animation.
Figure 8. Animation of measured and calculated plasma expansion within a delay time of 1 ps with the focal point slightly above the surface. Laser wavelength: 800 nm; pulse duration: 100 fs; power density: 4.2 × 10¹⁴ W/cm2; target: Cu. Click here to view animation.
Discussion
The measurement and simulation methods presented in this paper enable more accurate examinations of the early plasma dynamics and a better understanding of the ionization mechanisms for both air and Cu. High quality plasma structures are captured with a temporal resolution of 1 ps and a spatial resolution of 1 μm. This measurement has a high repeatability too. The critical procedure is to align the beam very well and prepare a target surface with a high flatness as well as a low roughness.
This approach can be applied to other target materials and various laser parameters. The only limitation of the pump-probe shadowgraph method is a too low electron number density variation.
Disclosures
No conflicts of interest declared.
Acknowledgements
The authors wish to gratefully acknowledge the financial support provided for this study by the National Science Foundation (Grant No: CMMI-0653578, CBET-0853890).
Materials
| Name | Company | Catalog Number | Comments |
| Laser | Spectra-Physics | SPTF-100F-1K-1P | |
| ICCD camera | Princeton Instruments | 7467-0028 | |
| Oscilloscope | Rigol | DS1302CA | |
| Photodiode | Newport | 818-BB30 | |
| Linear stage | Newport | 433 | |
| Dial indicator | Mitutoyo | ID-C112E |
References
- Garnov, S. V., Malyutin, A. A., Tsarkova, O. G., Konov, V. I., Dausinger, F. Ultrafast laser-induced plasma diagnostics with time-spatial resolved shadow and interferometric techniques. Proc. SPIE. 4637, 31-42 (2002).
- Zhang, N., Zhu, X., Yang, J., Wang, X., Wang, W. Time-resolved shadowgraphs of material ejection in intense femtosecond laser ablation of aluminum. Phys. Rev. Lett. 99, 167602 (2007).
- Li, J., Wang, X., Chen, Z., Clinite, R., Mao, S. S., Zhu, P., Sheng, Z., Zhang, J., Cao, J. Ultrafast electron beam imaging of femtosecond laser-induced plasma dynamics. J. Appl. Phys. 107, 083305 (2010).
- Veysman, M. E., Agranat, M. B., Andreev, N. E., Ashitkov, S. I., Fortov, V. E., Khishchenko, K. V., Kostenko, O. F., Levashov, P. R., Ovchinnikov, A. V., Sitnikov, D. S. Femtosecond optical diagnostics and hydrodynamic simulation of Ag plasma created by laser irradiation of a solid target. J. Phys. B. 41, 125704 (2008).
- Geindre, J. P., Audebert, P., Rousse, A., Falliés, F., Gauthier, J. C., Mysyrowicz, A., Santos, A. D., Hamoniaux, G., Antonetti, A. Frequency-domain interferometer for measuring the phase and amplitude of a femtosecond pulse probing a laser-produced plasma. Opt. Lett. 19, 1997-1999 (1994).
- Inogamov, N. A., Anisimov, S. I., Petrov, Y. u. V., Khokhlov, V. A., Zhakhovskii, V. V., Nishihara, K., Agranat, M. B., Ashitkov, S. I., Komarov, P. S. Theoretical and experimental study of hydrodynamics of metal target irradiated by ultrashort laser pulse. Proc. SPIE. 7005, 70052F.1-70052F.10 (2008).
- Flacco, A., Guemnie-Tafo, A., Nuter, R., Veltcheva, M., Batani, D., Lefebvre, E., Malka, V. Characterization of a controlled plasma expansion in vacuum for laser driven ion acceleration. J. Appl. Phys. 104, 103304.1-103304.5 (2008).
- Mao, S. S., Mao, X., Greif, R., Russo, R. E. Simulation of a picosecond laser ablation plasma. Appl. Phys. Lett. 76, 3370-3372 (2000).
- Chen, Z., Mao, S. S. Femtosecond laser-induced electronic plasma at metal surface. Appl. Phys. Lett. 93, 051506.1-051506.3 (2008).
- Kononenko, T. V., Konov, V. I., Garnov, S. V., Danielius, R., Piskarskas, A., Tamoshauskas, G., Dausinger, F. Comparative study of the ablation of materials by femtosecond and pico- or nanosecond laser pulses. Quantum Electron. 29, 724-728 (1999).
- Dausinger, F., Hügel, H., Konov, V. Micro-machining with ultrashort laser pulses: From basic understanding to technical applications. Proc. SPIE. 5147, 106-115 (2003).
- Hu, W., Shin, Y. C., King, G. B. Early-stage plasma dynamics with air ionization during ultrashort laser ablation of metal. Phys. of Plasmas. 18, 093302.1-093302.12 (2011).
Reprints and Permissions
Request permission to reuse the text or figures of this JoVE article
Request PermissionExplore More Articles
This article has been published
Video Coming Soon
Copyright © 2025 MyJoVE Corporation. All rights reserved