Method Article
Simultaneous Scalp Electroencephalography (EEG), Electromyography (EMG), and Whole-body Segmental Inertial Recording for Multi-modal Neural Decoding
In This Article
Summary
Development of an effective brain-machine-interface (BMI) system for restoration and rehabilitation of bipedal locomotion requires accurate decoding of user's intent. Here we present a novel experimental protocol and data collection technique for simultaneous non-invasive acquisition of neural activity, muscle activity, and whole-body kinematics during various locomotion tasks and conditions.
Abstract
Recent studies support the involvement of supraspinal networks in control of bipedal human walking. Part of this evidence encompasses studies, including our previous work, demonstrating that gait kinematics and limb coordination during treadmill walking can be inferred from the scalp electroencephalogram (EEG) with reasonably high decoding accuracies. These results provide impetus for development of non-invasive brain-machine-interface (BMI) systems for use in restoration and/or augmentation of gait- a primary goal of rehabilitation research. To date, studies examining EEG decoding of activity during gait have been limited to treadmill walking in a controlled environment. However, to be practically viable a BMI system must be applicable for use in everyday locomotor tasks such as over ground walking and turning. Here, we present a novel protocol for non-invasive collection of brain activity (EEG), muscle activity (electromyography (EMG)), and whole-body kinematic data (head, torso, and limb trajectories) during both treadmill and over ground walking tasks. By collecting these data in the uncontrolled environment insight can be gained regarding the feasibility of decoding unconstrained gait and surface EMG from scalp EEG.
Introduction
This protocol uses three data collection systems to simultaneously record EEG, EMG, and whole-body kinematics (Figure 1, Table 1). EEG data are collected wirelessly from 64 channels at a sampling frequency of 1,000 Hz while subjects walk. Electromyography (EMG) is collected at 1,000 Hz from surface electrodes placed bilaterally on four muscle groups: tibialis anterior (TA), gastrocnemius (Gast), biceps femoris (BF), and vastus lateralis (VL). Kinematic data are collected at 128 Hz from 11 wireless sensors mounted on the head, upper torso, lumbar region, arms, thighs, shanks, and feet to record movement during walking. Each sensor contains a triaxial magnetometer, triaxial gyroscope, and triaxial accelerometer (i.e. a MARG sensor).
Data are collected from each system and synchronized in time by a single host PC. Synchronization is accomplished using a trigger signal sent over a continuous serial communication link accessed by all three data systems simultaneously. The trigger was implemented as a simple button switch. When the button is pressed a trigger signal (1) is sent to the host PC, while a null signal (0) is sent when not pressed. Pressing the trigger button also elicits a 0.5 sec tone used as an audio cue for the subject, as described in the protocol below. Five pairs of infrared (IR) proximity sensors were fabricated for use as location triggers during the over ground walking experiments described below. When the IR signal is interrupted a trigger signal (1) is sent to the host PC over the serial link via a radio frequency (RF) connection with the manual trigger box.
A custom C++ application, utilizing the software development kit (SDK) provided by each system, was developed to record and synchronize data. The code employs a multi-threading technique; functions for saving data from each system (EEG, EMG, and MARGs) are contained in individual threads. The software algorithm is shown in Figure 2. Data collection begins when the application is executed and ends when the 'q' key is pressed. Five threads are activated upon application execution. One thread (Figure 2) monitors the value (0 or 1) of the trigger signal from the serial connection. Initial trigger value is zero. When a trigger is received (i.e. when the button is pressed or line of sight between IR sensor pair is broken) the global trigger variables are set to 1. These variables remain 1 until they are reset within the data collection threads.
The EEG thread remotely accesses scalp EEG data in real time using TCP/IP protocol. Data are written to a text file line by line at the corresponding sampling frequency (1,000 Hz). The global EEG trigger signal is written to the first column, while columns 2-65 are the 64 EEG channels. If the global EEG trigger signal was 1, it is reset to zero. Data writing continues until the EEG thread is terminated. Two independent threads record MARG sensor data. Two threads are necessary because the 11 wireless MARG sensors transmit data using manufacturer's software in robust streaming mode, which buffers data on the individual sensors to prevent data loss in the event of wireless transmission problems. This buffering degrades real-time data transfer: if one sensor is unable to transmit data for a given sample all 11 sensors retain that time point in their buffer and transmit it at the next available sample point. MARG wireless data transfer inevitably lags behind EEG; thus MARG sensors need time to offload buffered data to the host PC after data collection is stopped. To overcome this issue, two threads are used in the MARG data collection algorithm (Figure 2). The first thread populates an MARG trigger buffer from the global MARG trigger variable at the sensor sampling frequency (128 Hz) while the EEG thread is collecting data. When data collection stops writing to the trigger buffer also terminates. The MARG thread (Figure 2) utilizes functions from the sensor SDK to receive data from the sensors and write it to a file in the same manner as the EEG data. That is, the first column is the value of the global MARG trigger (obtained from the MARG trigger buffer) and the following 99 columns are the values from the 11 MARG sensors (9 sensors per MARG unit). The MARG thread writes data until the time index of the MARG trigger buffer is equal to the last time index of the EEG data at which point thread execution is terminated.
Unlike the EEG and MARG data, EMG data are not recorded wirelessly. Instead, EMG data are recorded on an SD card within the data logging unit. A signal is sent over a Bluetooth connection to start and stop data writing to the SD card. Writing begins when the first manual trigger is received by the EEG thread. Data writing stops with the EEG thread when the 'q' button is pressed.
The following protocol was examined and approved by the Institutional Review Board at the University of Houston. All subjects received, read, and signed a consent form prior to participation.
Protocol
1. Subject Preparation
- Measure subject's height, weight, and record their age.
- Assess the subject's preferred treadmill speed by having them self-adjust treadmill speed until comfortable.
- Using a felt tip pen, mark the vertex of the head as the midpoint between the nasion and inion of the subject. Additionally, mark 10% of the nasion to inion distance as a reference for aligning the cap.
2. Scalp Electroencephalography (EEG)
- Attach EEG electrodes as specified by the 10-20 international system using an EEG cap fitted to the subject as in 12. The cap ensures proper placement of the electrodes on the scalp.
- Place the EEG cap on the subject by aligning the 10% mark from step 1.3 at the midpoint of the Fp1 and Fp2 electrodes and the Cz electrode with the marked vertex. More details for placement of the cap are found in 12. Secure the cap by strapping below the chin.
- Connect EEG electrodes to the EEG control box. Starting with ground and reference electrodes, use a small syringe to inject electrolyte gel in each electrode until impedance of each measures below 25 kΩ as indicated by electrode LED turning green. Further details on EEG electrode preparation are available in 12,13.
- Connect the EEG electrodes to the wireless EEG transmitter. Secure the transmitter to the subject on a Velcro strap placed around the shoulders and connect the wireless EEG receiver to two 32 channel amplifiers.
- Connect the amplifiers to the host PC via a USB port using a fiber-optic to USB converter.
- Set EEG channel resolution to 0.1 μV, low cutoff frequency to DC, and high cutoff frequency to 1,000 Hz in the EEG data collection software.
3. Surface Electromyography (EMG)
- Prepare for EMG electrode placement at 8 muscle sites: shave skin, abrade with sandpaper, and clean with an isopropyl alcohol pad. Place electrodes on prepared sites and connect to EMG data logging unit. Place EMG ground electrode on left or right wrist, and connect to data logging unit.
4. Motion Capture
- Synchronize MARG sensors while docked according to manufacturer's instructions.
- Remove MARG sensors and place on the subject using Velcro straps or double sided tape at locations in Table 2.
5. Environment Preparation
- Prepare treadmill by taping a diagonal line (45° from horizontal) on the belt. Place a television monitor connected to a video camera approximately 1 m in front of the treadmill. Tape a piece of paper with a 2 inch diameter black circle on the television.
- Setup walking arena by placing 5 sets of IR proximity sensors, cones, and television screen as located in Figure 3.
6. Treadmill
- Subject ascends onto treadmill. Attach safety harness.
- Prior to data collection, examine EEG and EMG signals to verify correct electrode placement, electrode connection, and data transmission.
- Begin data collection by running the C++ console application. Press the manual trigger push button to initiate EMG recording and give an audio cue (beep) to start the experiment.
- The subject stays in quiet stance for 30 sec.
- After 30 sec push trigger button to initiate walking; the treadmill is slowly accelerated to the subject's pre-selected speed.
- The subject walks for 5 min.
- At the end of 5 min, push trigger button to initiate walk to stand transition by slowly stopping the treadmill. After coming to a stop the subject remains standing for 30 sec. Press the 'q' button to stop data collection trial and save the data.
- Repeat steps 6.2-6.7 for all three treadmill conditions:
- Treadmill walking while looking at black dot in distance.
- Treadmill walking while observing motion of own legs on TV monitor.
- Treadmill walking while using video feedback to avoid diagonal line on treadmill (to simulate cognitive load 6).
7. Arena Walking (1)
- Position subject at the start of the arena walking loop (Figure 3).
- Begin data collection as in 6.2-6.4.
- Push the trigger button to initiate walking. At the time the trigger is given, the first directional arrow (→, ←, or ↑) is displayed on the screen opposite the subject (Figure 3). If → or ← is observed, the subject exits the entrance set of cones, turns 90° in that direction, completes the loop and returns to the entrance cones. If ↑is observed, the subject continues straight out of the entrance cones and a manual trigger and direction arrow (→ or ←) is given when the subject reaches approximately 2 meters before the IR sensors. The subject proceeds through the first set of IR sensors and then makes the corresponding 90° turn to complete the loop, returning to the entrance cones. (During walking, the experimenter follows the subject at a distance of approximately 3-5 meters with the host PC on a wheeled cart to enhance wireless signal quality.)
- The subject continues walking when he/she reaches the entrance cones after completing a single loop. Sequence 7.3 is repeated with random ordering of arrows until 3 loops have been completed for each initial arrow (→, ←, or ↑).
- After satisfying condition 7.4, push the manual trigger button when subject reaches the entrance cones to signal transition to standing. Subject stands quietly for 30 sec and then data collection is terminated by pressing the 'q' button on the host PC.
8. Arena Walking (2)
- Rearrange arena walking course so that the five sets of IR sensors are positioned in a semi-circle in front of the subject (Figure 4).
- Begin data collection as with the previous trials (7.1-7.2).
- Similar to Arena Walking I, give a manual trigger to initiate walking. At the time of the trigger, one of 5 direction arrows (←, →,
 ,
,  , or ↑) is displayed on the screen. Each arrow corresponds to one set of IR sensors which are positioned around the arena (Figure 4).
 - The subject observes the arrow on the screen and walks to the corresponding set of IR sensors, making a U-turn around the cone beyond the sensors, passing through the sensors twice (Figure 4). After making the U-turn, the subject returns to the starting point and continues walking.
- Repeat sequence 8.3-8.4, with random ordering of arrows, until 3 loops have been completed for each directional arrow.
- After satisfying condition 8.6, push the manual trigger button when the subject reaches the starting point to signal transition to standing. Complete data collection as in 7.5.
9. Sit to Stand
- Position a chair behind the subject and begin data collection as in 6.2-6.3. The subject stands quietly for 15 sec at the start of data collection.
- After 15 sec, press the manual trigger button. After hearing cue subject transitions from stand to sit posture, holding sitting position until the next audio cue (button push).
- Wait a random interval (5-15 sec) and press manual trigger to give cue for sit to stand transition. Standing posture is held until the next audio cue.
- Repeat 9.2-9.3 until 10 complete stand-to-sit and sit-to-stand maneuvers are complete, after which the subject stands quietly for 15 sec. Then, terminate data collection by pressing 'q' button.
- Repeat the stand-to-sit protocol (9.1-9.4) for self-initiated stand-to-sit and sit-to-stand transition. Rather than giving the subject a trigger to transition, have the subject initiate the transfer own their own until 10 of each maneuver is complete.
10. Hallway Walking
- Position subject and data collection cart in the middle of 1/8th mile, straight hallway. Begin data collection as with the treadmill walking experiments (6.2-6.4). After the initial 30 sec resting period, give a manual trigger to initiate walking.
- The subject walks continuously for 5 min. When the subject reaches within 10 meters of the hallway end, he/she self-initiates a U-turn and continues walking in the opposite direction.
- At the end of 5 min push the manual trigger button to stop walking. The subject stands quietly for 30 sec while looking straight ahead. Terminate data collection by pressing the 'q' button.
- Begin a second hallway experiment as in 10.1.
- After a random time interval of walking (20-40 sec), give a manual trigger and audio cue to have the subject stop walking.
- The subject remains standing for short, random duration (5-15 sec).
- Push the manual trigger button to have subject resume walking.
- Repeat steps 10.5-10.7 until 10 cycles of stop-start are complete; terminate data collection as in 10.3.
Results
Figure 5 shows 10 sec of time locked EEG, MARG, and EMG data recorded during treadmill walking (Protocol section 3). Note that each MARG senor actually records 9 signals (triaxial magnetometers, gyroscopes, and accelerometers) but only vertical acceleration is shown. The raw data in Figure 5 contain artifacts which must be accounted for during preprocessing prior to analysis and neural decoding. Examples of EEG artifacts in Figure 5 include eye blinks present at approximately 8.5 sec and low frequency motion artifact present throughout.
Figure 6 shows one complete loop (~ 35 sec) of over ground walking during the arena walking (1) protocol. Qualitatively, data from the arena over ground walking tasks contain more artifacts than treadmill walking due to the additional motion of the subject's head and neck during turning. The facial and cranial muscle activity is particularly noticeable on the temporal electrodes (channels labeled FT and T in Figure 1) in Figure 6. Note the increase in EMG signal activity compared to treadmill walking (Figure 5), specifically in the ankle agonist-antagonist pair. Figure 6 also displays events of suboptimal wireless EEG data collection that must be accounted for during data processing. Immediately prior to the 4th trigger, EEG data show flat lines, indicating a wireless transmission interruption between the host PC and the EEG system. This section of data must be trimmed from the entire data set (EEG, MARG, and EMG).
Figure 7 shows one cycle stand-to-sit and sit-to stand data. As with other data, movement artifacts are present in EEG, both during the end of the transition and as the head is steadied as sitting (or standing) is maintained. One interval of hallway walking including stand-to-walk and walk-to-stand transition is shown in Figure 8. Note the ramping of EMG and acceleration data after the audio cues to start and stop walking. Coincident with this ramping is the appearance and disappearance of motion artifact in the EEG data. Figure 8 also displays a suboptimal connection on EEG electrode PO10 which occurs at approximately 7 s. This behavior is occasionally observed during the experiment and is likely due to loss of contact between the EEG electrode and the scalp. Electrode PO10 must be removed from the data analysis for this trial. Because EEG data can be observed in real time, and connection of EEG electrodes is verified (protocol step 6.2) before each trial in the protocol, the poor electrode connection can be remedied prior the next trial.
| Name | Company | Quantity |
| BrainAmp Amplifier | Brain Products, Gmbh | 2 |
| actiCAP EEG cap with 64 electrodes | Brain Products, Gmbh | 1 |
| Brainvision MOVE wireless EEG system | Brain Products, Gmbh | 1 |
| DataLOG MWX8 EMG data collection unit | Biometrics, Ltd. | 1 |
| SX230 EMG electrodes | Biometrics, Ltd. | 8 |
| R506 EMG ground electrode | Biometrics, Ltd. | 1 |
| Opal movement monitor (MARG sensor) | APDM, Inc. | 11 |
| Opal docking station for wireless data streaming | APDM, Inc. | 2 |
| Opal wireless access point | APDM, Inc. | 2 |
| Infrared Light Barrier Kit MK120 | Velleman, Inc. | 5 |
| Wixel Programmable USB Wireless Module | Pololu, Inc. | 6 |
Table 1. Equipment.
| Sensor | Location |
| Head | Center of forehead above eyebrows |
| Trunk | Between pectorals at base of sternum |
| Lumbar | Center of back at minimum of lumbar curve |
| Arm1 | Lateral side of arm; proximal to wrist ~10% to elbow |
| Thigh1 | Lateral side of thigh; 50% between hip and knee |
| Shank1 | Lateral side of shank; 75% distal from knee |
| Foot1 | Centered on the instep of the foot |
| 1Arm, Thigh, Shank, and Foot sensors are placed bilaterally. | |
Table 2. MARG Sensor Locations.
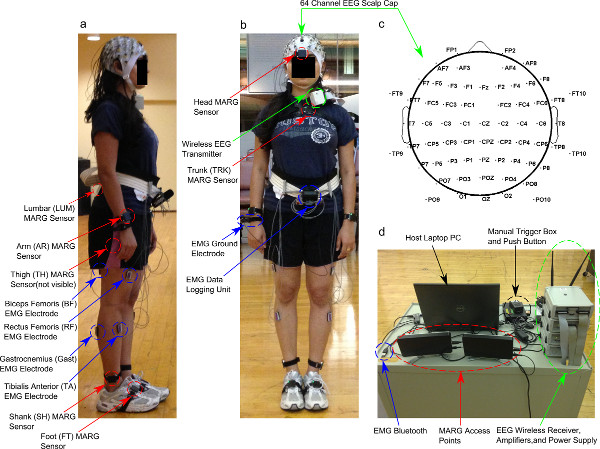
Figure 1. Sagittal (a) and frontal (b) view of a subject wearing EEG, EMG, and MARG inertial sensors for data collection. (c) Topographic representation of EEG electrode locations on the scalp, plotted with EEGlab Matlab toolbox 14. (d) Mobile data collection cart containing host PC, manual trigger, EMG Bluetooth, MARG wireless access points, and EEG wireless receiver, amplifiers, and power supply. Click here to view larger figure.
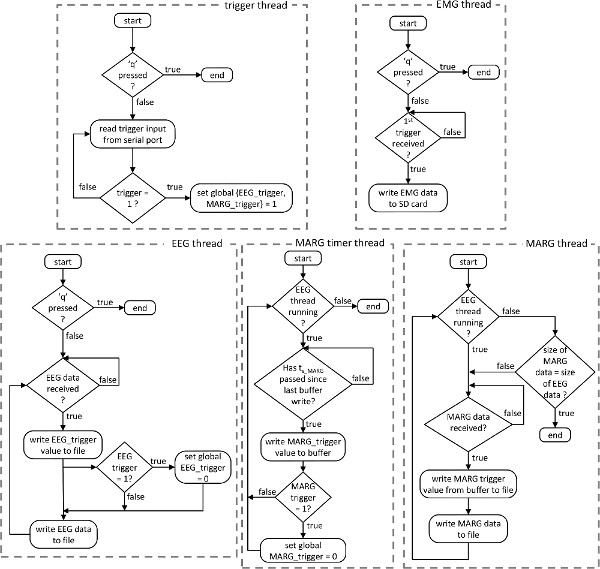
Figure 2. Flowchart detailing the algorithm for the custom designed, multi-threaded data collection software. Click here to view larger figure.
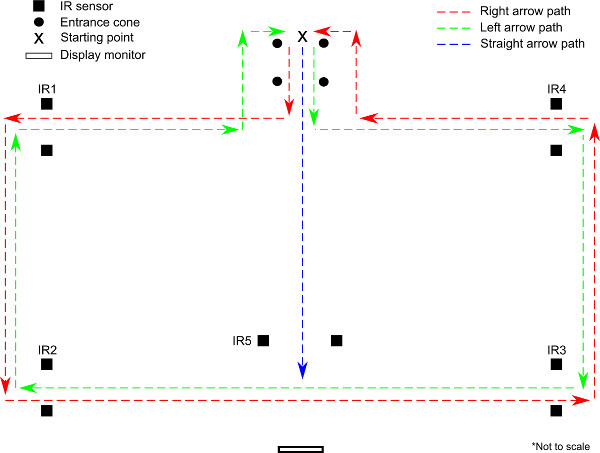
Figure 3. Schematic (bird's eye) representation of arena walking (1) experimental protocol. One arrow (→, ←, or↑) is presented on the display monitor when the subject is at the end of the entrance cones. If right (→) or left (←) is presented, the subject follows the red or green loop, respectively, passing through four sets of infrared (IR) sensors (IR1-IR4). If the straight (↑) is presented, the subject walks toward the display monitor (blue line), and a second arrow (→ or ←) is presented when the subject is approximately 1 meter before the IR sensors (IR5). After passing through the IR5 sensor set, the subject completes the loop along the corresponding (red or green) path, returning to the starting point.
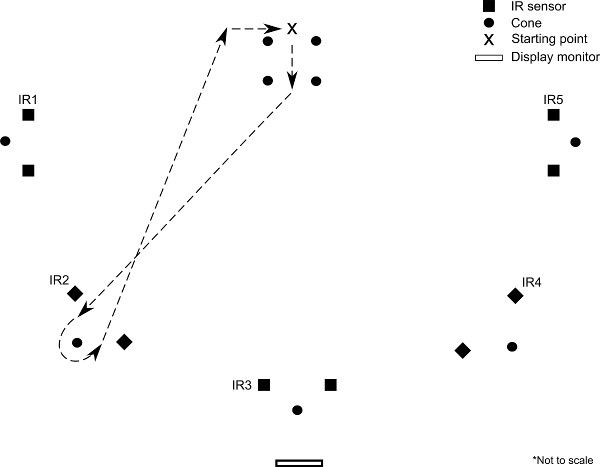
Figure 4. Schematic (bird's eye) representation of arena walking (2) experimental protocol. At the start of the experiment, a single arrow ( ,
,  , →, ←, or ↑) is presented to the subject on the display monitor. Based on the arrow received, the subject walks directly to the corresponding set of IR sensors, passes through the sensors, completes a U-turn around the cone, and returns to the starting point (loop corresponding to
  arrow is shown above).
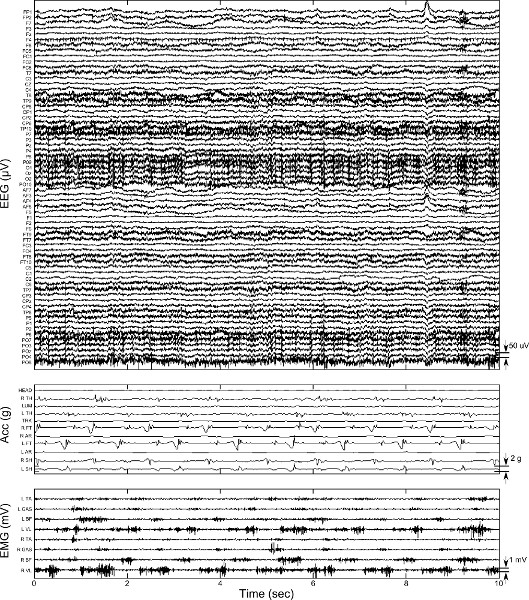
Figure 5. Sample data from 10 sec of treadmill walking. Top panel shows 64 channel raw EEG data with channel name from 10-20 international convention. Middle panel shows acceleration in the vertical direction from 11 MARG sensors. Bottom panel shows 8 channel raw EMG. Click here to view larger figure.
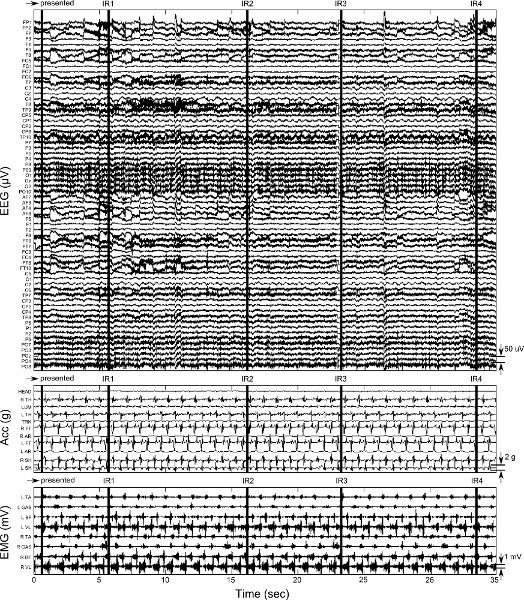
Figure 6. Sample data from one loop (right arrow path, Figure 3) of walking during the arena I protocol. EEG, acceleration, and EMG data are presented as in Figure 5. Vertical black bars are location of triggers received by the software. The first trigger is from the manual push button initiating the loop by presenting the → arrow. The following four triggers are from IR sensors IR1-IR4 (Figure 3) as the subject traverses the loop. Click here to view larger figure.
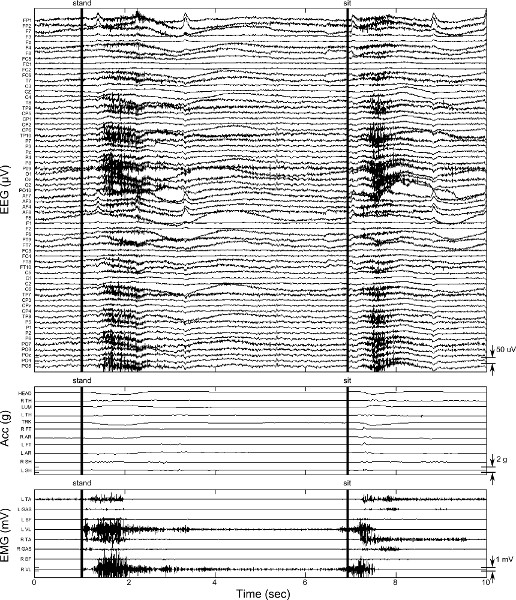
Figure 7. Sample data from stand-to-sit and sit-to-stand transition. EEG, acceleration, and EMG data is presented as in Figure 5. Vertical bars indicate manual triggers (and audio cues) to initiate standing and sitting, respectively. Click here to view larger figure.
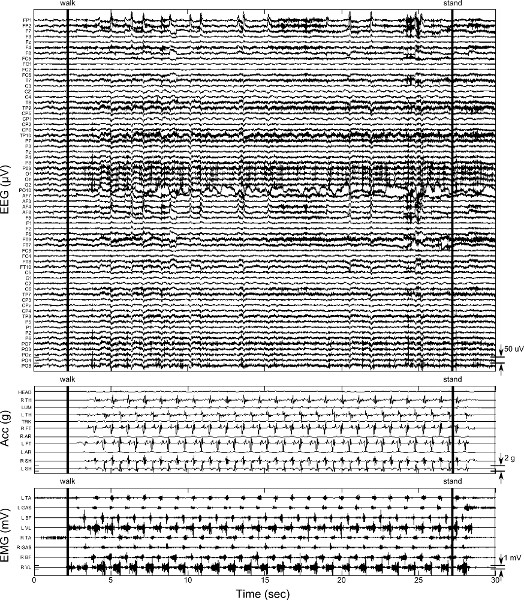
Figure 8. Sample data from hallway walking showing transition from standing to walking and walking to standing. EEG, acceleration, and EMG data are shown as in Figure 5. Vertical bars indicate manual triggers and audio cue to begin ansd stop walking, respectively. Click here to view larger figure.
Discussion
The protocol presented here brings together three data collection systems to simultaneously record brain activity, muscle activity, and whole-body kinematics during a variety of locomotive tasks. Completion of the entire protocol takes roughly 3 hr, including 1 hr of subject preparation. Each system is mounted on, and moves with, the subject. Therefore, it is critical to verify the connections of EEG and EMG electrodes prior to the start of each new trial. This can be easily done using the software packages provided by the respective manufacturer, which enables data to be examined in real time using graphical interfaces on the host PC. The data collection application requires these software packages to be running, simplifying the verification process. Additionally, care must be taken that MARG sensors are robustly attached to the subject before each trial.
EEG and MARG data are transmitted wirelessly over the 2.4-2.5 GHz spectrum range. Because many other electronic devices use this frequency band, it is important to consider the possibility of wireless interface in the experimental environment. A critical aspect of the data collection is line-of-sight visibility between the mobile cart and the subject, which provides robustness to wireless interference. Both the EEG wireless receiver and the MARG access points (Figure 1) provide LEDs to indicate connection fidelity. The host PC and wireless receivers for EEG and MARG sensors are placed on a mobile cart to maintain direct line of sight and maximize wireless data transmission as the subject walked over ground. We found robust data collection was best maintained by keeping the mobile cart within 5 meters of the subject, a distance which did not restrict subject movement during any of the tasks. The C++ application employs multiple threads for data collection to provide robustness to data loss due to interruption of wireless connection of EEG. If the EEG connection is lost, MARG and EMG data is still recorded, but no EEG data will be available for those time points. The MARG sensors provide on-unit buffering as discussed above to prevent data loss in the event of wireless connection, while EMG data is stored on an SD card within the mobile data logging unit.
A common issue with collection of EEG data during walking is presence of artifact in the signals. Broadly speaking, artifacts can be split into two groups: physiological sources of artifacts including blinks, eye motion, facial muscle activity, heart beats, and mechanical artifacts such as motion of electrodes and/or cables during experimental protocol execution. Artifact removal is a topic of ongoing research, and includes such techniques as independent component analysis 15,16 and channel-based template regression procedures 17. Artifact minimization and removal is a crucial step in preprocessing of data for neural decoding of body movement. The setup presented here is similar to previous studies in that EEG electrode cables were bundled into a single connector. Results from those studies indicate that mechanical artifacts due to cable sway or movement did not play a role in decoding of movement from neural activity 7,8. Those results are supported by other studies which conclude that gait related artifacts were insubstantial in slow to moderate walking speeds 17. However, this experiment measures EEG during activities that require more motion of the body than previous studies, including sit-to-stand transitions, over ground walking, and turning, and thus, careful examination of the raw EEG data must be undertaken to identify potential contamination from mechanical artifacts. Though not yet widely available, these potential problems could be solved through integration of novel hardware into the current protocol. Such hardware includes active EEG electrodes (used in this protocol) and spring-loaded, dry EEG electrodes, which have potential to improve skin-electrode contact impedance during movement 18. These technologies are being incorporated into wireless EEG systems which may reduce the effect of motion artifacts 19. Integration of novel hardware notwithstanding, this protocol provides a unique opportunity to continue developing novel algorithms for motion and EMG artifact rejection because every segment of the body has been instrumented 16. We plan to study time-series correlation and frequency domain coherence between EEG, EMG, and segment motion to develop robust artifact rejection paradigms applicable to currently available EEG setups. Our decoding methods have shown robustness against artifacts 7,8; these methods will be examined under the more complex scenarios in the present protocol.
Features of recorded surface EMG are dependent on many factors, and interpretation of surface EMG signals for the study of neural strategies requires their consideration 20. The strict procedures for skin preparation and EMG electrode placement used in this protocol were designed to minimize the influence of non-physiologic factors on the surface EMG signals. The amplitude and frequency of the EMG recorded by this protocol are related to the net motor unit activity, and therefore the recording should not be interpreted as a direct representation of neural activity of the desired muscle. Yet, careful consideration of the surface EMG signal and more advanced methods to estimate neural drive to muscle by decomposing the EMG signal to determine relative changes in neural activation (e.g. by identifying the discharge times of motor units) can provide valuable insight into muscle activation patterns 20. Moreover, within the context of neural decoding, although brain activity acquired invasively has been shown to contain information about surface EMG 21, it is currently unknown whether scalp EEG can also be used to decode lower limb muscle activity during walking in addition to gait kinematics. We expect this protocol would allow us to examine whether the reduced spatial resolution of non-invasive brain imaging modalities is sufficient to isolate neural activity related to individual muscles.
Previous studies have shown feasibility in utilizing noninvasive EEG to decode kinematics during treadmill walking 7,8 providing impetus for development of a brain machine interface (BMI) to restore walking using signals from the brain. Time-domain decoding methods based on amplitude modulation of delta-band EEG signals have also been shown to be insensitive to artifactual components 7,8. Yet, treadmill studies take place in a controlled environment during which the user's vision and motion is restricted, thereby limiting the contamination of neural activity due to outside stimuli. Through incorporation of wireless data logging, this protocol allows collection of synchronized EEG, EMG, and kinematic data during a variety of locomotion tasks and environments. Integration of inertial sensors for motion tracking requires more computation and offline processing to extract kinematics than a motion capture system, and resulting measures contain a small - but acceptable - margin of error which would not be present in a camera based system 22. These manageable difficulties are a necessity to establish an experimental protocol that enables mobile study of cognitive-motor behavior in changing environments. As discussed elsewhere 10,11, such a setup is nearly limitless in the research questions that can be addressed. Our focus in the near future will be on issues critical to development of a BMI for rehabilitation of standing and walking following brain injury and neuropathy. One key component, as mentioned above, will be development of novel robust decoding strategies for brain-machine interfaces to rehabilitation robotic systems that can reject physiological and mechanical artifacts to restore movement using signals measured from the brain. For example, the hallway walking protocol is performed in a public space with other people present during data collection, and thus provides a test bed for development of neural decoding techniques in the natural environment. Other research questions of interest using this protocol include comparing rehabilitation robotic paradigms involving rhythmic versus non-rhythmic gait training, and study of neural activity during functional recovery following injury in both acute and chronic phases.
Disclosures
Production and publication fees for this article were sponsored by APDM.
Acknowledgements
This work was supported by the National Institute of Neurological Disorders and Stroke (NINDS) grant # R01NS075889-01. This research was supported in part by the Intramural Research Program of the NIH, Clinical Center. The authors also thank Shahriar Iqbal and Yongtian He for assistance with data collection. The cost of open-access publication of this article was sponsored by APDM, Inc. (Portland, OR; http://apdm.com).
Materials
| Name | Company | Catalog Number | Comments |
| BrainAmp Amplifier | Brain Products, Gmbh | Quantity: 2 | |
| actiCAP EEG cap with 64 electrodes | Brain Products, Gmbh | Quantity:1 | |
| Brainvision MOVE wireless EEG system | Brain Products, Gmbh | Quantity:1 | |
| DataLOG MWX8 EMG data collection unit | Biometrics, Ltd. | Quantity:1 | |
| SX230 EMG electrodes | Biometrics, Ltd. | Quantity:8 | |
| R506 EMG ground electrode | Biometrics, Ltd. | Quantity:1 | |
| Opal movement monitor (MARG sensor) | APDM, Inc. | Quantity:11 | |
| Opal docking station for wireless data streaming | APDM, Inc. | Quantity:2 | |
| Opal wireless access point | APDM, Inc. | Quantity:2 | |
| Infrared Light Barrier Kit MK120 | Velleman, Inc. | Quantity:5 | |
| Wixel Programmable USB Wireless Module | Pololu, Inc. | Quantity:6 | |
| Table 1. Equipment | |||
References
- Choi, J. T., Bastian, A. J. Adaptation reveals independent control networks for human walking. Nature Neuroscience. 10 (8), 1055-1062 (2007).
- Grillner, S., Wallen, P., et al. Neural bases of goal-directed locomotion in vertebrates - an overview. Brain Research Reviews. 57, 2-12 (2008).
- Petersen, T. H., Willerslev-Olsen, M., Conway, B. A., Nielsen, J. B. The motor cortex drives the muscles during walking in human subjects. Journal of Physiology. 590 (10), 2443-2452 (2012).
- Fitzsimmons, N. A., Lebedev, M. A., et al. Extracting kinematic parameters for monkey bipedal walking from cortical neuronal ensemble activity. Frontiers in Integrative Neuroscience. 3, 3 (2009).
- Harada, T., Miyai, I., Kubota, K. Gait capacity affects cortical activation patterns related to speed control in the elderly. Experimental Brain Research. 193 (3), 445-454 (2009).
- Gwin, J. T., Gramann, K., Makeig, S., Ferris, D. P. Electrocortical activity is coupled to gait cycle phase during treadmill walking. Neuroimage. 54, 1289-1296 (2011).
- Presacco, A., Goodman, R., Forrester, L., Contreras-Vidal, J. L. Neural decoding of treadmill walking from noninvasive electroencephalographic signals. Journal of Neurophysiology. 106, 1875-1887 (2011).
- Presacco, A., Forrester, L. W., Contreras-Vidal, J. L. Decoding intra-limb and inter-limb kinematics during treadmill walking from scalp electroencephalographic (EEG) signals. IEEE Transactions on Neural Systems and Rehabilitation Engineering. 20 (2), 212-219 (2012).
- Wagner, J., Solis-Escalante, T., et al. Level of participation in robotic-assisted treadmill walking modulates midline sensorimotor EEG rhythms in abled-bodied subjects. NeuroImage. 63, 1203-1211 (2012).
- Makeig, S., Gramann, K., et al. Linking brain, mind, and behavior. International Journal of Psychophysiology. 73, 95-100 (2009).
- Gramann, K., Gwin, J. T., et al. Cognition in action: imaging brain/body dynamics in mobile humans. Reviews in the Neurosciences. 22, 593-608 (2011).
- Wilson, J. A., Schalk, G., et al. Using an EEG-based brain computer interface for virtual cursor movement with BCI2000. J. Vis. Exp. (29), e1319 (2009).
- Brummer, V., Schneider, S., et al. Coherence between brain cortical function and neurocognitive performance during changed gravity conditions. J. Vis. Exp. (51), e2670 (2011).
- Delorme, A., Makeig, S. EEGLAB: an open source toolbox for analysis of single-trial EEG dynamics including independent component analysis. Journal of Neuroscience Methods. 134 (1), 9-21 (2004).
- Makeig, S., Bell, A. J., et al. Independent component analysis of electroencephalographic data. Advances in Neural Information Processing Systems. 8, 145-151 (1996).
- Rong, F., Contreras-Vidal, J. L. Magnetoencephalographic artifact identification and automatic removal based on independent component analysis and categorization approaches. Journal of Neuroscience Methods. 157, 337-354 (2006).
- Gwin, J. T., Gramann, K., Makeig, S., Ferris, D. P. Removal of movement artifact from high-density EEG recorded during walking and running. Journal of Neurophysiology. 103, 3526-3534 (2010).
- Liao, L. D., Wang, I. J., Chen, S. F., Chang, J. Y., Lin, C. T. Design, fabrication, and experimental validation of a novel dry-contact sensor for measuring electroencephalography signals without skin preparation. Sensors. 11, 5819-5834 (2011).
- Liao, L. D., Lin, C. T., et al. Biosensor technologies for augmented brain-computer interfaces in the next decades. Proceedings of the IEEE. 100, 1553-1566 (2012).
- Farina, D., Merletti, R., Enoka, R. M. The extraction of neural strategies from the surface EMG. Journal of Applied Physiology. 96, 1486-1495 (2004).
- Flint, R. D., Ethier, C., et al. Local field potentials allow accurate decoding of muscle activity. Journal of Neurophysiology. 108, 18-27 (2012).
- Luinge, H. J., Veltink, P. H. Measuring orientation of human body segments using miniature gyroscopes and accelerometers. Medical & Biological Engineering & Computing. 43, 273-282 (2005).
Reprints and Permissions
Request permission to reuse the text or figures of this JoVE article
Request PermissionThis article has been published
Video Coming Soon
Copyright © 2025 MyJoVE Corporation. All rights reserved