A subscription to JoVE is required to view this content. Sign in or start your free trial.
Method Article
Hand Controlled Manipulation of Single Molecules via a Scanning Probe Microscope with a 3D Virtual Reality Interface
In This Article
Summary
We demonstrate the precise manipulation of individual organic molecules on a metal surface with the tip of a scanning probe microscope driven in 3D by the experimenter's hand using a motion capture system and fully immersive virtual reality goggles.
Abstract
Considering organic molecules as the functional building blocks of future nanoscale technology, the question of how to arrange and assemble such building blocks in a bottom-up approach is still open. The scanning probe microscope (SPM) could be a tool of choice; however, SPM-based manipulation was until recently limited to two dimensions (2D). Binding the SPM tip to a molecule at a well-defined position opens an opportunity of controlled manipulation in 3D space. Unfortunately, 3D manipulation is largely incompatible with the typical 2D-paradigm of viewing and generating SPM data on a computer. For intuitive and efficient manipulation we therefore couple a low-temperature non-contact atomic force/scanning tunneling microscope (LT NC-AFM/STM) to a motion capture system and fully immersive virtual reality goggles. This setup permits "hand controlled manipulation" (HCM), in which the SPM tip is moved according to the motion of the experimenter's hand, while the tip trajectories as well as the response of the SPM junction are visualized in 3D. HCM paves the way to the development of complex manipulation protocols, potentially leading to a better fundamental understanding of nanoscale interactions acting between molecules on surfaces. Here we describe the setup and the steps needed to achieve successful hand-controlled molecular manipulation within the virtual reality environment.
Introduction
The low-temperature non-contact atomic force/scanning tunneling microscope (LT NC-AFM/STM, in the following simply termed SPM) is the tool of choice for atomically precise manipulation of individual atoms or molecules1-3. SPM-based manipulation is typically limited to two dimensions and consists of a series of abrupt and often stochastic manipulation events (jumps). This essentially limits the control over the process. Contacting the molecule in question by a single chemical bond at a well-defined atomic position leads to an approach that can overcome these limitations4-9. Throughout its manipulation the contacted molecule is connected to the SPM tip so that moving the molecule in all three dimensions by appropriate displacements of the tip becomes possible. This creates the possibility for various complex manipulation procedures performed in 3D space. However the contacting manipulation may be hindered by interactions of the manipulated molecule with the surface or/and other molecules in its surroundings, which may create forces that are large enough to rupture the tip-molecule contact. Therefore a particular 3D trajectory of the SPM tip may or may not result in a successful manipulation event. A question thus arises how to define protocols that lead to successful completion of manipulation in the circumstances when the tip-molecule bond has a limited strength, while the interactions of the manipulated molecule with its environment are not a-priori well characterized.
Here this question is approached in the most intuitive manner imaginable. The experimenter is allowed to control the displacements of the SPM tip simply by moving their hand7. This is achieved by coupling the SPM to a commercial motion capture system, some of the specifications of which are provided below. The advantage of "hand controlled manipulation" (HCM) is in the experimenter's ability to try out different manipulation trajectories quickly and learn from their failure or success.
The HCM setup has been used to conduct a proof-of-principle experiment in which a word ("JÜLICH") was stenciled in a closed layer of perylene-3,4,9,10-tetracarboxylic dianhydride (PTCDA) molecules on Ag(111), removing 48 molecules, one by one, with HCM7. Lifting a molecule from the surface cleaves its intermolecular hydrogen bonds which bind the molecules in the monolayer10. Typically the total strength of the present intermolecular bonds exceeds the strength of the single chemical bond between the outermost atom of the tip and a carboxylic oxygen atom of PTCDA by which the molecule is contacted (see Figure 1). That may lead to the rupture of the tip-molecule contact and the following failure of the manipulation attempt. The experimenter's task is thus to determine a tip trajectory that breaks the resisting intermolecular bonds sequentially rather than simultaneously, so that the total force applied to the tip-molecule contact never exceeds its strength.
Although the desired trajectory may in principle be simulated, due to the size and complexity of the system involved the necessary simulations would take a prohibitively large amount of time. In contrast to that, using HCM it was possible to remove the first molecule after 40 minutes. Towards the end of the experiment the extraction took already much less time which confirms the effectiveness of the learning procedure. Additionally, the accuracy and versatility of the HCM method was evidenced in the act of reverse manipulation when a molecule extracted from the neighboring location was used to close the void left after the erroneous removal of another molecule from the monolayer.
Motion capture approach, while being fast and intuitive, is limited to the generation of tip-trajectory data. For further systematic development of new molecular manipulation protocols it is equally important to be able to view the tip trajectory data in real time as well as to analyze previously generated data. Therefore, the functionality of the HCM setup is enhanced substantially by adding virtual reality goggles which allow the experimentalist to see the data plotted in the 3D virtual scene where the tip trajectory is augmented by the current (I) and frequency shift (Δf) values measured by the SPM in real-time8 (see below). In addition to that, the virtual reality scene shows a model of the manipulated molecule that serves as a visual scale reference. Thus the HCM setup complimented by the virtual reality interface is suitable for systematic mapping of the manipulation trajectory space and successive refinement of the promising manipulation protocols. Besides that the system also facilitates the knowledge transfer between different experiments. The following paragraphs give a description of the setup and some of its specifications that are relevant for manipulation experiments.
The experiments are performed in ultra-high vacuum (UHV) at a base pressure of 1 x 10⁻¹⁰ mbar with a commercial SPM consisting of a preparation chamber and an analysis chamber. The preparation chamber is equipped with: Ar+ source used for sample sputtering, sample transfer via manipulator (allows heating and cooling of a sample), low-energy electron diffraction (LEED), a customized Knudsen cell (K-cell) containing PTCDA powder purified by sublimation. The analysis chamber is equipped with: LN2 bath cryostat with a volume of 12 L and a holding time of 46 hr, LHe bath cryostat (5 L, 72 hr), Besocke11 beetle-type SPM equipped with a tuning fork sensor12 (TFS) consisting of a quartz tuning fork with an electrically connected PtIr tip (for STM operation), which is cut and sharpened by a focused ion beam (FIB) (Figure 2).

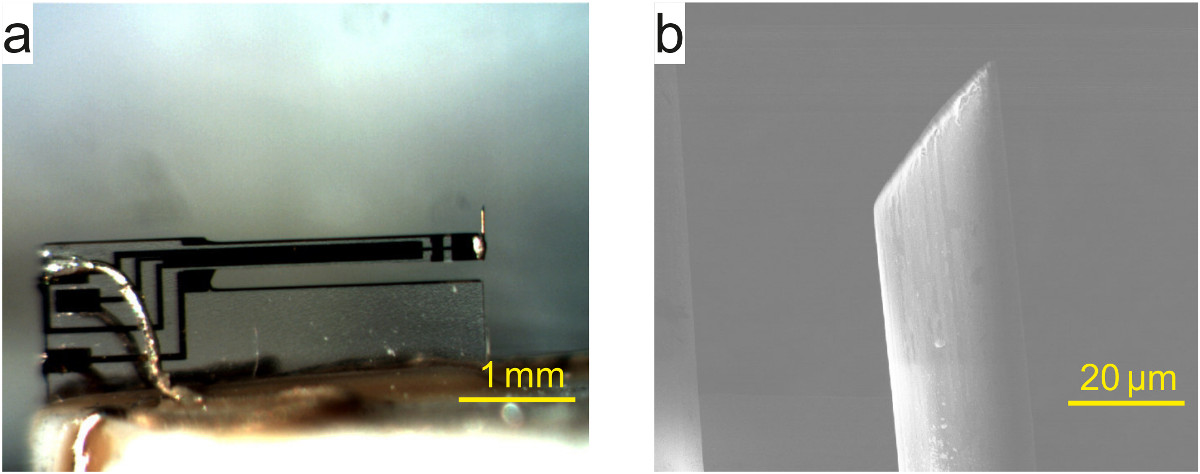
Figure 2. Tuning fork sensor. (a) Image of a commercial tuning fork sensor with attached PtIr tip. (b) SEM image of the PtIr tip apex cut with FIB. Please click here to view a larger version of this figure.
The AFM is operated in the frequency-modulated (FM) mode13 where the TFS is excited at the resonance (f0 ≈ 31,080 Hz) with a dither piezo. The piezoelectric signal of the oscillating tuning fork is amplified and used by a phase locked loop (PLL), which keeps the amplitude of the TFS's oscillation constant and tracks changes of its resonance frequency, Δf = f - f0, that originates from the gradient of the force acting on the tip. As shown in Figure 3 the SPM tip position is controlled by voltages (ux, uy, uz) applied to a set of x-, y-, z-piezos (piezo constants at 5 K: x=15, y=16, z=6 Å/V). The ux, uy, uz-voltages (±10 V at 20 bit resolution) are generated at the SPM electronics outputs. They are further amplified by a high voltage (HV) amplifier that has a maximum output voltage of ±200 V.

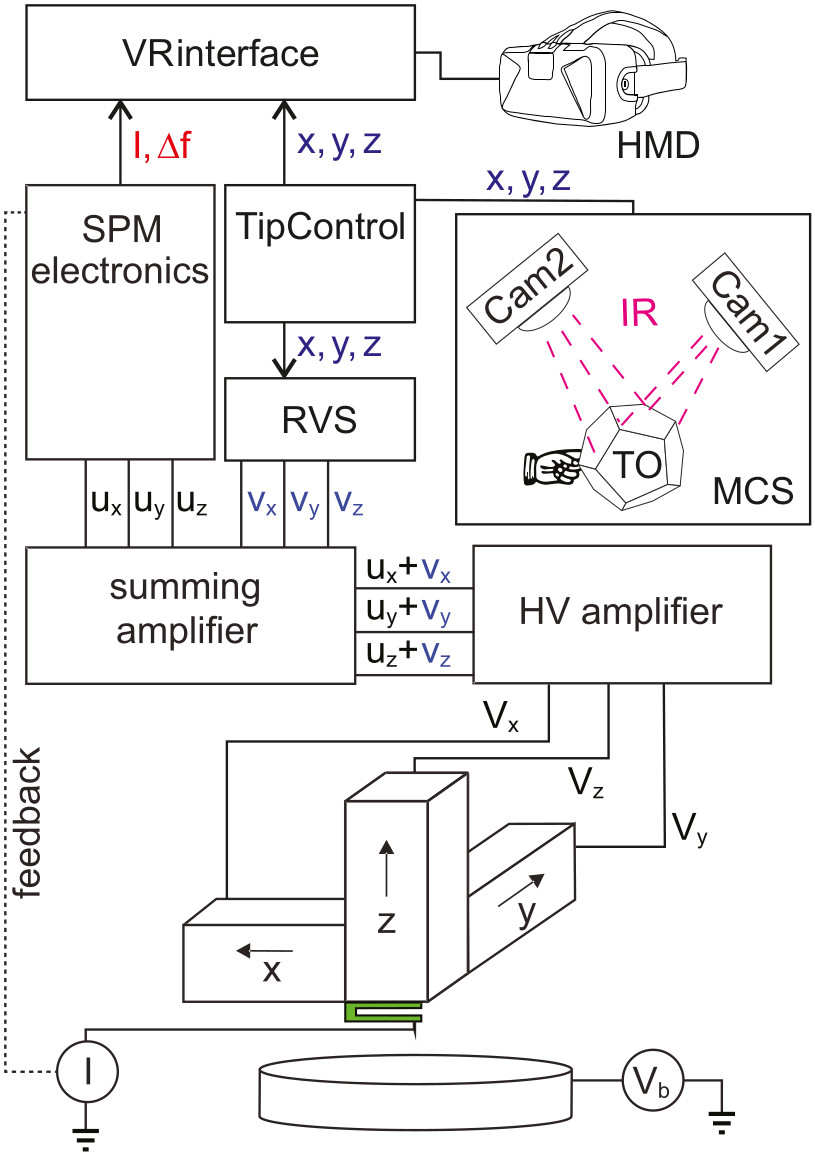
Figure 3. Schematics of the HCM setup. The position of (tracked object) TO that has multiple (infrared) IR sources installed on its surface is tracked by two infrared cameras of the motion capture system (MCS). TipControl software obtains the TO coordinates (x,y,z) from MCS and passes it to the remote voltage source (RVS) which generates a set of voltages (vx,vy,vz) that are summed with the voltages (ux,uy,uz) produced by the SPM electronics for control of the SPM tip position. The added voltage passes through a high-voltage (HV) amplifier and is further applied to the piezo-positioning system of the SPM tip. The setup allows manual control of the tip positioning when the SPM feedback (FB) loop is open. The (x,y,z) position of the tip as well as I(x,y,z) and Δf(x,y,z) are passed to the VRinterface software that plots it in the 3D virtual scene seen by the operator wearing the head-mounted display (HMD). Please click here to view a larger version of this figure.
The tunneling current that flows between the SPM tip and the surface is measured by a transimpedance amplifier with a variable gain that ranges from 1 x 10³ to 1 x 10⁹ V/A (bandwidth at gain 1 x 10⁹ V/A is 1 kHz). The output of the amplifier is fed into the STM feedback (FB) loop to regulate the tip height above the surface in constant current scanning mode. The stability of the junction (with the TFS oscillation turned off) is 1-3 pm. The piezoelectric oscillation signal of the TFS is amplified in two stages: (1) preamplifier fixed to the LN2 shield (gain 1 x 10⁸ V/A, bandwidth 20 kHz), and (2) external voltage amplifier with variable gain from 1 x 101 to 5 x 10⁴ and a bandwidth of 1 MHz.
For HCM experiments, the SPM setup is extended with: motion capture system (MCS), remotely controllable multichannel voltage source (RVS), summing amplifier and virtual reality head mounted display (HMD). All of the listed devices except the summing amplifier were acquired commercially.
MSC is an infrared (IR) marker-tracking system that allows millimeter resolution of spatial displacements at a rate of 100 Hz. The system consists of two IR cameras, a trackable object (TO) and the control software. The MCS software obtains the x-, y-, z-coordinates of the TO in 3D space by analyzing its images obtained by the two cameras. MCS provides a programming library that allows use of the coordinates of TO in a separate software program.
The coordinates of TO (xTO, yTO, zTO) are passed to a custom-developed software program "TipControl". Figure 4 shows a screenshot of the graphical user interface. The software is activated by the "start" button in the window. After activation (τ=0) the software sets all vx-, vy-, vz-voltages on RVS (voltage range ±10 V at 16 bit resolution, 50 msec latency per voltage step) according to the following expression  etc., where cx, cy, cz are the factors that convert 5 cm of the displacement of TO into 1 Å displacement of the SPM tip. The factors px(t), py(t), pz(t) have values defined by the status of the x-, y-, z-checkboxes in the software window. If the box is checked then the corresponding p(t) is set to 1. All p(t) are set to 0 at the moment when the "pause" button is pressed in the software window. That allows the operator to temporarily "freeze" the position of the tip. Pressing the "reset all" button in the software window sets vx-, vy-, vz-voltages to zero which returns the tip to its initial position defined by the SPM software. The text field "manual command to RVS" in the software window can be used to set any of the vx-, vy-, vz-voltages to any value in the allowed range of ±10 V. The vx-, vy-, vz-voltages generated by RVS are added to the ux-, uy-, uz-output voltage signals of SPM electronics via a summing amplifier (gain 1, bandwidth 50 kHz, output range ±10 V).

Figure 4. Screenshot of the interface window. Two indicators exhibit the status of connection with MCS and RVS systems. Checkboxes are used to activate hand-control along selected spatial axes. The button “Start” initiates data flow between MCS, TipControl and RVS according to the scheme shown in Figure 3. Button “Pause” stops the data flow. Button “Reset All” sets all RVS voltages to zero. Please click here to view a larger version of this figure.
For visualization of the experimental data (tip trajectory, I, Δf) a head mounted display (HMD) is used. The HMD provides a stereoscopic view (split HD display — one half for each eye, 1,920 x 1,080 pixels at 75 Hz). A dedicated IR camera tracks the position and orientation of HMD in 3D space using IR-LEDs fixed on the surface of HMD. The HMD tracking system allows the operator to change the view inside the 3D virtual reality scene by a turn of their head or simply moving their body.
The custom-written software "VRinterface" collects the data both from SPM and MCS, renders it in the 3D scene using OpenGL and displays it in the HMD with the help of the HMDs software development kit (SDK). VRinterface retrieves the actual x-, y-, z-coordinates of the tip directly from the tip software (few millisecond latency) while I and Δf signals are read directly from the outputs of the SPM electronics (latency ≈ 250 msec). Figure 5 shows a screenshot of the 3D virtual scene as seen by the operator wearing HMD during HCM. Inside the 3D virtual scene the tip apex is rendered as a white sphere. The coloring of the recorded tip trajectories reflects values of either log(I(x,y,z)) or Δf(x,y,z). Switching between log(I(x,y,z)) or Δf(x,y,z) color modes is done by the press of a button. Another button initiates the recording (and displaying) of experimental tip trajectory data. When pressed again the button stops the recording. The virtual scene also shows a static PTCDA molecule which is used as a visual aid during manipulation. The operator aligns its orientation manually to fit the orientation of the real molecule on the surface by using buttons on a keyboard.
Caution: Because the head tracking of HMD relies on IR-LEDs, it may interfere with the MCS since it also uses IR light to track the position of TO. Therefore TO has to have a unique shape recognized by the MCS. This helps MCS to discriminate between the signals that come from TO and those coming from IR-LEDs of HMD.

Figure 5. Screenshot of the 3D virtual scene displayed to the operator in HMD during HCM. A set of white spheres forms a model Ag(111) surface. Orientation of the model surface may not necessarily coincide with the orientation of the sample. A model of the PTCDA molecule is placed above the model surface. C, O, H atoms of PTCDA are shown in black, red and white respectively. For the purpose of convenience azimuthal orientation of the model molecule can be adjusted to fit the orientation of the real molecule chosen for manipulation. The tip position is marked by a single white sphere representing the outermost tip apex atom. The real-time I(x,y,z) and Δf(x,y,z) data are displayed as bar indicators placed next to the tip. Previously recorded as well as the currently executed manipulations are displayed as 3D trajectories whose color represents either log(I(x,y,z)) or Δf(x,y,z) values measured at corresponding positions of the trajectory. The figure shows trajectories that are colored with log(I(x,y,z)) signal. The color contrast can be switched between log(I(x,y,z)) and Δf(x,y,z) modes by press of a button. Please click here to view a larger version of this figure.
Protocol
Caution: PTCDA can be irritating to the skin or eyes and should therefore be handled with care using appropriate gloves. Please consult appropriate safety brochures. Cryogenic liquids can produce effects on the skin similar to a thermal burn or can cause frostbite on prolonged exposure. Always wear safety glasses and appropriate cryogenic gloves when handling cryogenic liquids. The gas formed by cryogenic liquids is very cold and usually heavier than air and can accumulate near the floor displacing air. When there is not enough air or oxygen, asphyxiation and death can occur. Please consult appropriate safety brochures.
1. Sample Preparation
- Deposition of PTCDA on Ag(111)
Note: The monolayer (ML) coverage of PTCDA should be between 10-30% and concentrated in large, compact islands (Figure 6). This situation is ideal to do manipulation experiments while having enough clean metal surface for tip preparation.- Clean the Ag(111) crystal before the deposition with a standard procedure of sputter and anneal cycles14.
- Sputter the crystal with Ar+ ions for 15 min. Use Ar pressure at 1 x 10⁻⁵ mbar, an ion energy of 0.8 keV and the crystal at room temperature (RT).
- Anneal the sample at 530 °C for 15-30 min.
- Use the PTCDA K-cell to deposit 0.1-0.3 ML of PTCDA on the Ag(111) sample at RT14.
NOTE: No deposition parameters are given, because the deposition conditions may differ from setup to setup. - After deposition, flash the sample to 200 °C for 2 min to improve ordering of the PTCDA islands and desorb possible contaminations.
- Optionally, inspect the deposition with LEED by checking the diffraction pattern of PTCDA on Ag(111)15.
- Use the setup-specific procedure to transfer the sample to the SPM. Typically, use a manipulator capable of linear transfer inside UHV and possibly a hand-operated wobble-stick.
- Clean the Ag(111) crystal before the deposition with a standard procedure of sputter and anneal cycles14.
- Check the sample preparation in the SPM.
- Wait after the sample transfer until the temperature of the SPM is close to its base temperature (here: 5 K). The duration in the described setup is about 1 hr for a sample cooled to LN2 temperature during transfer.
- Use the setup-specific procedure to approach the tip to the surface (in the constant current mode) until tunneling current appears.
- Choose the offset voltage of HV amplifier such that uz = 0. This will be the standard setting throughout the paper, if not specified otherwise.
- Inspect the sample preparation making constant current STM images (set point: I = 0.1 nA, bias voltage Vb = -0.35 V applied to the sample, current amplifier gain 1 x 10⁹ V/A) of the surface. The given parameters facilitate imaging of the lowest unoccupied molecular orbital (LUMO) of PTCDA. This helps to identify the location of carboxylic oxygen atoms of the molecule chosen for the manipulation (inset of Figure 6).
- Prepare the tip until the STM images look similar to Figure 6. For example use pulses of 5-6 V at tip-surface separation distances that correspond to the current imaging set point or move the tip by 7-10 Å (from the stabilization point) towards the clean Ag(111) surface while applying Vb = 0.1 V to the sample. Crash the tip deeper in case of a double tip. Do not use pulses close to PTCDA islands!
2. Setup AFM Operation with TFS
- Set the system-specific PLL parameters for the FM-AFM such that Δf detection is possible with acceptable noise conditions and detection speed (e.g., 0.1-0.5 Hz noise in Δf within 7 Hz bandwidth at the TFS oscillation amplitude of about 0.2-0.4 Å).
- Check the Q-factor (automatically calculated by the software) and determine f0 of the TFS.
- Retract the tip from the surface to the maximum distance the SPM controller is able to reach (e.g., by setting vz = -10 V which in case of the setup described here retracts the tip from the surface by approximately 180 Å).
- Record a resonance curve (TFS oscillation amplitude vs. drive frequency at constant TFS excitation amplitude) using the SPM software.
- Read the resonance frequency f0 as the position of the maximum of the resonance curve on the frequency axis. The Q-factor is calculated by the software from the width of the resonant peak. The Q-factor of the described setup varies between 50,000-70,000 (Figure 7).
- Position the tip over a clean Ag(111) surface area and calibrate the TFS oscillation amplitude following Ref. 16.
3. Integration of MCS in the SPM Setup
- Assemble and calibrate the MCS according to the manual obtained from the manufacturer. Calibration includes setting the origin of the MCS coordinate system.
- Following the system manual switch on the TO and add it as a tracked object in MCS software.
- Check if the tracking works correctly by moving the TO in the detection volume and following its position displayed by the MCS software.
- Test the connection between RVS and the software by sending a test command to RVS from window (see Figure 4).
- Test the connection between MCS, RVS and TipControl.
- Check if the vx-, vy-, vz-voltages of RVS are set to 0 V and reset them if needed.
- Retract the tip from the surface (2.2.1).
- Press "reset all" button in the software window to reset vx-, vy-, vz -voltages at the output of the RVS.
- Approach the tip back to the surface with FB loop closed (1.2.2).
- Position the tip over clean Ag(111) surface using the setup-specific function of the SPM software.
- Check x-, y-, z-checkboxes in the software window. This activates the hand-control mode of the tip position along all three spatial axes.
- Press "start" in the software window.
- Make sure that the vx-, vy-, vz-voltages generated by RVS respond correctly to the movement of TO along each of the axes. While moving along z-axis (vertically to the surface), monitor the reaction of the FB loop that attempts to compensate the applied from RVS vz-voltage.
- Press "pause" in the software window.
- Press "reset all" in the software window.
- Check if the vx-, vy-, vz-voltages of RVS are set to 0 V and reset them if needed.
4. Integration of the HMD in the SPM Setup
- Make sure the HMD is connected and all necessary drivers are installed according to the manual from the manufacturer.
- Start VRinterface and make sure it correctly renders the model surface, the adsorbed molecule and the tip (see Figure 5).
- Align the orientation of the coordinate system of the 3D virtual reality scene seen in the HMD with the coordinate axes of the MCS.
- Put on the HMD. If needed, reposition the HMD on your head while performing the following steps to either view the VR scene or the lab environment, keyboard and computer monitor.
- Test the live data transmission of I and Δf signals from the SPM electronics, e.g., by changing the tunneling current set point inside the SPM software.
- Check the x-, y-, z-checkboxes of the software window.
- Pick up the TO and press the "start" button of the software window.
- Move the TO and check if the sphere representing the tip is moving correctly inside the virtual 3D scene.
- Keep the hand holding the TO steady until the "pause" button of the software window is pressed.
- Put away the TO.
- Press "reset all" button of the software window.
5. Prepare SPM for the Manipulation of Single PTCDA Molecules
- Set the STM in constant current mode with the parameters that facilitate LUMO contrast for PTCDA and thus allow one to determine the molecular orientation (set point: I = 0.1 nA, bias voltage Vb = -0.35 V applied to the sample, current amplifier gain 1 x 10⁹ V/A).
- Make sure the tip is well prepared for manipulation.
- Image PTCDA. In the SPM software, enter the parameters for the scan (area to be scanned (like 300 x 300 Å2), set points for feedback loop: I = 0.1 nA and Vb = -0.35 V, scanning speed = 150 nm/sec) and press the "start" button in the SPM software. The resolution of the image must be similar to Figure 6.
- Make sure that the Δf that occurs when the tip is moved from tunneling contact to a large distance from the surface (>100 Å) is not much larger than 5-7 Hz.
- In case any of the above conditions are not fulfilled repeat the tip preparation over the clean Ag(111) surface (1.2.5).
- Find a surface area suitable for manipulation.
- Use SPM software to find an area similar to one shown in Figure 6 which contains a PTCDA island and some area of clean Ag(111) surface. If needed, use the clean area to reshape the tip between different manipulation attempts.
- Select a molecule inside PTCDA island for manipulation and record a detailed STM image (e.g., 50 x 50 Å2) as shown in Figure 6. Select "SetXYOffset - Top" from a drop-down menu and choose the area for the detailed image by clicking on a larger overview image.
NOTE: There are no special criteria since all molecules inside an island (about 3 molecules away from an edge) can be considered to be equal for manipulation. There should be no "dirt" visible on or next to the molecule. Such dirt would produce an irregular contrast in the image.
- Test the ability of the tip to bind to the PTCDA molecule.
- Position the tip over one of the two carboxylic oxygen atoms of PTCDA (marked in Figure 6) using the setup-specific function of the SPM software. Select "SetXYOffset - Top", and then click in the respective image.
- Record a spectrum in which the tip is moved vertically towards the surface by 3-5 Å and I(z) is recorded using the setup-specific functions of the SPM software.
- Set a constant bias voltage Vb (e.g., 6 mV) and define a ramp of tip height to approach and to retract the tip from the surface (e.g., 4 Å closer and back again). Then click on the button "vert. manip" in the SPM software and select a position on the most recently recorded STM image, where the vertical manipulation should be executed.
- Check if the recorded I(z) exhibits contact formation between the tip and the molecule in the form of the sharp (beyond z resolution of the recorded spectrum) increase of the current I(z). Typically the contact is strong enough for 0.5-3 Å lifting through vertical tip retraction (see Figure 8).
- If the I(z) curve does not show a sharp contact formation try one of the following:
- Change the lateral position of the tip slightly and repeat the approach procedure.
- Do a gentle tip forming (1.2.5) and try contacting the molecule again until the contact behavior like the one shown in Figure 8 is registered.
- If the I(z) curve does not show a sharp contact formation try one of the following:
- Wait until the piezo creep is gone (about 2-4 hr).
NOTE: The amount of drift determines the stability of the contact point during HCM and thereby how long one can execute successive manipulations with the same molecule without rescanning the area.- Test creep along the x-, y-directions by comparing two detailed STM images of the chosen operation area, recorded with a time interval, e.g., 5 min. Wait until the drift is less than 0.5 Å between the two successive images.
- Test creep in z-direction by recording uz(t) applied by the FB loop over 1 min and calculate the drift rate. duz(t)/dt should be about 0.2 Å/hr .
6. Preparation for Hand Controlled Manipulation (HCM)
- Ensure that all relevant programs are running and that the data transfer between the attached devices works correctly: MCS, TipControl, RVS, VRinterface, HMD and SPM electronics.
- Ensure that the orientation of the coordinate system of the HMD is aligned with the coordinate axes of the MCS.
- Align the image of the molecule shown as a visual aid in VRinterface with the orientation of the real molecule to be manipulated in experiment.
- Align the HMD along its coordinate system and orient it such that the point of view is above the reference molecule. Align the reference molecule in VRinterface to the imaged molecule in the SPM software by pressing the appropriate buttons on the keyboard to rotate it clockwise or anticlockwise.
- Check if the vx-, vy-, vz-voltages of RVS are set to 0 V and reset them if needed (3.5.1).
- Rescan the PTCDA molecule selected for manipulation with the STM in constant current mode.
- Position the tip over the carboxylic oxygen atom chosen for the manipulation using the appropriate function of the SPM software. Use the correct contact point as was determined in 5.4.
- Activate PLL and set the amplitude control mode. Set the oscillation amplitude as low as possible (e.g., 0.2-0.4 Å) but high enough such that Δf detection is possible with acceptable noise conditions and detection speed (see 2.1).
- Open the FB loop. Enter 0 for the integrator value in the SPM software parameter window.
- Set junction bias to a few mV in the SPM software parameter window. Enter 0.007 to apply 7 mV to the surface.
- Set the current amplifier gain to 1 x 10⁷ V/A in the SPM software parameter window.
7. Use HCM for Controlled Manipulation of PTCDA
- Put on the HMD and take the TO. If needed, reposition the HMD on the user's head while performing the following steps to either view the VR scene or the lab environment, keyboard and computer monitor.
- Set the color contrast of the recorded trajectories to log(I(x,y,z)) in VRinterface by pressing the appropriate button.
- Mark the contact point in the 3D virtual scene. This "anchor" helps to find the contact easily for further manipulation attempts using HCM without the need to reset the RVS.
- Activate hand-control along z-axis only by checking the corresponding checkbox in tip software while keeping x-, y-checkboxes unchecked.
- Move the TO down while watching the I(0,0,z) and Δf(0,0,z) real-time signals in the virtual scene. Stop moving the TO when the I(0,0,z) and Δf(0,0,z) signals show a simultaneous sharp jump, the signature of a contact formation (see Figure 8).
- Start trajectory recording in VRinterface by pressing the corresponding button and start moving the TO up.
- Stop trajectory recording in VRinterface as soon as the contact between molecule and tip ruptures by pressing the corresponding button. The signature is a simultaneous sharp drop of the I(x,y,z) and Δf(x,y,z) signals.
- Press "pause" button in the tip software to deactivate hand-control.
- Activate hand-control of the tip movement along all spatial axes by checking the x-, y-, z-checkboxes in the software and press the "start" button in the tip software.
- In case the point of contact formation deviates from the one "anchored" in the virtual scene after a manipulation (due to drift or any change of the tip apex) correct the tip position and the tip condition if needed.
- Move the tip back to its initial position before starting hand-control by moving the TO while watching the movement of the white sphere in the virtual scene.
- Press "pause" button in the tip software to deactivate hand-control.
- Press "reset all" button in the tip software to reset vx-, vy-, vz-voltages of RVS to 0 V.
- Set the STM back in constant current mode with the parameters that facilitate LUMO contrast for PTCDA (see 1.2.4).
- Rescan the molecule chosen for manipulation and position the tip at the correct location over the chosen carboxylic oxygen atom (determined in 5.4) using the setup-specific functions of the SPM software. If needed, prepare the tip at a nearby location (<300 Å away) to reduce the residual piezo creep.
- Restart the protocol at step 7.1.
- Try to find a successful lifting trajectory where the contacted molecule is completely detached from the surface at the end of the trajectory.
- Approach the point where the "anchor" exhibited formation of the tip-molecule contact by moving the TO while following the movement of the sphere representing the current tip position in the virtual scene. As soon as the contact is formed start recording a new trajectory in VRinterface.
- Pull the molecule in a direction suitable for lifting (Figure 10) by moving the TO accordingly. If a rupture of the tip-molecule contact is detected, stop recording the trajectory. Return to the contact point, start trajectory recording on contact formation and execute a different manipulation.
- Switch to Δf(x,y,z) color contrast of the recorded trajectories by pressing the appropriate button in VRinterface at larger distances from the surface (at about 7 Å with current amplifier gain 107 V/A), because I(x,y,z) signal decays fast away from the surface. Here Δf(x,y,z) becomes the sole indicator of the presence of the molecule (see Figure 1). When the molecule-tip contact is lost, Δf(x,y,z) jumps (close) to zero and does not change anymore even on approaching the surface for 1-3 Å.
- If the tip-molecule contact is still stable at z > 10 Å, watch out for a signature in Δf(x,y,z) where it shows a smooth transition to zero on pulling the molecule away from the surface. This is the signature for successful lifting of the molecule (see Figure 1).
- Test if the molecule is completely detached from the surface and hanging on the tip.
- Move the TO up to check if Δf(x,y,z) stays at zero on further tip retraction.
- Move the TO down to check if Δf(x,y,z) increases on approaching the surface for 1-3 Å beyond the height where the signature for successful lifting was detected.
- Deposit the lifted molecule to a clean Ag(111) surface area.
- After successful lifting, move the TO up to retract the tip an additional 10-20 Å from the surface. This reduces any interaction of the lifted molecule with the surface.
- Press "pause" button in the tip software to fix the current tip position and to deactivate hand-control.
- Without turning the FB loop on, use the setup-specific function of the SPM software to position the tip over clean Ag(111) surface some distance (e.g., 50-100 Å) away from the island where the molecule was extracted. Select "SetXYOffset - Top", and then click in the respective image.
- Set current amplifier gain to 1 x 10⁹ V/A.
- Check only z-checkbox in the tip software and press "start" button in the tip software.
- Move the TO to approach the surface until a measurable I(z) appears.
- Press "pause" button in the tip software to deactivate hand-control.
- Stepwise increase Vb (max. Vb ≈ 0.5 V, at higher Vb molecule could be damaged) by using a mouse-controlled slider in the SPM software until there is a simultaneous jump in I and Δf which indicates that the molecule dropped to the surface. If the molecule cannot be re-deposited, the tip has to be cleaned for further experiments, e.g., by voltage pulses (1.2.5).
- Scan the area in constant current mode (1.2.4) and check whether the molecule was indeed deposited back onto the surface.
Results
Note: This part shows work published in7,8.
Applying HCM to the problem of lifting PTCDA/Ag(111) out of a layer, we were able to write a pattern by sequentially removing individual molecules (Figure 9). In total 48 molecules were removed, 40 of which could be redeposited to the clean Ag(111), showing that the molecules stay intact during the manipulation process. This allows using HCM...
Discussion
Like other SPM-based methods, the molecular manipulation experiments described in this paper also depend to some extent on the properties of the SPM tip. The tip apex structure (which cannot be fully controlled) determines the strength of the tip-molecule bond. Hence the strength of the tip-molecule contact may vary considerably and thus sometimes may be too low. Hence within the protocol we refer to some basic tests of tip quality and tip treatment procedures. However, a more severe tip treatment might be required in so...
Disclosures
The authors have nothing to disclose and no competing financial interests.
Acknowledgements
The authors have no acknowledgements.
Materials
| Name | Company | Catalog Number | Comments |
| LN2 | caution: cryogenic liquid | ||
| LHe | caution: cryogenic liquid | ||
| PTCDA | caution: irritating substance | ||
| Knudsen cell (K-cell) | custom | ||
| ErLEED | Specs | used with power supply ErLEED 1000A | |
| combient LT NC-AFM/STM | Createc | ||
| qPlus sensor | Createc | TFS | |
| preamplifier | Createc | amplifier for tuning forc signal fixed to LN2 shield (stage 1) | |
| Low-Noise Voltage Preamplifier | Standford Research System | SR560 | external amplifier for tuning forc signal (stage 2) |
| Variable Gain Low Noise Current Amplifier | Femto | DLPCA-200 | amplifier for tunneling current |
| Bonita | Vicon | B10, SN: MXBN-0B10-3658 | MCS IR camera |
| Apex Interaction Device | Vicon | SN: AP0062 | MCS trackable object (TO) |
| MX Calibration Wand | Vicon | MCS calibration object | |
| Tracker | Vicon | MCS software | |
| BS series voltage supply | stahl-electronics | BS 1-4 | RVS |
| summing amplifier | custom, gain 1, based on operational amplifier TL072 | ||
| Oculus Rrift Development Kit 2 | Oculus VR | HMD | |
| TipControl | custom-written software | ||
| VRinterface | custom-written software |
References
- Barth, J. V., Costantini, G., Kern, K. Engineering atomic and molecular nanostructures at surfaces. Nature. 437, 671-679 (2005).
- Otero, R., Rosei, F., Besenbacher, F. Scanning tunneling microscopy manipulation of complex organic molecules on solid surfaces. Annu. Rev. Phys. Chem. 57, 497-525 (2006).
- Urgel, J. I., Ecija, D., Auwärter, W., Barth, J. V. Controlled Manipulation of Gadolinium Coordinated Supramolecules by Low-Temperature Scanning Tunneling Microscopy. Nano Lett. 14, 1369-1373 (2014).
- Fournier, N., Wagner, C., Weiss, C., Temirov, R., Tautz, F. S. Force-controlled lifting of molecular wires. Phys. Rev. B. 84, 035435 (2011).
- Wagner, C., Fournier, N., Tautz, F. S., Temirov, R. Measurement of the Binding Energies of the Organic-Metal Perylene-Tetracarboxylic-Dianhydride/Au(111) Bonds by Molecular Manipulation Using an Atomic Force Microscope. Phys. Rev. Lett. 109 (7), 076102 (2012).
- Wagner, C., et al. Non-additivity of molecule-surface van der Waals potentials from force measurements. Nat. Commun. 5, 5568 (2014).
- Green, M. F. B., et al. Patterning a hydrogen-bonded molecular monolayer with a hand-controlled scanning probe microscope. Beilstein Journal of Nanotechnology. 5, 1926-1932 (2014).
- Leinen, P., et al. Virtual reality visual feedback for hand-controlled scanning probe microscopy manipulation of single molecules. Beilstein J. Nanotechnol. 6, 2148-2153 (2015).
- Wagner, C., et al. Scanning Quantum Dot Microscopy. Phys. Rev. Lett. 115 (2), 026101 (2015).
- Mura, M., et al. Experimental and theoretical analysis of H-bonded supramolecular assemblies of PTCDA molecules. Phys. Rev. B. 81 (19), 195412 (2010).
- Besocke, K. An easily operable scanning tunneling microscope. Surf. Sci. Lett. (1-2), 145-153 (1987).
- Giessibl, F. J. Advances in atomic force microscopy. Rev. Mod. Phys. 75 (3), 949-983 (2003).
- Albrecht, T. R., Grütter, P., Horne, D., Rugar, D. Frequency modulation detection using high-Q cantilevers for enhanced force microscope sensitivity. J. Appl. Phys. 69 (2), 668-673 (1991).
- Temirov, R., Lassise, A., Anders, F. B., Tautz, F. S. Kondo effect by controlled cleavage of a single-molecule contact. Nanotechnology. 19 (6), 065401 (2008).
- Glöckler, K., et al. Highly ordered structures and submolecular scanning tunnelling microscopy contrast of PTCDA and DM-PBDCI monolayers on Ag(111) and Ag(110). Surf. Sci. 405 (1), 1-20 (1998).
- Simon, G. H., Heyde, M., Rust, H. -. P. Recipes for cantilever parameter determination in dynamic force spectroscopy: spring constant and amplitude. Nanotechnology. 18 (25), 255503 (2007).
- Rohlfing, M., Temirov, R., Tautz, F. S. Adsorption structure and scanning tunneling data of a prototype organic-inorganic interface PTCDA on Ag (111). Phys. Rev. B. 76 (11), 115421 (2007).
- Guthold, M., et al. Controlled Manipulation of Molecular Samples with the nanoManipulator. IEEE/ASME Trans. Mechatronics. 5 (2), 189-198 (2000).
Reprints and Permissions
Request permission to reuse the text or figures of this JoVE article
Request PermissionThis article has been published
Video Coming Soon
Copyright © 2025 MyJoVE Corporation. All rights reserved