
A subscription to JoVE is required to view this content. Sign in or start your free trial.
Method Article
A High Performance Impedance-based Platform for Evaporation Rate Detection
In This Article
Summary
This paper presents an impedance-based apparatus for evaporation rate detection of solutions. It offers clear advantages over a conventional weight loss approach: a fast response, high-sensitivity detection, a small sample requirement, multiple sample measurements, and easy disassembly for cleaning and reuse purposes.
Abstract
This paper describes the method of a novel impedance-based platform for the detection of the evaporation rate. The model compound hyaluronic acid was employed here for demonstration purposes. Multiple evaporation tests on the model compound as a humectant with various concentrations in solutions were conducted for comparison purposes. A conventional weight loss approach is known as the most straightforward, but time-consuming, measurement technique for evaporation rate detection. Yet, a clear disadvantage is that a large volume of sample is required and multiple sample tests cannot be conducted at the same time. For the first time in literature, an electrical impedance sensing chip is successfully applied to a real-time evaporation investigation in a time sharing, continuous and automatic manner. Moreover, as little as 0.5 ml of test samples is required in this impedance-based apparatus, and a large impedance variation is demonstrated among various dilute solutions. The proposed high-sensitivity and fast-response impedance sensing system is found to outperform a conventional weight loss approach in terms of evaporation rate detection.
Introduction
Evaporation is a type of liquid vaporization and occurs along the gas-liquid interface of a collective body of water. The water molecules near the surface become capable of escaping from the liquid due to collision of water molecules. The evaporation rate is an important key factor during the process of evaporation. Generally, a balance or volumetric tube1-3 is widely-used to detect the evaporation of solutions. However, it takes a long time to measure the evaporation rate due to the precision limitation of a balance or a volumetric tube. For this reason, a responsive and high-sensitivity instrument must be developed to probe into the details of the evaporation process.
Electrochemical impedance spectroscopy (EIS) is a fast-response, sensitive and effective experimental means in terms of in-situ impedance detection for electrochemical system characterization4. Therefore, EIS can be applied in various fields, such as recent studies on cellular behavior5, bioanalytical sensing6-7, electrolysis8, conducting polymers9, and electrochemical extraction10. Even though EIS systems had successfully been applied in a wide variety of disciplines, there exist an extremely small number of publications on its application to evaporation research.
Hyaluronic acid, a high molecular weight polysaccharide with strong water-binding potential, is a well-known humectant for cosmetic applications. One hyaluronic acid molecule can bind up to 500 water molecules11 and reach 1,000 times its original volume12. An extremely small amount of hyaluronic acid can possess moisturizing function13-14. Due to the high moisture retention, hyaluronic acid has become an important component of cosmetic humectant products with high commercial value worldwide15.
This study presents the method of a novel impedance-based apparatus featuring high speed detection, small volume sample requirement, and multiple sample measurements16-19. It is presented with a focus on the relative evaporation rate comparison among solutions as a way to validate the superiority of the innovative detection mechanism over a conventional weighing manner.
Protocol
1. Experimental Chip Module
- Fabricate the indium tin oxide (ITO) electrode chip by photolithography and chemical wet etching processes
- Obtain an ITO substrate (370 mm x 480 mm x 0.5 mm (L x W x H)) with a 2,600 Å ITO layer commercially (See Materials List). Slice the ITO substrate to the dimensions of 90 mm x 90 mm x 0.5 mm with a glass cutter for the ITO electrode patterning process in a 4 inch aligner.
- Use an ultrasonic cleaner to clean the ITO glass with acetone and then with deionized water, for 15 min each. Dry the ITO glass with clean dry air.
- Dispense 5 ml of positive photoresist solution onto the surface of the ITO glass.
- Use spin coater at 500 x g for 30 sec to produce a uniform photoresist layer. Then bake on a hotplate at 90 °C for 5 min to drive off excess solvent in the photoresist.
- Expose the ITO glass to 14 mW of ultraviolet light at 436 nm for 3.1 sec through a film photomask with the designed pattern (See Materials List).
- Immerse the sample in 60 ml development solution at 23 °C for 30 sec to develop the patterned routes. Then bake on a hotplate at 120 °C for 10 min to harden the photoresist and improve photoresist adhesion.
- Immerse the sample for 3 min in 60 ml etching solution at 80 °C to etch the unprotected ITO layer.
- Immerse the sample for 1 min in 60 ml acetone to remove photoresist on surface of the ITO glass.
- Slice the ITO glass into the dimensions of 62 mm x 35 mm for the experimental ITO electrode chip (Figure 1) with a glass cutter.

Figure 1: ITO electrode chip. The fabricated ITO chip with 8 pairs of electrode-patterned routes is shown. There are 15 electrodes measuring 2 mm x 8 mm at the side edge, and the central two routes share the same electrode. The distance between each pair of electrode fingers in a test well is 7 mm. Please click here to view a larger version of this figure.
- Construct the experimental chip module
- Clean the commercial 8-well silicone array with an ultrasonic cleaner as shown in Figure 2 with detergent, then deionized water, then 95% ethanol, and then deionized water, for 15 min each.
- Dry the 8-well silicone array by blowing clean dry air.
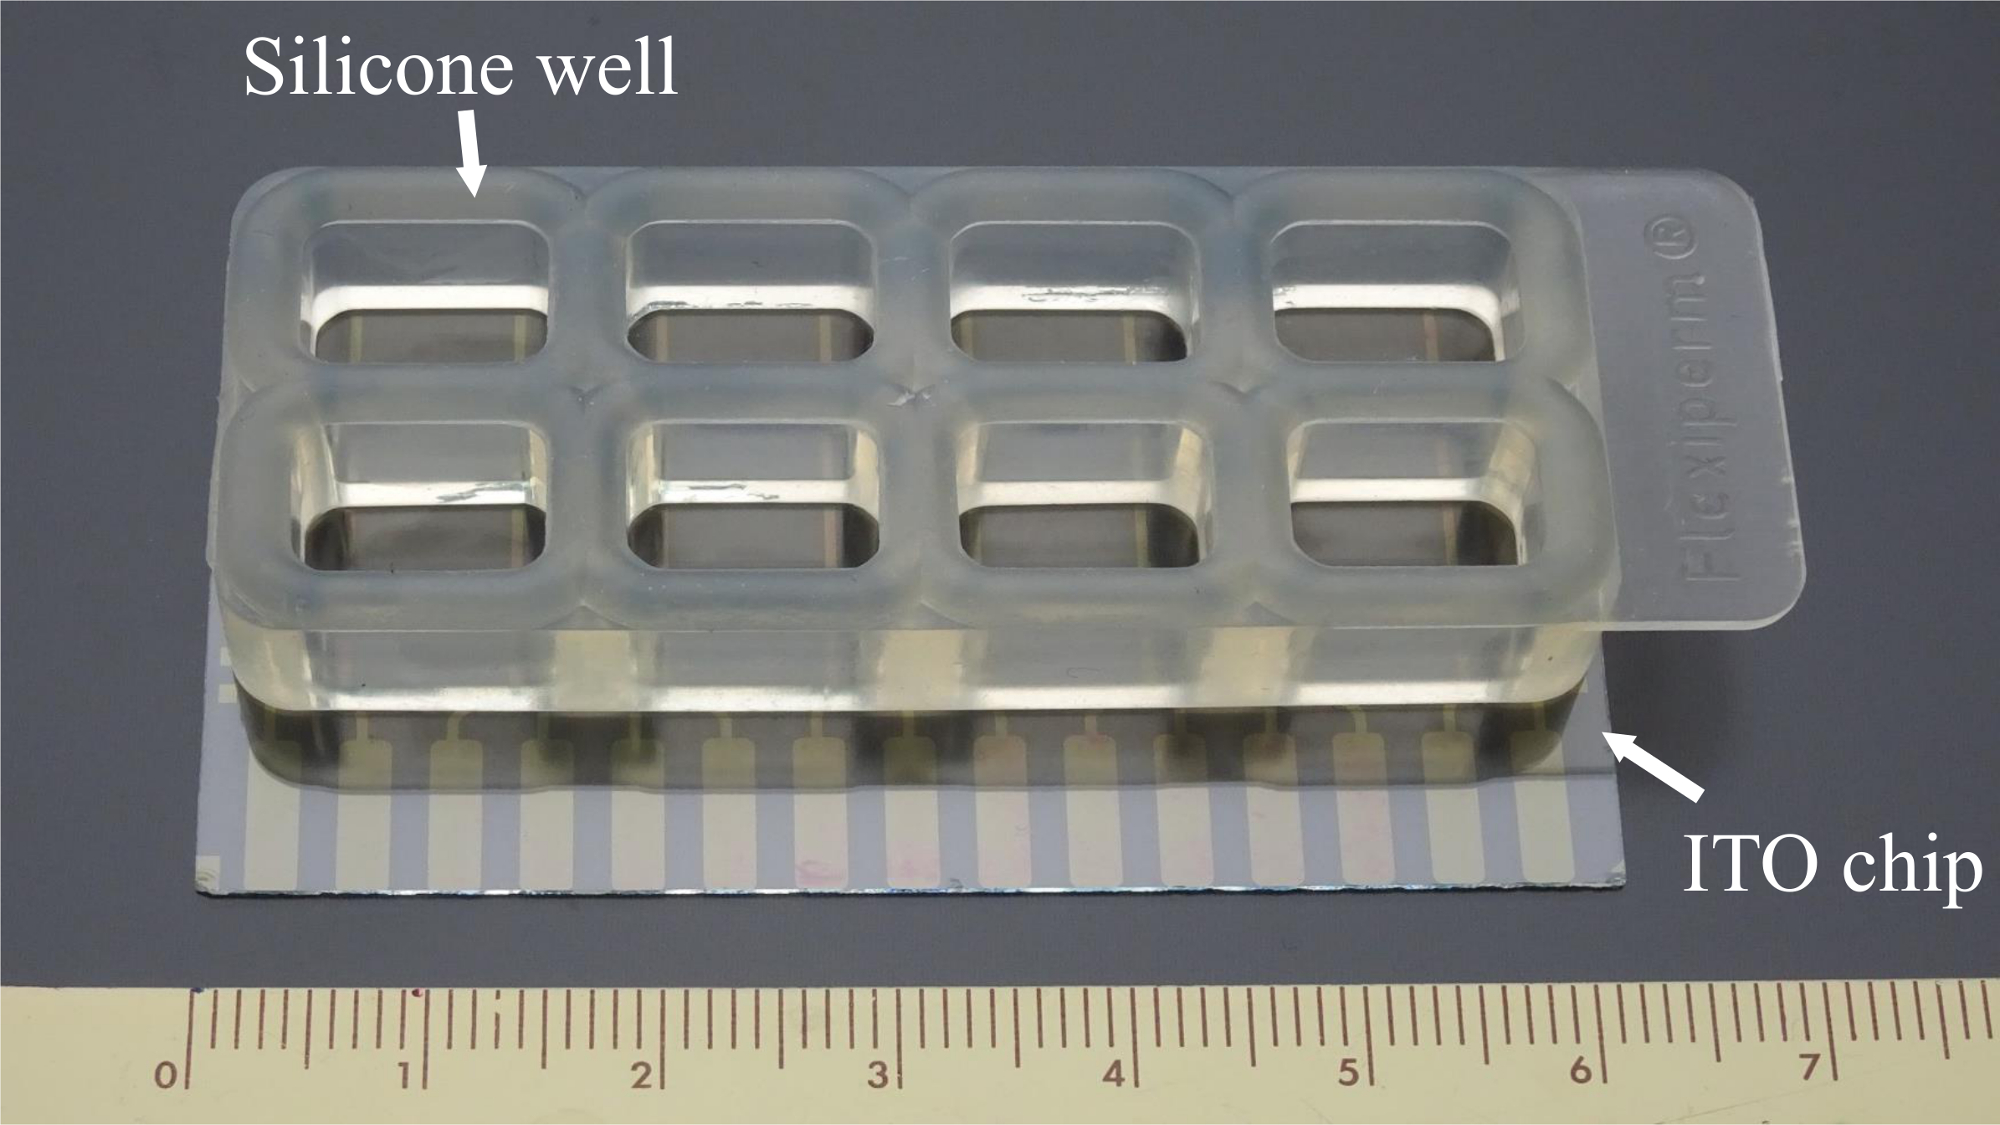
- Press the 8-well silicone array into the ITO chip in order to form the experimental chip module (Figure 3). Tightly bind the silicone array and ITO chip.

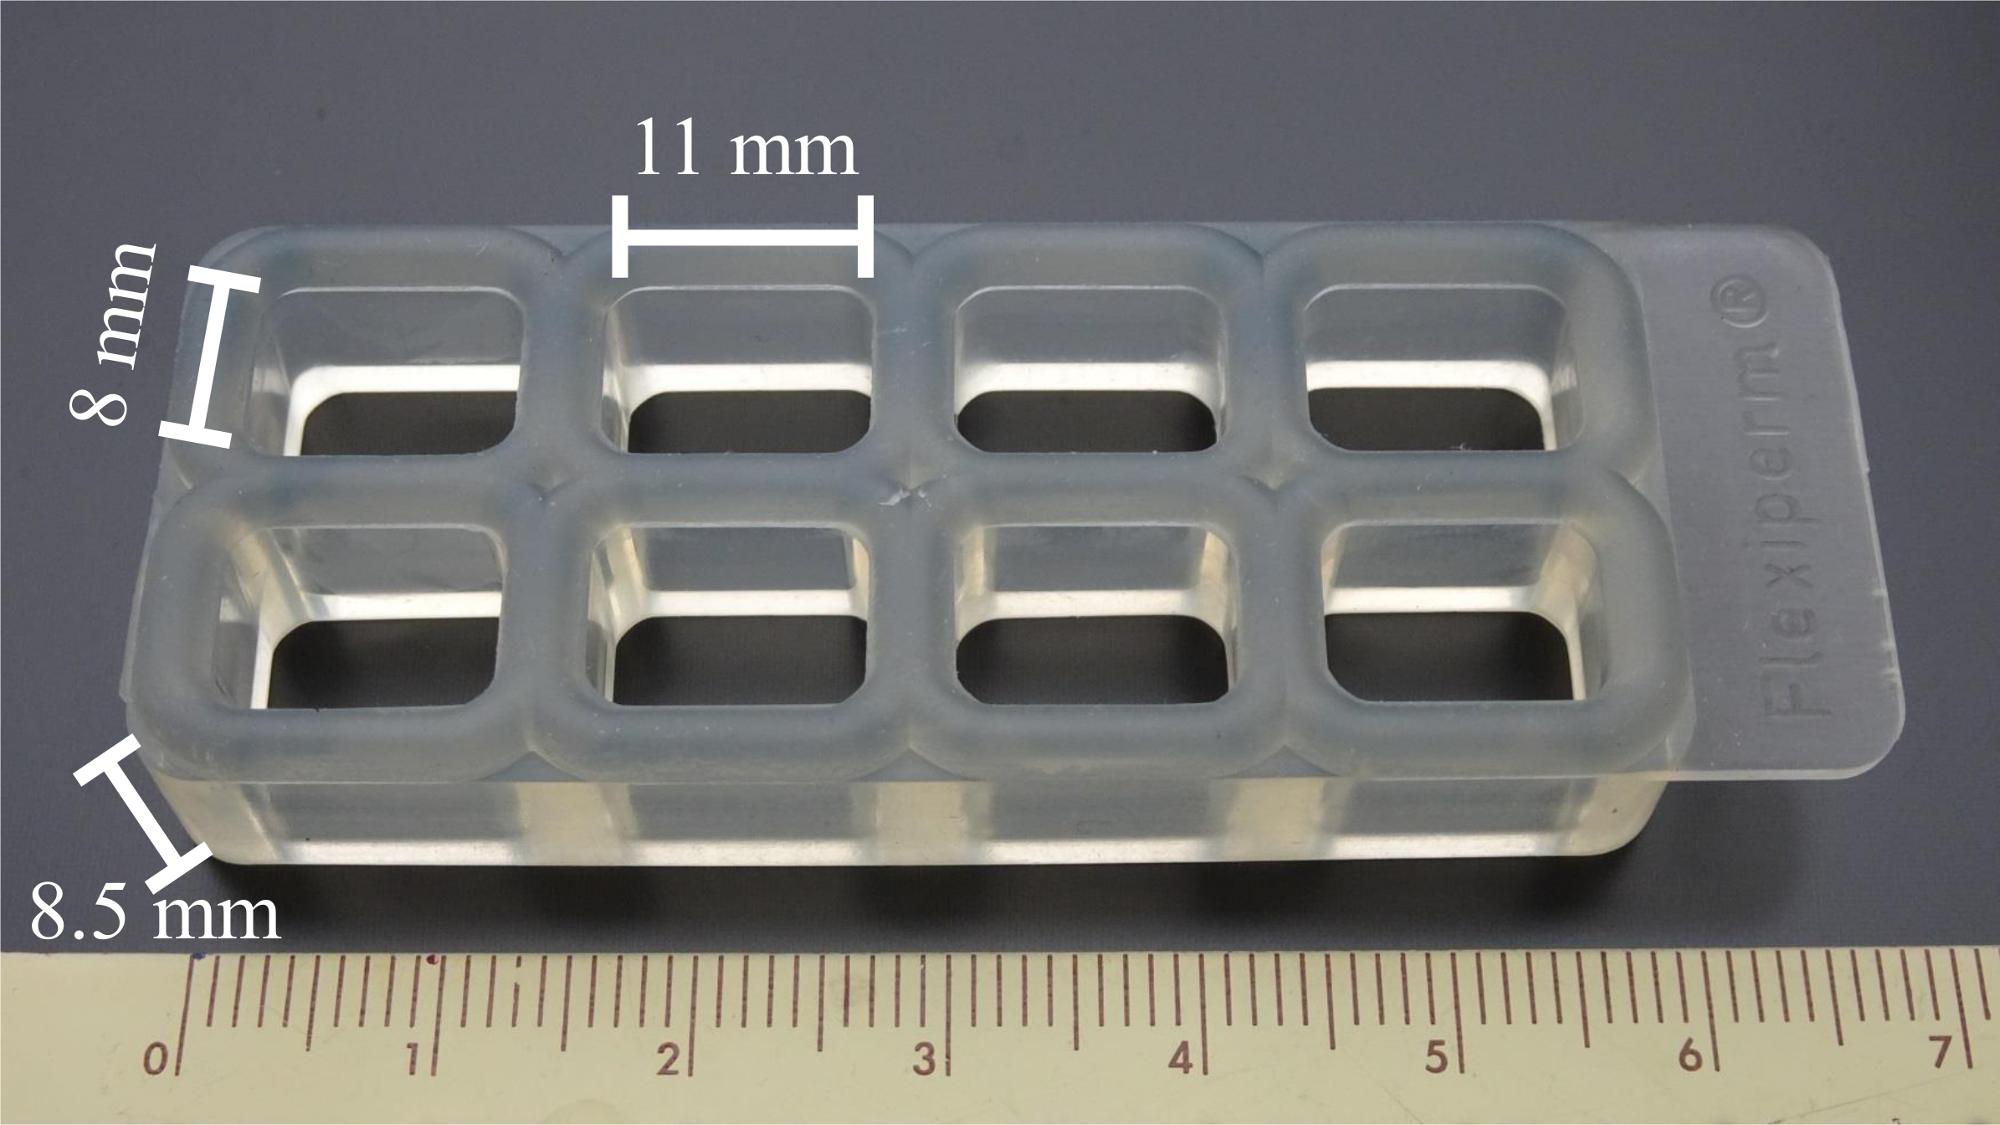
Figure 2: Silicone well array. The commercial 8-well silicone array can hold 8 tested samples simultaneously. The size of each well is 11 mm x 8 mm x 8.5 mm (L x W x H). Please click here to view a larger version of this figure.

Figure 3: Experimental chip module. The ITO electrode chip is attached with the 8-well silicone array to form the experimental chip module. The adhesion between the silicone array and the ITO chip is strong. Therefore, the silicone array and the ITO chip can bond together for use without any adhesive substance. Please click here to view a larger version of this figure.
2. Impedance Measurement
- Connect the personal computer, lock-in amplifier, and switch relay to form the impedance readout module as shown in Figure 4.

Figure 4: Schematic of the impedance-based apparatus. The lock-in amplifier, switch relay, and personal computer comprise the impedance readout module. The commercial phase-sensitive lock-in amplifier is used to send and extract the electrical signals. The homemade switch relay circuit connecting various ITO chips is used to specify which well and which ITO chip to be tested. A total of 6 chips can be connected to the switch relay specifying 48 samples in a time sharing manner. The real-time in-phase resistance and the signal phase shift of the tested solution are recorded continuously on a personal computer for the whole evaporation process. Please click here to view a larger version of this figure.
- Put the experimental chip module into the socket of the switch relay.
- Input parameters in the computer program. Input the signal frequency (1 kHz), the specified well number (0-7), the execution cycle (100), and the filename (HA).
3. Evaporation Experiments
- Prepare four 2.5 ml hyaluronic acid solutions at 0, 0.05, 0.5 and 1 w/v% in water. Place each 2.5 ml sample solution in a vial measuring 14.75 mm x 45 mm x 8 mm (O.D. x H x I.D.).
- For each solution, add 0.5 ml sample solution to a single well of the ITO chip module.
- Weigh and record the initial weight of each vial by the electronic balance machine.
- Execute the computer program to automatically measure and record the real-time in-phase resistance and the signal phase shift of specified wells on the ITO chip.
- Start the evaporation experiments simultaneously in the same place by both the weighing method and impedance method.
- Weigh and record the weight of each vial by the electronic balance machine at scheduled time points.
- Analyze collected data in the weighing method and impedance method.19
Results
During the evaporation process, the conductive ions in the tested solution became concentrated with the decreasing solution volume, and the impedance of this solution decreased. The rates of weight loss and impedance decrease in the evaporation progress for each tested solution were measured. For comparison purposes, the data in the rates of weight loss and impedance decrease were normalized to water and then plotted together in Figure 5. As illustrated in Figure 5, the weight loss demon...
Discussion
The critical step for evaporation measurement in this impedance-based detection is the preparation of the tested solutions. Deionized water cannot be used due to its enormous impedance. Instead, tap water containing conductive ions was used to prepare hyaluronic acid solutions for experiments. However, the electrical properties of tap water were not constant for use. Therefore, normalization, such as the relative evaporation rate to water in this study, was adopted as an alternative index for...
Disclosures
The authors have nothing to disclose.
Acknowledgements
This work was sponsored by the Ministry of Science and Technology, Taiwan, under grant numbers MOST 104-2221-E-241-001-MY3 and MOST 105-2627-B-005-002.
Materials
| Name | Company | Catalog Number | Comments |
| 95% ethanol | Echo Chemical Co., Ltd., Miaoli, Taiwan | 484000001103C-00EC | |
| Acetone | Avantor Performance Materials Inc., Center Valley, PA, USA | JTB-9005-68 | |
| Development solution | Kemitek Industrial Crop., Hsinchu, Taiwan | 12F01031 | KTD-1 |
| Etching solution | eSolv Technology Co., Taipei, Taiwan | EG-462 | |
| Hyaluronic acid | Shandong Freda Biopharm Co., Ltd., Jinan, China | 1010212 | Molecular weight 980k, Cosmetic Grade |
| Photoresist solution | AZ Electronic Materials Taiwan Co., Ltd., Hsinchu, Taiwan | 65101M19 | AZ6112 |
| 8-well silicone array | Greiner bio-one Inc., Frickenhausen, Baden-Württemberg, Germany | FlexiPERM | |
| ITO glass | GemTech Optoelectronics Co., Taoyuan, Taiwan | ||
| Vial | Sigma-Aldrich Co. LLC., St. Louis, MO, USA | 854190 | |
| Film photomask | Taiwan Mesh Co., Ltd, Taoyuan, Taiwan | ||
| Lock-in amplifier | Stanford Research Systems, Inc., Palo Alto, CA, USA | SR830 | |
| Switch relay | Instrument Technology Research Center, National Applied Research Laboratories, Hsinchu, Taiwan | ||
| Electronic balance machine | Radwag Inc., Radom, Poland | AS 60/220/C/2 |
References
- Francis, G. W., Bui, Y. T. H. Changes in the composition of aromatherapeutic Citrus oils during evaporation. Evid.-based Complement Altern. Med. 2015 (421695), 1-6 (2015).
- Ochiai, N., et al. Extension of a dynamic headspace multi-volatile method to milliliter injection volumes with full sample evaporation: application to green tea. J. Chromatogr. A. 1421, 103-113 (2015).
- Zribi, W., Aragues, R., Medina, E., Faci, J. M. Efficiency of inorganic and organic mulching materials for soil evaporation control. Soil Tillage Res. 148, 40-45 (2015).
- Chang, B. Y., Park, S. M. Electrochemical impedance spectroscopy. Annu. Rev. Anal. Chem. 3, 207-229 (2010).
- Brooks, E. K., Tobias, M. E., Yang, S., Bone, L. B., Ehrensberger, M. T. Influence of MC3T3-E1 preosteoblast culture on the corrosion of a T6-treated AZ91 alloy. J. Biomed. Mater. Res. Part B. 104 (2), 253-262 (2016).
- Tabrizi, M. A., Shamsipur, S., Farzin, L. A high sensitive electrochemical aptasensor for the determination of VEGF165 in serum of lung cancer patient. Biosens. Bioelectron. 74, 764-769 (2015).
- Tran, T. B., Nguyen, P. D., Baek, C., Min, J. Electrical dual-sensing method for real-time quantitative monitoring of cell-secreted MMP-9 and cellular morphology during migration process. Biosens. Bioelectron. 77, 631-637 (2016).
- Kruger, A. J., Krieg, H. M., van der Merwe, J., Bessarabov, D. Evaluation of MEA manufacturing parameters using EIS for SO2 electrolysis. Int. J. Hydrog. Energy. 39 (32), 18173-18181 (2014).
- Guler, Z., Sarac, A. S. Electrochemical impedance and spectroscopy study of the EDC/NHS activation of the carboxyl groups on poly(ε-caprolactone)/poly(m-anthranilic acid) nanofibers. Express Polym. Lett. 10 (2), 96-110 (2016).
- Xi, X., Si, G., Nie, Z., Ma, L. Electrochemical behavior of tungsten ions from WC scrap dissolution in a chloride melt. Electrochim. Acta. 184, 233-238 (2015).
- Olejnik, A., Goscianska, J., Zielinska, A., Nowak, I. Stability determination of the formulations containing hyaluronic acid. Int. J. Cosmetic Sci. 37, 401-407 (2015).
- Marcellin, E., Steen, J. A., Nielsen, L. K. Insight into hyaluronic acid molecular weight control. Appl. Microbiol. Biotechnol. 98, 6947-6956 (2014).
- Laurent, T. C., Laurent, U. B. G., Fraser, J. R. E. The structure and function of hyaluronan: An overview. Immunol. Cell Biol. 74 (2), A1-A7 (1996).
- Papakonstantinou, E., Roth, M., Karakiulakis, G. Hyaluronic acid: A key molecule in skin aging. Derm.-Endocrinol. 4 (3), 253-258 (2012).
- Sze, J. H., Brownlie, J. C., Love, C. A. Biotechnological production of hyaluronic acid: A mini review. 3 Biotech. 6, 67 (2016).
- Lin, C. Y., et al. Real-time detection of β1 integrin expression on MG-63 cells using electrochemical impedance spectroscopy. Biosens. Bioelectron. 28 (1), 221-226 (2011).
- Hsiao, S. Y., et al. Chemical-free and reusable cellular analysis: Electrochemical impedance spectroscopy with a transparent ITO culture chip. Int. J. Technol. Hum. Interact. 8 (3), 1-9 (2012).
- Lin, Y. S., et al. A real-time impedance-sensing chip for the detection of emulsion phase separation. Electrophoresis. 34 (12), 1743-1748 (2013).
- Lin, Y. S., Chen, C. Y. A novel evaporation detection system using an impedance sensing chip. Analyst. 139 (22), 5781-5784 (2014).
- Tseng, S. F., et al. Graphene-based chips fabricated by ultraviolet laser patterning for anelectrochemical impedance spectroscopy. Sens. Actuator B-Chem. 226, 342-348 (2016).
- Pavicic, T., et al. Efficacy of cream-based novel formulations of hyaluronic acid of different molecular weights in anti-wrinkle treatment. J. Drugs Dermatol. 10 (9), 990-1000 (2011).
- Gotoh, S., et al. Effects of the molecular weight of hyaluronic acid and its action mechanisms on experimental joint pain in rats. Ann. Rheum. Dis. 52 (11), 817-822 (1993).
- Saettone, M. F., Nannipieri, E., Cervetto, L., Eschini, N., Carelli, V. Electrical impedance changes and water content in O/W emulsions during evaporation. Int. J. Cosmetic Sci. 2 (2), 63-75 (1980).
- Fernandez-Sanchez, C., McNeil, C. J., Rawson, K. Electrochemical impedance spectroscopy studies of polymer degradation: application to biosensor development. Trac-Trends Anal. Chem. 24 (1), 37-48 (2005).
Reprints and Permissions
Request permission to reuse the text or figures of this JoVE article
Request PermissionThis article has been published
Video Coming Soon
Copyright © 2025 MyJoVE Corporation. All rights reserved